Grundläggande statistik
| Institutionella ägare | 1083 total, 1079 long only, 1 short only, 3 long/short - change of 3,34% MRQ |
| Genomsnittlig portföljallokering | 1.1942 % - change of −4,15% MRQ |
| Institutionella aktier (lång) | 437 203 043 (ex 13D/G) - change of −9,53MM shares −2,13% MRQ |
| Institutionellt värde (lång) | $ 22 054 281 USD ($1000) |
Institutionellt ägande och aktieägare
SPDR Series Trust - SPDR Portfolio S&P 500 Value ETF (US:SPYV) har 1083 Institutionella ägare och aktieägare som har lämnat in 13D/G- eller 13F-formulär till Securities Exchange Commission (SEC). Dessa institut innehar totalt 437,264,843 aktier. Största aktieägare inkluderar Financial Engines Advisors L.L.C., LPL Financial LLC, Allworth Financial LP, Morgan Stanley, Valmark Advisers, Inc., Ameriprise Financial Inc, Jpmorgan Chase & Co, UBS Group AG, Bank Of America Corp /de/, and Raymond James Financial Inc .
SPDR Series Trust - SPDR Portfolio S&P 500 Value ETF (ARCA:SPYV) Institutionell ägarstruktur visar institutioners och fonders nuvarande positioner i företaget, samt de senaste förändringarna i positionernas storlek. Större aktieägare kan vara enskilda investerare, fonder, hedgefonder eller institutioner. Bilaga 13D visar att investeraren äger (eller ägde) mer än 5% av företaget och avser (eller avsåg) att aktivt eftersträva en förändring av affärsstrategin. Schedule 13G indikerar en passiv investering på över 5%.
The share price as of September 12, 2025 is 54,66 / share. Previously, on September 13, 2024, the share price was 52,07 / share. This represents an increase of 4,97% over that period.

Fondsentimentets poäng
Fondsentimentet poängen(fka Ägarackumulation-poäng) visar vilka aktier som är mest köpta av fonder. Det är resultatet av en sofistikerad kvantitativ flerfaktormodell som identifierar företag med de högsta nivåerna av institutionell ackumulering. Poängsättningsmodellen använder en kombination av den totala ökningen av redovisade ägare, förändringarna i portföljallokeringarna för dessa ägare och andra mått. Siffran sträcker sig från 0 till 100, där högre siffror indikerar en högre nivå av ackumulering i förhållande till sina konkurrenter, och 50 är genomsnittet.
Uppdateringsfrekvens: Dagligen
Se Ownership Explorer, som innehåller en lista över de högst rankade företagen.
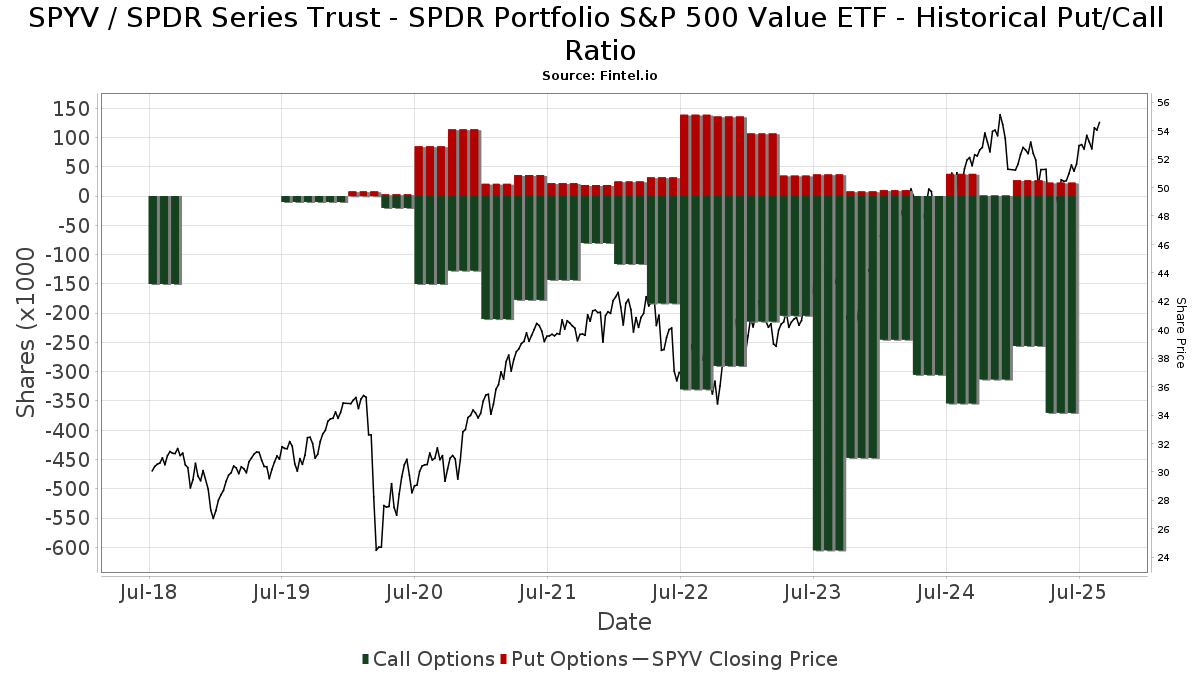
Institutionell sälj/köp-kvot
Förutom att rapportera vanliga eget kapital- och skuldemissioner måste institutioner med mer än 100MM tillgångar under förvaltning också avslöja sina innehav av sälj- och köpoptioner. Eftersom säljoptioner i allmänhet indikerar ett negativt sentiment och köpoptioner indikerar ett positivt sentiment, kan vi få en uppfattning om det övergripande institutionella sentimentet genom att plotta förhållandet mellan säljoptioner och köpoptioner. Diagrammet till höger visar det historiska förhållandet mellan sälj- och köpoptioner för detta instrument.
Genom att använda sälj/köp-kvoten som en indikator på aktieägarnas sentiment undviker man en av de största bristerna med att använda det totala institutionella ägandet, nämligen att en betydande del av de förvaltade tillgångarna investeras passivt för att följa index. Passivt förvaltade fonder köper vanligtvis inte optioner, så indikatorn för sälj/köp-kvoten ger en bättre bild av stämningen i aktivt förvaltade fonder.
13F- och NPORT-arkiveringar
Detaljer om 13F-arkiveringar är gratis. Detaljer om NP-arkiveringar kräver ett premiummedlemskap. Gröna rader indikerar nya positioner. Röda rader indikerar stängda positioner. Klicka på länk symbolen för att se hela transaktionshistoriken.
Uppgradera
för att låsa upp premiumdata och exportera till Excel ![]() .
.
Important Note
In an effort to reduce load times for our mobile users, we are testing some ways to deliver lighter pages.
In this first test, we will deliver only the most recent 750 transactions (out of 1194 for this stock). If you are interested in loading *all* the transactions for this company, click the "load all" button below. This is just a test and if you don't like it, please let us know by submitting some gentle feedback via the link at the bottom of this page.
Load All| Fil Datum | Källa | Investerare | Typ | Genomsnittligt pris (beräknat) |
Aktier | Δ Aktier (%) |
Rapporterat värde (1000 USD) |
Δ Värde (%) |
Portföljallokering (%) |
|
|---|---|---|---|---|---|---|---|---|---|---|
| 2025-08-14 | 13F | Ariadne Wealth Management, LP | 5 029 | 0,00 | 273 | 8,80 | ||||
| 2025-07-21 | 13F | DHJJ Financial Advisors, Ltd. | 3 | 0,00 | 0 | |||||
| 2025-07-15 | 13F | FLP Wealth Management, LLC | 0 | −100,00 | 0 | |||||
| 2025-08-01 | 13F | Liberty Wealth Management Llc | 8 215 | −41,78 | 430 | 4,13 | ||||
| 2025-08-14 | 13F | Qube Research & Technologies Ltd | 10 800 | 28,48 | 565 | 31,70 | ||||
| 2025-07-30 | 13F | Wallace Advisory Group, LLC | 11 267 | 1,29 | 575 | 1,23 | ||||
| 2025-08-05 | 13F | Burney Co/ | 66 513 | 40,25 | 3 481 | 43,78 | ||||
| 2025-08-06 | 13F | Mascagni Wealth Management, Inc. | 6 551 | 0,28 | 343 | 2,70 | ||||
| 2025-07-08 | 13F | Choice Wealth Advisors, LLC | 538 690 | 0,60 | 28 195 | 3,10 | ||||
| 2025-07-28 | 13F | BRYN MAWR TRUST Co | 7 650 | 0,00 | 400 | 2,56 | ||||
| 2025-07-31 | 13F | Carnegie Capital Asset Management, LLC | 10 739 | 0,00 | 562 | 14,23 | ||||
| 2025-08-14 | 13F | Permanens Capital L.P. | 0 | −100,00 | 0 | |||||
| 2025-07-24 | 13F | JNBA Financial Advisors | 102 445 | −5,37 | 5 362 | −3,02 | ||||
| 2025-07-28 | 13F | RFG Advisory, LLC | 71 739 | −30,08 | 3 755 | −28,35 | ||||
| 2025-08-14 | 13F | Tennessee Valley Asset Management Partners | 711 937 | 3,13 | 37 263 | 5,70 | ||||
| 2025-08-12 | 13F | Steward Partners Investment Advisory, Llc | 51 332 | −4,75 | 2 687 | −2,40 | ||||
| 2025-06-03 | 13F/A | First National Bank Of Omaha | 13 456 | −2,75 | 687 | 6,51 | ||||
| 2025-07-14 | 13F | Farmers & Merchants Investments Inc | 340 | 0,00 | 18 | 0,00 | ||||
| 2025-08-14 | 13F | Coastal Bridge Advisors, LLC | 20 695 | 41,57 | 1 083 | 45,17 | ||||
| 2025-08-11 | 13F | Howard Wealth Management, Llc | 22 311 | −1,76 | 1 168 | 0,69 | ||||
| 2025-07-11 | 13F | Spring Capital Management, Llc | 18 490 | 0,00 | 968 | 2,44 | ||||
| 2025-08-04 | 13F | Integrity Alliance, Llc. | 79 080 | −44,42 | 4 139 | −43,04 | ||||
| 2025-08-04 | 13F | Creekmur Asset Management LLC | 3 976 | 191,07 | 208 | 201,45 | ||||
| 2025-07-22 | 13F | Net Worth Advisory Group | 7 000 | 366 | ||||||
| 2025-07-18 | 13F | Vicus Capital | 645 443 | 10,26 | 33 783 | 13,01 | ||||
| 2025-07-17 | 13F | Fiduciary Advisors, Inc. | 502 | 26 | ||||||
| 2025-07-15 | 13F | McAdam, LLC | 330 910 | 23,07 | 17 320 | 26,13 | ||||
| 2025-07-17 | 13F | PMG Wealth Management, Inc. | 10 867 | 0,00 | 569 | 2,53 | ||||
| 2025-08-13 | 13F | Providence Capital Advisors, LLC | 61 | 3 | ||||||
| 2025-05-14 | 13F | Van Hulzen Asset Management, LLC | 0 | −100,00 | 0 | |||||
| 2025-05-09 | 13F | Encompass More Asset Management | 0 | −100,00 | 0 | |||||
| 2025-08-08 | 13F | Capstone Financial Advisors, Inc. | 5 387 | 282 | ||||||
| 2025-08-13 | 13F | First Trust Advisors Lp | 11 380 | 0,25 | 596 | 2,76 | ||||
| 2025-08-14 | 13F | Fort Point Capital Partners LLC | 13 148 | 1,32 | 688 | 3,93 | ||||
| 2025-08-15 | 13F | Kestra Advisory Services, LLC | 198 387 | 43,50 | 10 384 | 47,07 | ||||
| 2025-07-09 | 13F | Breakwater Investment Management | 26 | 0,00 | 1 | 0,00 | ||||
| 2025-07-16 | 13F | Twelve Points Wealth Management LLC | 6 685 | 0,00 | 350 | 2,35 | ||||
| 2025-07-29 | 13F | Portland Financial Advisors Inc | 8 290 | 0,00 | 434 | 2,36 | ||||
| 2025-05-13 | 13F | BKD Wealth Advisors, LLC | 0 | −100,00 | 0 | |||||
| 2025-08-27 | 13F | Barnes Wealth Management Group, Inc | 17 395 | 0,27 | 910 | 2,82 | ||||
| 2025-07-16 | 13F | Castleview Partners, Llc | 13 070 | −0,10 | 684 | 2,40 | ||||
| 2025-08-14 | 13F | Colony Group, LLC | 189 869 | 2,16 | 9 938 | 4,70 | ||||
| 2025-07-22 | 13F | Red Tortoise LLC | 70 172 | 0,30 | 3 673 | 2,77 | ||||
| 2025-08-08 | 13F | Avantax Advisory Services, Inc. | 441 220 | 0,95 | 23 093 | 3,45 | ||||
| 2025-08-12 | 13F | Journey Strategic Wealth Llc | 398 782 | 14,07 | 20 872 | 16,91 | ||||
| 2025-08-08 | 13F | Collaborative Wealth Managment Inc. | 193 124 | 2,11 | 10 108 | 4,66 | ||||
| 2025-04-30 | 13F | Alpha Cubed Investments, LLC | 0 | −100,00 | 0 | |||||
| 2025-07-22 | 13F | Valley National Advisers Inc | 4 352 | 0,00 | 0 | |||||
| 2025-08-14 | 13F | Syon Capital Llc | 11 645 | −41,40 | 609 | −39,94 | ||||
| 2025-08-11 | 13F | Berkeley, Inc | 6 104 | 0,00 | 319 | 2,57 | ||||
| 2025-08-13 | 13F | Rsm Us Wealth Management Llc | 11 049 | 70,88 | 578 | 75,15 | ||||
| 2025-07-29 | 13F | Stephens Inc /ar/ | 231 966 | 10,93 | 12 141 | 13,69 | ||||
| 2025-08-06 | 13F | Strategic Financial Partners, Ltd. | 348 842 | 35,07 | 18 258 | 38,43 | ||||
| 2025-08-14 | 13F | Two Sigma Investments, Lp | 0 | −100,00 | 0 | |||||
| 2025-08-04 | 13F | REDW Wealth LLC | 24 706 | 0,00 | 1 293 | 2,54 | ||||
| 2025-08-14 | 13F | Hrt Financial Lp | 62 533 | 543,28 | 3 | |||||
| 2025-07-09 | 13F | Fiduciary Alliance LLC | 4 612 | 241 | ||||||
| 2025-07-30 | 13F | Klingman & Associates, LLC | 1 196 168 | 5,67 | 62 607 | 8,29 | ||||
| 2025-08-14 | 13F | Frisch Financial Group, Inc. | 20 017 | 111,15 | 1 | |||||
| 2025-07-31 | 13F | Curio Wealth, Llc | 153 | 15 200,00 | 8 | 14,29 | ||||
| 2025-08-11 | 13F | Diversified Portfolios, Inc. | 23 217 | 0,67 | 1 215 | 3,23 | ||||
| 2025-08-12 | 13F | Twin Focus Capital Partners, Llc | 30 244 | 6,33 | 1 583 | 8,95 | ||||
| 2025-08-01 | 13F | First National Trust Co | 2 103 940 | 7,22 | 110 120 | 9,89 | ||||
| 2025-08-14 | 13F | Abound Financial, Llc | 283 471 | 10,84 | 14 837 | 13,60 | ||||
| 2025-07-23 | 13F | Capstone Wealth Management Group, Llc | 27 233 | 13,15 | 1 425 | 15,95 | ||||
| 2025-08-15 | 13F | Tower Research Capital LLC (TRC) | 10 320 | −61,92 | 540 | −60,98 | ||||
| 2025-08-27 | NP | Advanced Series Trust - Ast Hotchkis & Wiley Large-cap Value Portfolio | 683 426 | 0,00 | 35 771 | 2,49 | ||||
| 2025-08-13 | 13F | Kayne Anderson Rudnick Investment Management Llc | 404 | 0,00 | 21 | 5,00 | ||||
| 2025-07-31 | 13F | CAP Partners, LLC | 37 781 | 29,86 | 1 977 | 33,13 | ||||
| 2025-07-24 | 13F | Costello Asset Management, INC | 4 104 | −8,90 | 215 | −6,96 | ||||
| 2025-07-30 | 13F | Cavalier Investments, LLC | 0 | −100,00 | 0 | |||||
| 2025-07-14 | 13F | GAMMA Investing LLC | 117 | 6 | ||||||
| 2025-07-22 | 13F | Awm Capital, Llc | 14 702 | 0,47 | 770 | 2,95 | ||||
| 2025-07-21 | 13F | Mirae Asset Global Investments Co., Ltd. | 0 | −100,00 | 0 | |||||
| 2025-07-31 | 13F | Topsail Wealth Management, LLC | 3 275 | 0,00 | 171 | 2,40 | ||||
| 2025-07-09 | 13F | Veracity Capital LLC | 4 076 | 0,00 | 213 | 2,40 | ||||
| 2025-08-14 | 13F | GWM Advisors LLC | 564 782 | 9,86 | 29 561 | 12,59 | ||||
| 2025-07-30 | 13F | Evermay Wealth Management Llc | 3 179 | −1,52 | 166 | 1,22 | ||||
| 2025-08-06 | 13F | Valtinson Bruner Financial Planning LLC | 236 858 | 6,55 | 12 397 | 9,21 | ||||
| 2025-08-13 | 13F | Fiduciary Group LLC | 4 885 | −18,06 | 256 | −16,12 | ||||
| 2025-08-06 | 13F | Summit Investment Advisors, Inc. | 32 486 | 0,42 | 1 693 | 6,41 | ||||
| 2025-07-31 | 13F/A | Interchange Capital Partners, LLC | 5 501 | 0,00 | 288 | 2,50 | ||||
| 2025-07-18 | 13F | Pure Financial Advisors, Inc. | 347 277 | −2,13 | 18 176 | 0,30 | ||||
| 2025-08-08 | 13F | Advyzon Investment Management, LLC | 13 538 | 709 | ||||||
| 2025-06-11 | 13F | Fortitude Financial, LLC | 9 110 | 0,00 | 465 | 0,00 | ||||
| 2025-07-28 | 13F | Tower Wealth Partners, Inc. | 47 252 | 5,89 | 2 473 | 8,56 | ||||
| 2025-07-23 | 13F | Detalus Advisors, LLC | 10 539 | 0,00 | 552 | 2,42 | ||||
| 2025-07-25 | 13F | Concord Wealth Partners | 5 264 | 0,13 | 276 | 2,61 | ||||
| 2025-07-10 | 13F | ARS Wealth Advisors Group, LLC | 0 | −100,00 | 0 | |||||
| 2025-08-14 | 13F | Money Concepts Capital Corp | 50 214 | −9,39 | 2 628 | −7,14 | ||||
| 2025-07-03 | 13F | City Center Advisors, LLC | 94 036 | 16,52 | 4 922 | 19,41 | ||||
| 2025-03-21 | 13F | Prostatis Group LLC | 0 | −100,00 | 0 | |||||
| 2025-08-01 | 13F | Rossby Financial, LCC | 8 996 | 0,75 | 471 | 8,05 | ||||
| 2025-07-11 | 13F | Farther Finance Advisors, LLC | 154 854 | 22,90 | 8 105 | 26,01 | ||||
| 2025-04-17 | 13F | Acropolis Investment Management, LLC | 0 | −100,00 | 0 | |||||
| 2025-07-25 | 13F | Community Bank, N.A. | 11 029 | 2,06 | 577 | 4,72 | ||||
| 2025-07-21 | 13F | Hudson Valley Investment Advisors Inc /adv | 6 668 | −9,32 | 349 | −6,93 | ||||
| 2025-08-14 | 13F | Aqr Capital Management Llc | 91 561 | 39,12 | 4 792 | 42,58 | ||||
| 2025-07-16 | 13F | Octavia Wealth Advisors, LLC | 2 064 818 | 3,51 | 108 073 | 6,08 | ||||
| 2025-07-25 | 13F | Pathway Financial Advisors LLC | 9 730 | 509 | ||||||
| 2025-08-13 | 13F | Bare Financial Services, Inc | 2 000 | 0,00 | 105 | 1,96 | ||||
| 2025-07-21 | 13F | Future Financial Wealth Managment LLC | 1 627 | 0,00 | 85 | 2,41 | ||||
| 2025-07-29 | 13F | Lutz Financial Services LLC | 2 206 774 | −0,05 | 115 503 | 2,43 | ||||
| 2025-05-15 | 13F | Angeles Investment Advisors, LLC | 0 | −100,00 | 0 | −100,00 | ||||
| 2025-07-09 | 13F | VisionPoint Advisory Group, LLC | 10 297 | 539 | ||||||
| 2025-08-14 | 13F | Garden State Investment Advisory Services LLC | 11 118 | −36,75 | 582 | −35,23 | ||||
| 2025-08-12 | 13F | Charles Schwab Investment Management Inc | 0 | −100,00 | 0 | |||||
| 2025-08-15 | 13F | Semmax Financial Advisors Inc. | 1 | 0,00 | 0 | |||||
| 2025-08-05 | 13F | Tme Financial, Inc. | 148 436 | 6,11 | 7 769 | 8,75 | ||||
| 2025-08-12 | 13F | Jpmorgan Chase & Co | 7 191 638 | 5,74 | 376 410 | 8,37 | ||||
| 2025-08-13 | 13F | Mount Yale Investment Advisors, LLC | 815 592 | −39,72 | 42 688 | −38,22 | ||||
| 2025-08-06 | 13F | Csenge Advisory Group | 10 423 | −49,95 | 528 | −46,67 | ||||
| 2025-05-07 | 13F | Sheaff Brock Investment Advisors, LLC | 4 094 | 209 | ||||||
| 2025-08-27 | NP | OHIO NATIONAL FUND INC - ON iShares Managed Risk Balanced Portfolio | 220 000 | 0,00 | 11 515 | 2,48 | ||||
| 2025-08-05 | 13F | Scarborough Advisors, LLC | 1 106 745 | 39,67 | 57 927 | 43,14 | ||||
| 2025-08-11 | 13F | Portside Wealth Group, LLC | 173 022 | 6,14 | 9 056 | 8,77 | ||||
| 2025-07-08 | 13F | Advance Capital Management, Inc. | 14 794 | 0,06 | 774 | 2,52 | ||||
| 2025-08-14 | 13F | Federation des caisses Desjardins du Quebec | 52 801 | 1,04 | 2 764 | 3,56 | ||||
| 2025-07-29 | 13F | Ballast, Inc. | 0 | −100,00 | 0 | |||||
| 2025-07-30 | NP | Northern Lights Fund Trust IV - Brookstone Active ETF | 159 742 | 2,25 | 8 096 | −1,94 | ||||
| 2025-07-01 | 13F | Kera Capital Partners, Inc. | 50 978 | 264,52 | 2 668 | 273,67 | ||||
| 2025-08-05 | 13F | Hills Bank & Trust Co | 475 061 | 46,17 | 24 865 | 49,81 | ||||
| 2025-08-12 | 13F | AlphaCore Capital LLC | 6 146 | 7,24 | 322 | 9,93 | ||||
| 2025-07-08 | 13F | Parallel Advisors, LLC | 640 | 63 900,00 | 33 | |||||
| 2025-07-03 | 13F | Whitcomb & Hess, Inc. | 885 530 | 1,54 | 46 349 | 4,06 | ||||
| 2025-07-28 | 13F | ForthRight Wealth Management, LLC | 14 209 | 9,52 | 744 | 12,24 | ||||
| 2025-07-21 | 13F | Monticello Wealth Management, Llc | 153 987 | −0,13 | 8 060 | 2,35 | ||||
| 2025-08-11 | 13F | Private Advisor Group, LLC | 2 925 054 | −14,26 | 153 097 | −12,13 | ||||
| 2025-07-14 | 13F | Cobblestone Asset Management LLC | 162 352 | 5,03 | 8 498 | 7,64 | ||||
| 2025-07-30 | 13F | SkyOak Wealth, LLC | 448 072 | 6,48 | 23 452 | 9,13 | ||||
| 2025-07-21 | 13F | Financial Council Asset Management Inc | 222 651 | 2,42 | 11 654 | 4,96 | ||||
| 2025-08-05 | 13F | Rockline Wealth Management, LLC | 3 935 | 206 | ||||||
| 2025-07-16 | 13F | Motive Wealth Advisors | 138 516 | 26,27 | 7 250 | 29,40 | ||||
| 2025-07-15 | 13F | Gunma Bank,Ltd. | 163 200 | −7,38 | 9 | 0,00 | ||||
| 2025-07-28 | 13F | Frazier Financial Advisors, LLC | 14 383 | 3,23 | 753 | 5,77 | ||||
| 2025-08-08 | 13F | Gts Securities Llc | 0 | −100,00 | 0 | |||||
| 2025-08-04 | 13F/A | 626 Financial, LLC | 12 026 | 0,00 | 629 | 2,44 | ||||
| 2025-08-13 | 13F | Summit Financial, LLC | 326 462 | 36,57 | 17 087 | 39,97 | ||||
| 2025-07-25 | 13F | Tranquility Partners, LLC | 5 674 | 9,79 | 297 | 12,55 | ||||
| 2025-08-08 | 13F | Smithfield Trust Co | 10 600 | 0,00 | 1 | |||||
| 2025-08-18 | 13F | Tyler-Stone Wealth Management | 75 299 | −1,58 | 3 941 | 0,87 | ||||
| 2025-08-08 | 13F | Pinney & Scofield, Inc. | 1 514 | 0,00 | 79 | 2,60 | ||||
| 2025-07-16 | 13F | Colton Groome Financial Advisors, Llc | 46 850 | −8,83 | 2 452 | −3,04 | ||||
| 2025-07-24 | 13F | Brandywine Oak Private Wealth Llc | 519 837 | −4,90 | 27 208 | −2,53 | ||||
| 2025-08-11 | 13F | Cornerstone Planning Group LLC | 1 346 | −0,30 | 71 | 9,38 | ||||
| 2025-07-22 | 13F | Old National Bancorp /in/ | 1 613 259 | −4,38 | 84 438 | −2,01 | ||||
| 2025-05-15 | 13F | Nova Wealth Management, Inc. | 97 | 0,00 | 5 | 0,00 | ||||
| 2025-08-11 | 13F | Foundation Wealth Management, LLC\PA | 42 850 | −2,08 | 2 243 | 0,36 | ||||
| 2025-08-13 | 13F | VestGen Advisors, LLC | 170 691 | −10,15 | 8 934 | −7,92 | ||||
| 2025-08-14 | 13F | Headlands Technologies LLC | 0 | −100,00 | 0 | −100,00 | ||||
| 2025-07-25 | 13F | Index Fund Advisors, Inc. | 27 616 | 0,94 | 1 445 | 3,44 | ||||
| 2025-08-06 | 13F | Bensler, LLC | 133 986 | 6,03 | 7 013 | 8,66 | ||||
| 2025-07-14 | 13F | Opal Wealth Advisors, LLC | 51 319 | 7,05 | 2 686 | 9,72 | ||||
| 2025-08-08 | 13F | Emerald Investment Partners, Llc | 32 714 | −8,44 | 1 712 | −6,14 | ||||
| 2025-07-14 | 13F | Brady Martz Wealth Solutions, LLC | 59 176 | −3,32 | 3 097 | −0,90 | ||||
| 2025-07-08 | 13F | FF Advisors,LLC | 43 420 | 0,00 | 2 273 | 5,82 | ||||
| 2025-07-11 | 13F | Essex Savings Bank | 5 847 | −1,12 | 306 | 1,66 | ||||
| 2025-08-05 | 13F | Snider Financial Group | 126 662 | 4,67 | 6 629 | 7,27 | ||||
| 2025-08-13 | 13F | Serenus Wealth Advisors, LLC | 12 959 | 0,15 | 678 | 2,73 | ||||
| 2025-08-18 | 13F | Goodman Advisory Group, LLC | 0 | −100,00 | 0 | |||||
| 2025-07-30 | 13F | Principle Wealth Partners Llc | 4 534 | 0,00 | 237 | 2,60 | ||||
| 2025-08-06 | 13F | Valued Wealth Advisors LLC | 174 | 0,00 | 9 | 12,50 | ||||
| 2025-08-14 | 13F | Diversify Advisory Services, LLC | 385 994 | 29,24 | 20 736 | 41,14 | ||||
| 2025-07-21 | 13F | Fortis Capital Advisors, LLC | 95 318 | 72,99 | 4 989 | 77,32 | ||||
| 2025-04-30 | 13F | Peterson Wealth Advisors, LLC | 0 | −100,00 | 0 | |||||
| 2025-08-14 | 13F | Vista Investment Management | 0 | −100,00 | 0 | |||||
| 2025-07-29 | 13F | Fundamentun, Llc | 44 772 | −13,98 | 2 343 | −11,85 | ||||
| 2025-07-18 | 13F | Founders Capital Management | 4 | 0,00 | 0 | |||||
| 2025-08-12 | 13F | Bokf, Na | 3 792 | 39,93 | 198 | 43,48 | ||||
| 2025-07-02 | 13F | Waller Financial Planning Group, Inc | 166 373 | 24,98 | 8 708 | 28,08 | ||||
| 2025-07-15 | 13F | Legacy Financial Group LLC | 243 837 | 16,80 | 12 762 | 19,71 | ||||
| 2025-08-13 | 13F | Renaissance Technologies Llc | 65 600 | 3 434 | ||||||
| 2025-07-21 | 13F | Cardinal Strategic Wealth Guidance | 158 229 | 11,09 | 8 282 | 13,86 | ||||
| 2025-08-08 | 13F | KM Capital Management Ltd. | 11 215 | 69,80 | 587 | 73,89 | ||||
| 2025-08-18 | 13F | N.E.W. Advisory Services LLC | 1 372 477 | −27,77 | 71 835 | −25,97 | ||||
| 2025-07-16 | 13F | Vestia Personal Wealth Advisors | 11 266 | −0,56 | 590 | 1,90 | ||||
| 2025-08-11 | 13F | HighTower Advisors, LLC | 2 392 796 | −2,92 | 125 239 | −0,50 | ||||
| 2025-08-13 | 13F | Sanibel Captiva Trust Company, Inc. | 6 046 | −4,65 | 316 | −2,17 | ||||
| 2025-07-14 | 13F | Park Avenue Securities Llc | 106 305 | 7,61 | 6 | 0,00 | ||||
| 2025-07-22 | 13F | Private Wealth Group, LLC | 178 218 | 9,60 | 9 328 | 12,32 | ||||
| 2025-07-31 | 13F | Sharper & Granite LLC | 6 306 | 10,96 | 334 | 14,83 | ||||
| 2025-07-10 | 13F | Tompkins Financial Corp | 526 | 4 681,82 | 28 | |||||
| 2025-08-11 | 13F | Tidemark, LLC | 5 882 | 11,46 | 308 | 14,13 | ||||
| 2025-07-10 | 13F | Uptown Financial Advisors LLC | 142 144 | 9,80 | 7 440 | 12,52 | ||||
| 2025-07-15 | 13F | Eaton Financial Holdings Company, LLC | 253 953 | −8,74 | 13 292 | −6,47 | ||||
| 2025-07-22 | 13F | Kraematon Investment Advisors, Inc | 8 588 | 0,22 | 449 | 2,75 | ||||
| 2025-08-11 | 13F | TD Waterhouse Canada Inc. | 43 | −50,00 | 2 | −50,00 | ||||
| 2025-08-15 | 13F | Equitable Holdings, Inc. | 4 879 270 | 9,97 | 255 381 | 12,70 | ||||
| 2025-08-12 | 13F | Proequities, Inc. | 0 | 0 | ||||||
| 2025-08-13 | 13F | Jones Financial Companies Lllp | 612 942 | 104,49 | 31 941 | 110,46 | ||||
| 2025-07-17 | 13F | Stone Point Wealth LLC | 174 359 | −9,28 | 9 126 | −7,03 | ||||
| 2025-07-31 | 13F/A | Avion Wealth | 210 | 0,96 | 0 | |||||
| 2025-08-08 | 13F | Jacksonville Wealth Management, LLC | 30 824 | 1 613 | ||||||
| 2025-08-11 | 13F | Pin Oak Investment Advisors Inc | 3 026 | 0,00 | 0 | |||||
| 2025-07-28 | 13F | Axxcess Wealth Management, Llc | 192 560 | 3,71 | 10 079 | 6,29 | ||||
| 2025-07-30 | 13F | LGT Financial Advisors LLC | 13 865 | 52,20 | 726 | 55,91 | ||||
| 2025-07-31 | 13F | Ballast Advisors Llc | 1 062 | −7,33 | 56 | −5,17 | ||||
| 2025-08-12 | 13F | Power Wealth Management Llc | 237 237 | 5,57 | 12 417 | 8,19 | ||||
| 2025-07-17 | 13F | Hengehold Capital Management Llc | 6 192 | −1,01 | 324 | 1,57 | ||||
| 2025-08-13 | 13F | Invesco Ltd. | 28 844 | −5,96 | 1 510 | −3,64 | ||||
| 2025-07-25 | 13F | We Are One Seven, LLC | 456 732 | 26,84 | 23 905 | 30,00 | ||||
| 2025-08-04 | 13F | Hantz Financial Services, Inc. | 60 | −58,04 | 0 | |||||
| 2025-07-17 | 13F | City Holding Co | 305 | 0,00 | 16 | 0,00 | ||||
| 2025-08-11 | 13F | Perennial Investment Advisors, LLC | 819 774 | 8,60 | 42 907 | 11,30 | ||||
| 2025-08-14 | 13F | Hurley Capital, LLC | 16 190 | 0,00 | 847 | 2,54 | ||||
| 2025-08-07 | 13F | Arbor Trust Wealth Advisors, Llc | 107 243 | −12,31 | 5 613 | −10,12 | ||||
| 2025-08-08 | 13F | Altfest L J & Co Inc | 10 313 | −6,57 | 540 | −4,26 | ||||
| 2025-08-11 | 13F | Hopwood Financial Services, Inc. | 4 021 | 0,00 | 210 | 2,44 | ||||
| 2025-08-07 | 13F | PFG Advisors | 74 611 | 113,52 | 3 905 | 118,89 | ||||
| 2025-08-14 | 13F | Diversify Wealth Management, Llc | 910 472 | 12,22 | 48 911 | 22,55 | ||||
| 2025-08-14 | 13F | Bnp Paribas Arbitrage, Sa | 32 000 | −86,26 | 1 675 | −85,92 | ||||
| 2025-04-23 | 13F | Sunesis Advisors, LLC | 43 133 | 0,00 | 2 203 | −0,14 | ||||
| 2025-07-08 | 13F | Apella Capital, LLC | 8 674 | 86,22 | 458 | 103,56 | ||||
| 2025-07-14 | 13F | Pacifica Partners Inc. | 290 | 15 | ||||||
| 2025-07-30 | 13F | Strategic Blueprint, LLC | 9 409 | −7,15 | 492 | −4,84 | ||||
| 2025-08-26 | NP | Northern Lights Variable Trust - TOPS Managed Risk Balanced ETF Portfolio Class 2 shares | 69 451 | −2,14 | 3 635 | 0,30 | ||||
| 2025-08-07 | 13F | CENTRAL TRUST Co | 181 | −88,57 | 9 | −88,75 | ||||
| 2025-08-11 | 13F | Sharpepoint Llc | 97 271 | −0,20 | 5 091 | 6,20 | ||||
| 2025-07-15 | 13F | Graypoint LLC | 42 208 | 0,01 | 2 209 | 2,51 | ||||
| 2025-07-17 | 13F | Grandview Asset Management LLC | 6 840 | 0,31 | 0 | |||||
| 2025-07-18 | 13F | Lynx Investment Advisory | 7 923 | 0,49 | 415 | 2,99 | ||||
| 2025-07-09 | 13F | First Financial Corp /in/ | 1 157 | 0,00 | 61 | 1,69 | ||||
| 2025-07-29 | 13F | Goldstein Advisors, LLC | 4 434 | −2,93 | 232 | −0,43 | ||||
| 2025-08-12 | 13F | Horizon Financial Services, Llc | 325 567 | 2,72 | 17 040 | 5,28 | ||||
| 2025-08-14 | 13F | Byrne Financial Freedom, Llc | 5 100 | 0,00 | 267 | 2,31 | ||||
| 2025-08-06 | 13F | Twin Capital Management Inc | 0 | −100,00 | 0 | |||||
| 2025-08-04 | 13F | L.m. Kohn & Company | 7 365 | −44,47 | 385 | −43,13 | ||||
| 2025-08-12 | 13F | Calton & Associates, Inc. | 21 651 | −34,03 | 1 133 | −32,40 | ||||
| 2025-08-13 | 13F | Beacon Pointe Advisors, LLC | 5 330 | −0,71 | 279 | 1,46 | ||||
| 2025-08-07 | 13F | Sanchez Wealth Management Group | 22 894 | −27,83 | 1 198 | −26,05 | ||||
| 2025-08-08 | 13F/A | Ignite Planners, LLC | 133 758 | 3,75 | 7 072 | 11,16 | ||||
| 2025-04-10 | 13F | Bremer Bank National Association | 8 456 | 1,29 | 432 | 1,17 | ||||
| 2025-07-18 | 13F | CHURCHILL MANAGEMENT Corp | 0 | −100,00 | 0 | |||||
| 2025-07-18 | 13F | RKL Wealth Management LLC | 16 119 | 0,49 | 844 | 2,93 | ||||
| 2025-08-26 | NP | EQ ADVISORS TRUST - EQ/Large Cap Value Managed Volatility Portfolio Class IB | 1 302 900 | 33,13 | 68 194 | 36,44 | ||||
| 2025-08-07 | 13F | Resources Investment Advisors, LLC. | 20 954 | −11,75 | 1 097 | −9,57 | ||||
| 2025-06-26 | NP | HF - DGA Absolute Return ETF | 54 477 | −7,64 | 2 682 | −13,57 | ||||
| 2025-08-04 | 13F | Assetmark, Inc | 182 374 | 18,52 | 9 545 | 21,47 | ||||
| 2025-07-30 | 13F | Onyx Bridge Wealth Group LLC | 29 136 | −19,28 | 1 525 | −17,31 | ||||
| 2025-07-30 | 13F | Drive Wealth Management, Llc | 15 871 | −2,41 | 831 | 0,00 | ||||
| 2025-07-10 | 13F | Signal Advisors Wealth, LLC | 281 530 | −41,17 | 14 735 | −39,70 | ||||
| 2025-08-01 | 13F | Facet Wealth, Inc. | 995 809 | −18,90 | 52 609 | −13,48 | ||||
| 2025-08-05 | 13F | Marion Wealth Management | 4 794 | −84,62 | 251 | −84,29 | ||||
| 2025-08-26 | NP | Northern Lights Variable Trust - TOPS Moderate Growth ETF Portfolio Class 1 shares | 117 989 | 5,80 | 6 176 | 8,43 | ||||
| 2025-08-11 | 13F | Advisor Resource Council | 0 | −100,00 | 0 | |||||
| 2025-08-12 | 13F | O'shaughnessy Asset Management, Llc | 101 219 | 21,52 | 5 298 | 24,55 | ||||
| 2025-07-10 | 13F | Wealth Enhancement Advisory Services, Llc | 4 456 511 | 26,08 | 237 131 | 31,37 | ||||
| 2025-08-12 | 13F | Cornerstone Wealth Management, LLC | 63 943 | −1,53 | 3 347 | 0,90 | ||||
| 2025-08-13 | 13F | Cerity Partners LLC | 3 455 643 | 0,50 | 180 868 | 3,00 | ||||
| 2025-07-14 | 13F | AdvisorNet Financial, Inc | 48 053 | 3,25 | 2 515 | 5,85 | ||||
| 2025-07-31 | 13F | BIP Wealth, LLC | 514 242 | −2,02 | 26 915 | 0,41 | ||||
| 2025-07-23 | 13F | Sax Wealth Advisors, Llc | 5 885 | −0,83 | 308 | 1,65 | ||||
| 2025-07-30 | 13F | Phillips Financial Management, Llc | 974 | 0,00 | 51 | 2,04 | ||||
| 2025-07-22 | 13F | Foguth Wealth Management, LLC. | 269 309 | −43,49 | 14 096 | −42,08 | ||||
| 2025-08-13 | 13F | Northern Trust Corp | 556 641 | −0,01 | 29 135 | 2,48 | ||||
| 2025-08-14 | 13F | Raymond James Financial Inc | 5 821 052 | 1,40 | 304 674 | 3,92 | ||||
| 2025-08-14 | 13F | Wilkins Miller Wealth Management, LLC | 5 812 | 0,35 | 304 | 3,05 | ||||
| 2025-08-08 | 13F | Flaharty Asset Management, LLC | 242 | −60,78 | 13 | −61,29 | ||||
| 2025-07-09 | 13F | Key Client Fiduciary Advisors, LLC | 6 432 | 3,44 | 337 | 5,99 | ||||
| 2025-08-15 | 13F | Morgan Stanley | 9 796 229 | −0,13 | 512 735 | 2,35 | ||||
| 2025-07-09 | 13F | Heritage Wealth Architects, Inc. | 23 748 | 1 243 | ||||||
| 2025-08-13 | 13F | Twin Peaks Wealth Advisors, LLC | 6 885 | 370 | ||||||
| 2025-08-14 | 13F | MGB Wealth Management, LLC | 13 355 | 0,77 | 698 | 3,41 | ||||
| 2025-08-04 | 13F | Great Lakes Retirement, Inc. | 285 131 | 1,55 | 14 924 | 4,07 | ||||
| 2025-07-18 | 13F | PFG Investments, LLC | 14 791 | 1,17 | 774 | 3,75 | ||||
| 2025-08-07 | 13F | Rossmore Private Capital | 7 999 | −0,55 | 419 | 1,95 | ||||
| 2025-08-13 | 13F | Elios Financial Group Inc. | 32 093 | 9,39 | 1 680 | 12,08 | ||||
| 2025-07-15 | 13F | SJS Investment Consulting Inc. | 0 | −100,00 | 0 | |||||
| 2025-07-31 | 13F | Oppenheimer & Co Inc | 6 665 | −14,68 | 349 | −12,56 | ||||
| 2025-07-22 | 13F | Coastal Investment Advisors, Inc. | 12 279 | 86,33 | 643 | 91,07 | ||||
| 2025-05-02 | 13F | Capital A Wealth Management, LLC | 36 | −34,55 | 2 | −50,00 | ||||
| 2025-08-05 | 13F | Integrity Wealth Solutions LLC | 27 039 | 7,10 | 1 415 | 9,78 | ||||
| 2025-08-13 | 13F | Maia Wealth LLC | 0 | −100,00 | 0 | |||||
| 2025-07-18 | 13F | Trust Co Of Vermont | 1 912 | 0,00 | 100 | 3,09 | ||||
| 2025-08-14 | 13F | Clark Capital Management Group, Inc. | 8 577 | −81,11 | 449 | −80,67 | ||||
| 2025-07-21 | 13F | Patriot Financial Group Insurance Agency, LLC | 11 652 | −2,62 | 610 | −0,33 | ||||
| 2025-07-22 | 13F | Grimes & Company, Inc. | 12 320 | 0,46 | 645 | 2,88 | ||||
| 2025-07-28 | 13F | Copia Wealth Management | 73 785 | −0,12 | 3 862 | 2,36 | ||||
| 2025-08-06 | 13F | ETF Store, Inc. | 5 265 | 0,15 | 276 | 2,61 | ||||
| 2025-08-12 | 13F | Asset Management Group, Inc. | 95 455 | 1,29 | 4 996 | 3,82 | ||||
| 2025-08-12 | 13F | Change Path, LLC | 25 047 | 53,20 | 1 311 | 57,07 | ||||
| 2025-07-31 | 13F | Cambridge Investment Research Advisors, Inc. | 956 585 | 3,75 | 50 | 6,38 | ||||
| 2025-08-14 | 13F | Toroso Investments, LLC | 43 000 | −17,17 | 2 251 | −15,13 | ||||
| 2025-08-25 | 13F/A | Promus Capital, LLC | 191 665 | 22,36 | 10 032 | 25,40 | ||||
| 2025-07-21 | 13F | Quent Capital, LLC | 157 945 | −3,38 | 8 267 | −0,98 | ||||
| 2025-08-08 | 13F | Creative Planning | 656 509 | −4,28 | 34 362 | −1,90 | ||||
| 2025-08-14 | 13F | Pennington Partners & Co., Llc | 6 372 | 334 | ||||||
| 2025-08-08 | 13F | Cetera Investment Advisers | 3 709 949 | 14,33 | 194 179 | 17,17 | ||||
| 2025-07-22 | 13F | Diligent Investors, LLC | 286 385 | 0,15 | 14 989 | 2,64 | ||||
| 2025-08-13 | 13F | Capital Analysts, Inc. | 58 783 | 90,80 | 3 | 200,00 | ||||
| 2025-08-14 | 13F | Mpwm Advisory Solutions, Llc | 38 168 | −2,52 | 1 998 | −0,10 | ||||
| 2025-08-14 | 13F | Old Mission Capital Llc | 39 003 | −18,52 | 2 041 | −16,49 | ||||
| 2025-07-22 | 13F | Iron Horse Wealth Management, LLC | 27 903 | −1,24 | 1 460 | 1,25 | ||||
| 2025-07-09 | 13F | Seaside Wealth Management, Inc. | 38 594 | −8,48 | 2 020 | −6,18 | ||||
| 2025-07-17 | 13F | Tempus Wealth Planning, LLC | 14 074 | −6,89 | 737 | −4,54 | ||||
| 2025-04-15 | 13F | Collier Financial | 166 349 | 8 495 | ||||||
| 2025-07-07 | 13F | RDA Financial Network | 32 653 | −5,34 | 1 709 | −2,95 | ||||
| 2025-08-06 | 13F | Prospera Financial Services Inc | 61 393 | −0,75 | 3 213 | 1,74 | ||||
| 2025-08-06 | 13F | Longview Financial Advisors LLC | 50 | 0,00 | 3 | 0,00 | ||||
| 2025-07-25 | 13F | Dynamic Financial Group | 8 065 | −1,73 | 422 | 0,72 | ||||
| 2025-08-04 | 13F | Arkadios Wealth Advisors | 36 023 | 0,40 | 1 885 | 2,89 | ||||
| 2025-08-13 | 13F | Marshall Wace, Llp | 57 469 | 3 008 | ||||||
| 2025-07-25 | 13F | Cerro Pacific Wealth Advisors LLC | 10 104 | 529 | ||||||
| 2025-08-14 | 13F | Snowden Capital Advisors LLC | 11 276 | −1,05 | 590 | 1,55 | ||||
| 2025-08-15 | 13F | Asset Allocation Strategies LLC | 113 946 | −32,13 | 5 964 | −30,45 | ||||
| 2025-07-31 | 13F | Auour Investments LLC | 161 314 | 3,09 | 8 443 | 9,61 | ||||
| 2025-08-05 | 13F | GPS Wealth Strategies Group, LLC | 117 355 | 3,56 | 6 142 | 6,13 | ||||
| 2025-04-29 | 13F | Pensionmark Financial Group, Llc | 0 | −100,00 | 0 | |||||
| 2025-04-28 | 13F | Redmont Wealth Advisors Llc | 135 | 7 | ||||||
| 2025-07-17 | 13F | Catalytic Wealth RIA, LLC | 6 753 | 0,00 | 353 | 2,62 | ||||
| 2025-08-14 | 13F | Benjamin Edwards Inc | 1 596 810 | 24,12 | 83 577 | 27,21 | ||||
| 2025-07-11 | 13F | Bell Bank | 1 516 195 | 5,15 | 79 358 | 7,76 | ||||
| 2025-08-04 | 13F | 4wealth Advisors, Inc. | 12 693 | 0,74 | 664 | 3,27 | ||||
| 2025-07-16 | 13F | Cambridge Advisors Inc. | 5 130 | 0,00 | 269 | 2,68 | ||||
| 2025-07-11 | 13F | Lantz Financial LLC | 14 657 | 7,31 | 767 | 10,04 | ||||
| 2025-07-01 | 13F | Confluence Investment Management Llc | 685 828 | 22,14 | 35 896 | 25,17 | ||||
| 2025-08-26 | NP | Northern Lights Variable Trust - TOPS Managed Risk Growth ETF Portfolio Class 1 shares | 137 050 | −2,23 | 7 173 | 0,21 | ||||
| 2025-08-07 | 13F | Allworth Financial LP | 16 630 130 | 2,61 | 870 421 | 10,05 | ||||
| 2025-05-15 | 13F | Hunting Hill Global Capital, LLC | Call | 0 | −100,00 | 0 | −100,00 | |||
| 2025-08-04 | 13F | Fortune 45 LLC | 13 299 | 0,33 | 696 | 2,81 | ||||
| 2025-08-01 | 13F | Brookwood Investment Group LLC | 3 985 | 209 | ||||||
| 2025-07-18 | 13F | Forza Wealth Management, LLC | 4 165 | 0,00 | 218 | 2,36 | ||||
| 2025-08-14 | 13F | Comerica Bank | 70 624 | 5,60 | 3 696 | 8,23 | ||||
| 2025-07-30 | 13F | Cullen/frost Bankers, Inc. | 21 263 | 0,53 | 1 113 | 2,96 | ||||
| 2025-05-15 | 13F/A | Orion Portfolio Solutions, LLC | 162 094 | −45,42 | 8 278 | −45,50 | ||||
| 2025-07-30 | 13F | Exencial Wealth Advisors, Llc | 7 930 | −3,10 | 415 | −0,48 | ||||
| 2025-07-18 | 13F | Truist Financial Corp | 390 837 | 1,93 | 20 456 | 4,46 | ||||
| 2025-07-17 | 13F | Greenleaf Trust | 19 105 | −4,50 | 1 000 | −2,15 | ||||
| 2025-07-21 | 13F | Pacific Financial Group Inc | 87 693 | 0,24 | 4 590 | 2,73 | ||||
| 2025-08-26 | NP | Northern Lights Variable Trust - TOPS Growth ETF Portfolio Class 2 shares | 247 197 | 10,99 | 12 938 | 13,75 | ||||
| 2025-08-08 | 13F | Glassman Wealth Services | 3 833 | 0,00 | 201 | 2,56 | ||||
| 2025-08-05 | 13F | Claro Advisors LLC | 6 924 | 9,92 | 362 | 12,77 | ||||
| 2025-07-07 | 13F | Somerset Trust Co | 7 727 | −11,27 | 404 | −9,01 | ||||
| 2025-07-14 | 13F | Occidental Asset Management, LLC | 106 574 | 2,74 | 5 578 | 5,30 | ||||
| 2025-08-01 | 13F | Milestone Asset Management Group, LLC | 68 995 | 2,87 | 3 611 | 5,43 | ||||
| 2025-07-24 | 13F | Wealth Management Resources, Inc. | 29 561 | 2,89 | 1 547 | 5,45 | ||||
| 2025-05-15 | 13F | CAPROCK Group, Inc. | 9 993 | 75,75 | 510 | 75,86 | ||||
| 2025-08-14 | 13F | TCG Advisory Services, LLC | 10 913 | 0,95 | 571 | 3,44 | ||||
| 2025-07-14 | 13F | Harbor Group, Inc. | 472 831 | 3,26 | 24 748 | 5,83 | ||||
| 2025-08-08 | 13F | Foundations Investment Advisors, LLC | 92 899 | 8,95 | 4 862 | 11,67 | ||||
| 2025-08-08 | 13F | Financial Gravity Companies, Inc. | 170 978 | 14,95 | 8 949 | 17,64 | ||||
| 2025-08-15 | 13F | First Heartland Consultants, Inc. | 350 380 | 4,54 | 18 339 | 7,13 | ||||
| 2025-08-27 | 13F/A | Brinker Capital Investments, LLC | 93 910 | −42,06 | 4 915 | −40,63 | ||||
| 2025-07-25 | 13F | Stack Financial Management, Inc | 0 | −100,00 | 0 | |||||
| 2025-08-11 | 13F | Western Wealth Management, LLC | 422 552 | −21,17 | 22 116 | −19,21 | ||||
| 2025-08-13 | 13F | MBM Wealth Consultants, LLC | 57 596 | 2,17 | 3 015 | 4,73 | ||||
| 2025-07-17 | 13F | Hanson & Doremus Investment Management | 353 | 0,00 | 0 | |||||
| 2025-07-23 | 13F | Ohio National Investments, Inc. | 712 000 | 0,00 | 37 266 | 2,49 | ||||
| 2025-08-14 | 13F | Harwood Advisory Group, LLC | 2 877 | 0,00 | 151 | 2,04 | ||||
| 2025-08-14 | 13F | Murphy & Mullick Capital Management Corp | 2 303 | 0,00 | 122 | 3,42 | ||||
| 2025-07-16 | 13F | MBE Wealth Management, LLC | 423 743 | 3,02 | 22 179 | 5,58 | ||||
| 2025-07-30 | 13F | Probity Advisors, Inc. | 238 341 | 5,33 | 12 475 | 7,94 | ||||
| 2025-08-04 | 13F | Flagship Harbor Advisors, Llc | 1 145 512 | −22,31 | 59 956 | −20,38 | ||||
| 2025-08-14 | 13F | Cubist Systematic Strategies, LLC | 16 435 | 860 | ||||||
| 2025-07-24 | 13F | Stiles Financial Services Inc | 4 533 | −5,80 | 237 | −3,27 | ||||
| 2025-07-29 | 13F | Quotient Wealth Partners, LLC | 4 384 101 | 3,90 | 229 464 | 6,49 | ||||
| 2025-08-04 | 13F | Bristlecone Advisors, LLC | 36 894 | −5,84 | 1 931 | −3,50 | ||||
| 2025-08-06 | 13F | Texas Yale Capital Corp. | 0 | −100,00 | 0 | |||||
| 2025-08-12 | 13F | Coston, McIsaac & Partners | 1 628 | −15,08 | 0 | |||||
| 2025-07-23 | 13F | Nbt Bank N A /ny | 1 063 | −9,07 | 56 | −6,78 | ||||
| 2025-07-22 | 13F | Simplicity Wealth,LLC | 57 476 | 21,90 | 3 008 | 24,92 | ||||
| 2025-08-13 | 13F | Alerus Financial Na | 13 | 1 | ||||||
| 2025-08-14 | 13F | Certified Advisory Corp | 45 422 | −22,34 | 2 377 | −20,42 | ||||
| 2025-07-16 | 13F | FCG Investment Co | 39 584 | 5,85 | 2 072 | 8,49 | ||||
| 2025-08-14 | 13F/A | Barclays Plc | 580 | 0,00 | 0 | |||||
| 2025-08-06 | 13F | Paladin Advisory Group, LLC | 61 | −75,98 | 3 | −75,00 | ||||
| 2025-08-08 | 13F | Fortis Group Advisors, LLC | 11 404 | 8,49 | 602 | 12,31 | ||||
| 2025-05-05 | 13F | Lindbrook Capital, Llc | 695 | 0,00 | 35 | 0,00 | ||||
| 2025-07-10 | 13F | Atticus Wealth Management, Llc | 272 487 | 0,92 | 14 262 | 3,42 | ||||
| 2025-08-15 | 13F | Urban Financial Advisory Corp | 2 259 | 0,49 | 118 | 3,51 | ||||
| 2025-07-09 | 13F | Reyes Financial Architecture, Inc. | 5 747 | 0,00 | 301 | 2,39 | ||||
| 2025-08-01 | 13F | Oarsman Capital, Inc. | 8 528 | −0,80 | 446 | 1,59 | ||||
| 2025-08-06 | 13F | Founders Financial Securities Llc | 985 939 | 9,93 | 51 604 | 17,57 | ||||
| 2025-08-12 | 13F | Prudential Financial Inc | 683 426 | 0,00 | 35 771 | 2,49 | ||||
| 2025-07-10 | 13F | Baker Tilly Financial, Llc | 13 716 | −20,92 | 718 | −18,98 | ||||
| 2025-04-22 | 13F | Putney Financial Group LLC | 0 | −100,00 | 0 | |||||
| 2025-08-04 | 13F | Bridgewealth Advisory Group, LLC | 28 386 | −10,00 | 1 486 | −7,76 | ||||
| 2025-07-23 | 13F | Trueblood Wealth Management, LLC | 8 658 | −0,67 | 453 | 1,80 | ||||
| 2025-08-13 | 13F | Manning & Napier Advisors Llc | 40 209 | 2 105 | ||||||
| 2025-08-13 | 13F | Johnson Financial Group, Inc. | 5 365 | 82,55 | 281 | 86,67 | ||||
| 2025-08-12 | 13F | Wood Tarver Financial Group, LLC | 694 | 0,00 | 0 | −100,00 | ||||
| 2025-08-29 | 13F | Evolution Wealth Management Inc. | 2 726 | 143 | ||||||
| 2025-07-17 | 13F | Bluesphere Advisors, LLC | 8 461 | 0,00 | 443 | 2,31 | ||||
| 2025-08-08 | 13F/A | Prospect Financial Services LLC | 9 274 | −23,31 | 485 | −21,39 | ||||
| 2025-07-09 | 13F | Breakwater Capital Group | 55 154 | 1,57 | 2 887 | 4,08 | ||||
| 2025-08-04 | 13F | Savvy Advisors, Inc. | 19 132 | 4,75 | 1 001 | 7,40 | ||||
| 2025-07-16 | 13F | Stephenson National Bank & Trust | 885 | 0,00 | 46 | 2,22 | ||||
| 2025-08-13 | 13F | Baird Financial Group, Inc. | 332 418 | −7,13 | 17 399 | −4,82 | ||||
| 2025-05-14 | 13F | Caitlin John, LLC | 0 | −100,00 | 0 | |||||
| 2025-08-12 | 13F | Cowa, Llc | 11 200 | 0,00 | 586 | 2,63 | ||||
| 2025-05-12 | 13F | Simplex Trading, Llc | 0 | −100,00 | 0 | |||||
| 2025-08-07 | 13F | Winch Advisory Services, LLC | 4 044 | 0,40 | 212 | 2,93 | ||||
| 2025-08-04 | 13F | ArborFi Advisors, LLC | 46 188 | 7,52 | 2 417 | 10,21 | ||||
| 2025-08-12 | 13F | Franklin Resources Inc | 689 238 | −82,50 | 36 075 | −82,06 | ||||
| 2025-07-30 | 13F | Capstone Triton Financial Group, LLC | 18 590 | −46,27 | 973 | −45,00 | ||||
| 2025-08-08 | 13F | Evolution Wealth Advisors, LLC | 5 900 | 309 | ||||||
| 2025-05-01 | 13F | Schechter Investment Advisors, LLC | 42 990 | 266,93 | 2 195 | 266,44 | ||||
| 2025-08-05 | 13F | MidAtlantic Capital Management, Inc. | 80 100 | 0,00 | 4 192 | 2,49 | ||||
| 2025-08-13 | 13F | Measured Wealth Private Client Group, LLC | 528 420 | −0,10 | 27 658 | 2,39 | ||||
| 2025-07-02 | 13F | Michael S. Ryan, Inc. | 464 006 | 7,17 | 24 286 | 9,84 | ||||
| 2025-08-08 | 13F | Wrapmanager Inc | 202 031 | −3,43 | 10 574 | −1,03 | ||||
| 2025-07-17 | 13F | Park Place Capital Corp | 597 | 0,00 | 32 | 3,33 | ||||
| 2025-08-14 | 13F | Great Valley Advisor Group, Inc. | 545 177 | 5,89 | 28 534 | 8,52 | ||||
| 2025-08-13 | 13F | Colonial Trust Co / SC | 2 800 | 0,00 | 146 | 2,84 | ||||
| 2025-07-22 | 13F | Alta Wealth Advisors LLC | 494 328 | 5,67 | 25 873 | 8,30 | ||||
| 2025-07-14 | 13F | Wealth Advisory Solutions, LLC | 7 131 | 2,57 | 373 | 5,07 | ||||
| 2025-07-17 | 13F | Delta Capital Management Llc | 4 000 | 0,00 | 0 | |||||
| 2025-07-25 | 13F | Cwm, Llc | 4 188 320 | 2,51 | 219 | 5,29 | ||||
| 2025-05-15 | 13F | Two Sigma Securities, Llc | 0 | −100,00 | 0 | |||||
| 2025-04-15 | 13F | Transform Wealth, LLC | 85 606 | 3,07 | 4 372 | 2,92 | ||||
| 2025-07-31 | 13F | Hartford Financial Management Inc. | 420 | 0,00 | 22 | 0,00 | ||||
| 2025-04-22 | 13F | Breakthru Advisory Services, Llc | 0 | −100,00 | 0 | |||||
| 2025-08-12 | 13F | Erickson Financial Group, LLC | 5 182 | 0,00 | 271 | 2,65 | ||||
| 2025-04-15 | 13F | Members Wealth Llc | 74 339 | 4,71 | 3 797 | 2,07 | ||||
| 2025-07-31 | 13F | Glass Jacobson Investment Advisors llc | 13 441 | −2,12 | 703 | 0,14 | ||||
| 2025-08-27 | NP | OHIO NATIONAL FUND INC - ON iShares Managed Risk Growth Portfolio | 235 000 | 0,00 | 12 300 | 2,48 | ||||
| 2025-08-05 | 13F | Summit Investment Advisory Services, LLC | 32 486 | 1,54 | 1 700 | 4,10 | ||||
| 2025-08-07 | 13F | Verus Capital Partners, Llc | 266 962 | 7,11 | 13 973 | 9,77 | ||||
| 2025-08-14 | 13F | Moneta Group Investment Advisors Llc | 22 216 | 21,53 | 1 163 | 24,54 | ||||
| 2025-05-06 | 13F | Venturi Wealth Management, LLC | 0 | −100,00 | 0 | |||||
| 2025-07-16 | 13F | American National Bank | 260 | 0,00 | 14 | 0,00 | ||||
| 2025-08-08 | 13F | Good Life Advisors, LLC | 1 284 416 | −3,25 | 67 226 | −0,84 | ||||
| 2025-07-17 | 13F | KWB Wealth | 1 469 549 | −3,31 | 75 050 | −3,44 | ||||
| 2025-08-04 | 13F | Family Wealth Group, LLC | 7 419 | 388 | ||||||
| 2025-08-14 | 13F | Mariner, LLC | 1 933 939 | 6,14 | 101 222 | 8,78 | ||||
| 2025-04-14 | 13F | IMC-Chicago, LLC | 0 | −100,00 | 0 | |||||
| 2025-04-28 | 13F | Mainstream Capital Management LLC | 0 | −100,00 | 0 | |||||
| 2025-07-29 | 13F | Woodard & Co Asset Management Group Inc /adv | 697 973 | 0,61 | 36 532 | 3,11 | ||||
| 2025-07-10 | 13F | Oliver Lagore Vanvalin Investment Group | 1 076 | 0,00 | 55 | −1,82 | ||||
| 2025-07-15 | 13F | Retirement Income Solutions, Inc | 44 295 | −10,50 | 2 318 | −8,27 | ||||
| 2025-08-04 | 13F | Quaker Wealth Management, LLC | 183 | 10 | ||||||
| 2025-08-14 | 13F | Warren Averett Asset Management, LLC | 529 774 | 2,74 | 27 728 | 5,30 | ||||
| 2025-08-06 | 13F | Innealta Capital, Llc | 47 198 | 28,46 | 2 470 | 31,66 | ||||
| 2025-08-08 | 13F | Capital Investment Advisory Services, LLC | 21 263 | −8,05 | 1 113 | −5,76 | ||||
| 2025-07-25 | 13F | M3 Advisory Group, LLC | 15 872 | −4,52 | 831 | −2,24 | ||||
| 2025-08-08 | 13F | Meridian Wealth Management, LLC | 251 319 | −0,93 | 13 154 | 1,54 | ||||
| 2025-07-07 | 13F | First Community Trust Na | 5 820 | 0,28 | 305 | 2,70 | ||||
| 2025-07-09 | 13F | Clarus Wealth Advisors | 88 250 | 2,01 | 4 667 | 11,28 | ||||
| 2025-07-15 | 13F | Axis Wealth Partners, LLC | 47 775 | 24,96 | 2 501 | 28,07 | ||||
| 2025-08-14 | 13F | Atom Investors LP | 0 | −100,00 | 0 | |||||
| 2025-08-14 | 13F | Herold Advisors, Inc. | 12 839 | 17,30 | 672 | 20,25 | ||||
| 2025-07-28 | 13F | Kiker Wealth Management, LLC | 0 | −100,00 | 0 | |||||
| 2025-08-05 | 13F | C2P Capital Advisory Group, LLC d.b.a. Prosperity Capital Advisors | 4 294 | −22,74 | 225 | −20,85 | ||||
| 2025-08-06 | 13F | Destiny Capital Corp/CO | 333 034 | 7,44 | 17 431 | 10,11 | ||||
| 2025-07-28 | 13F | Courier Capital Llc | 662 146 | 8,42 | 34 657 | 11,12 | ||||
| 2025-07-29 | 13F | Regions Financial Corp | 19 614 | 7,36 | 1 027 | 10,09 | ||||
| 2025-08-13 | 13F | Hsbc Holdings Plc | 103 627 | 86,50 | 5 424 | 91,15 | ||||
| 2025-08-14 | 13F | Visionary Wealth Advisors | 416 777 | 4,45 | 21 814 | 7,05 | ||||
| 2025-07-24 | 13F | Us Bancorp \de\ | 62 530 | −1,85 | 3 273 | 0,58 | ||||
| 2025-08-18 | 13F/A | National Bank Of Canada /fi/ | 3 599 | 53,08 | 188 | 56,67 | ||||
| 2025-07-24 | 13F | Coordinated Financial Services, Inc. | 13 775 | 25,99 | 721 | 28,98 | ||||
| 2025-08-12 | 13F | Howe & Rusling Inc | 3 358 | 3,58 | 176 | 6,06 | ||||
| 2025-07-30 | 13F | Crewe Advisors LLC | 828 | 208,96 | 43 | 230,77 | ||||
| 2025-07-29 | 13F | Tradewinds Capital Management, LLC | 33 980 | −10,90 | 1 779 | −8,68 | ||||
| 2025-08-12 | 13F | CIBC Private Wealth Group, LLC | 183 619 | 4,62 | 9 611 | 21,38 | ||||
| 2025-08-14 | 13F | STAR Financial Bank | 4 832 | 0,00 | 253 | 2,44 | ||||
| 2025-04-17 | 13F | Qrg Capital Management, Inc. | 0 | −100,00 | 0 | |||||
| 2025-07-18 | 13F | Cooper Financial Group | 109 965 | −13,22 | 5 756 | −11,06 | ||||
| 2025-07-22 | 13F | MBL Wealth, LLC | 8 840 | 0,00 | 463 | 2,44 | ||||
| 2025-08-01 | 13F | Advisory Alpha, LLC | 5 213 790 | 3,78 | 272 890 | 6,63 | ||||
| 2025-08-13 | 13F | Denver Wealth Management, Inc. | 135 407 | −2,26 | 7 087 | 0,17 | ||||
| 2025-08-14 | 13F | Sargent Investment Group, LLC | 254 576 | −9,32 | 13 424 | −6,37 | ||||
| 2025-07-16 | 13F | MKT Advisors LLC | 24 805 | 30,36 | 1 311 | 50,17 | ||||
| 2025-07-17 | 13F | Raleigh Capital Management Inc. | 0 | −100,00 | 0 | |||||
| 2025-08-26 | NP | Northern Lights Variable Trust - TOPS Balanced ETF Portfolio Class 1 shares | 180 223 | 3,06 | 9 433 | 5,61 | ||||
| 2025-07-11 | 13F | Windsor Capital Management, LLC | 344 305 | 1,01 | 18 021 | 3,52 | ||||
| 2025-07-02 | 13F | First Financial Bank - Trust Division | 8 054 | 0,00 | 422 | 2,43 | ||||
| 2025-08-14 | 13F | Sentinus, LLC | 6 782 | 355 | ||||||
| 2025-07-16 | 13F | Northern Oak Wealth Management Inc | 302 295 | −1,38 | 15 822 | 1,07 | ||||
| 2025-08-11 | 13F | Synergy Investment Management, LLC | 124 847 | 15,12 | 6 534 | 17,98 | ||||
| 2025-07-29 | 13F | Swmg, Llc | 17 468 | 23,39 | 935 | 35,51 | ||||
| 2025-08-11 | 13F | Nomura Asset Management Co Ltd | 204 765 | −11,89 | 10 717 | −9,69 | ||||
| 2025-08-12 | 13F | OneAscent Financial Services LLC | 29 090 | −8,39 | 2 | 0,00 | ||||
| 2025-08-13 | 13F | GeoWealth Management, LLC | 6 658 | 6,78 | 348 | 9,43 | ||||
| 2025-07-15 | 13F | Colonial River Wealth Management, LLC | 16 205 | 4,14 | 864 | 8,69 | ||||
| 2025-07-17 | 13F | Beacon Capital Management, LLC | 2 167 | 138,66 | 113 | 145,65 | ||||
| 2025-08-06 | 13F | Able Wealth Management LLC | 16 819 | 880 | ||||||
| 2025-08-13 | 13F | Mayfair Advisory Group, LLC | 7 018 | 0,00 | 374 | 4,47 | ||||
| 2025-08-13 | 13F | Summit Wealth Group Llc / Co | 5 285 | 277 | ||||||
| 2025-07-25 | 13F | Cascade Investment Advisors, Inc. | 7 275 | −1,69 | 381 | 0,80 | ||||
| 2025-08-12 | 13F | Gladstone Institutional Advisory LLC | 766 456 | 5,75 | 40 116 | 8,38 | ||||
| 2025-08-15 | 13F | Provenance Wealth Advisors, LLC | 5 211 | 0,00 | 273 | 2,26 | ||||
| 2025-04-22 | 13F | Shum Financial Group, Inc. | 52 660 | 2,22 | 2 689 | 2,09 | ||||
| 2025-08-11 | 13F | Brown Brothers Harriman & Co | 95 | 0,00 | 5 | 0,00 | ||||
| 2025-08-14 | 13F | Fwl Investment Management, Llc | 735 | 0,00 | 38 | 2,70 | ||||
| 2025-07-10 | 13F | YHB Investment Advisors, Inc. | 8 581 | 449 | ||||||
| 2025-08-13 | 13F | Cary Street Partners Financial Llc | 258 306 | −13,08 | 13 520 | −10,92 | ||||
| 2025-08-07 | 13F | Altman Advisors, Inc. | 132 856 | 2,25 | 1 738 | 7,22 | ||||
| 2025-05-13 | 13F | Quadrature Capital Ltd | 0 | −100,00 | 0 | |||||
| 2025-07-08 | 13F | Nbc Securities, Inc. | 34 427 | 209,15 | 2 | |||||
| 2025-08-18 | 13F/A | Kestra Investment Management, LLC | 8 168 | 26,83 | 428 | 30,18 | ||||
| 2025-07-31 | 13F | Hobart Private Capital, LLC | 235 619 | 8,02 | 12 332 | 10,71 | ||||
| 2025-07-14 | 13F | E&G Advisors, LP | 32 442 | −0,63 | 1 698 | 1,80 | ||||
| 2025-07-31 | 13F | Ground Swell Capital, LLC | 0 | −100,00 | 0 | |||||
| 2025-08-13 | 13F | Vance Wealth, Inc. | 52 928 | −8,02 | 2 770 | −5,72 | ||||
| 2025-08-05 | 13F | Huntington National Bank | 29 | −91,57 | ||||||
| 2025-08-11 | 13F | Principal Securities, Inc. | 13 718 | −20,31 | 718 | −18,41 | ||||
| 2025-07-17 | 13F | Sound Income Strategies, LLC | 807 | 75,82 | 42 | 82,61 | ||||
| 2025-07-29 | 13F | Northern Capital Management, Inc. | 24 844 | 120,87 | 1 300 | 126,48 | ||||
| 2025-07-23 | 13F | Valmark Advisers, Inc. | 8 271 615 | 4,11 | 432 936 | 6,70 | ||||
| 2025-07-24 | 13F | Thompson Investment Management, Inc. | 1 290 | 0,86 | 68 | 3,08 | ||||
| 2025-07-17 | 13F | Janney Montgomery Scott LLC | 794 001 | −26,13 | 42 | −24,07 | ||||
| 2025-07-28 | 13F | Rik Saylor Financial, Inc. | 22 971 | 0,03 | 1 202 | 2,56 | ||||
| 2025-07-15 | 13F | Norden Group Llc | 44 416 | 25,87 | 2 325 | 28,97 | ||||
| 2025-07-22 | 13F | Valpey Financial Services, LLC | 35 595 | 1 863 | ||||||
| 2025-07-29 | 13F | Chicago Partners Investment Group LLC | 36 087 | −1,69 | 1 937 | 6,67 | ||||
| 2025-08-12 | 13F | Investments & Financial Planning, LLC | 12 001 | 0,38 | 628 | 2,95 | ||||
| 2025-07-25 | 13F | Integrated Capital Management, Inc. | 5 334 | 3,45 | 279 | 6,08 | ||||
| 2025-07-28 | 13F | WealthPlan Investment Management, LLC | 5 713 | 0,58 | 299 | 3,10 | ||||
| 2025-08-11 | 13F | Arrow Financial Corp | 799 564 | 0,47 | 41 849 | 2,97 | ||||
| 2025-07-24 | 13F | CarsonAllaria Wealth Management, Ltd. | 377 880 | 3,28 | 19 778 | 5,84 | ||||
| 2025-07-18 | 13F | Warren Street Wealth Advisors, LLC | 12 309 | 1,73 | 644 | 4,38 | ||||
| 2025-08-14 | 13F | Graney & King, LLC | 59 213 | −81,55 | 3 099 | −81,09 | ||||
| 2025-08-12 | 13F | BlackRock, Inc. | 38 546 | −18,02 | 2 017 | −15,99 | ||||
| 2025-07-08 | 13F | Goldstone Financial Group, LLC | 215 595 | 4,70 | 11 472 | 9,09 | ||||
| 2025-08-08 | 13F | Oak Harvest Investment Services | 187 169 | −2,65 | 9 796 | −0,22 | ||||
| 2025-08-04 | 13F | Crescent Sterling, Ltd. | 8 493 | −16,01 | 445 | −13,95 | ||||
| 2025-07-22 | 13F | Relyea Zuckerberg Hanson LLC | 33 119 | 0,31 | 1 733 | 2,79 | ||||
| 2025-08-12 | 13F | Jacobi Capital Management LLC | 12 170 | −97,73 | 637 | −97,68 | ||||
| 2025-08-14 | 13F | Foronjy Financial Llc | 176 652 | 9 246 | ||||||
| 2025-08-13 | 13F | SCS Capital Management LLC | 7 131 | 0,00 | 373 | 2,47 | ||||
| 2025-08-14 | 13F | Redwood Investment Management, Llc | 26 620 | −1,23 | 1 | 0,00 | ||||
| 2025-07-17 | 13F | Nelson, Van Denburg & Campbell Wealth Management Group, LLC | 619 361 | 2,01 | 32 417 | 4,54 | ||||
| 2025-07-31 | 13F | Optimum Investment Advisors | 1 200 | 0,00 | 63 | 1,64 | ||||
| 2025-08-06 | 13F | RFG - Bristol Wealth Advisors, LLC | 85 139 | 18,41 | 4 456 | 21,38 | ||||
| 2025-08-14 | 13F | Summit Trail Advisors, Llc | 6 422 | −52,48 | 336 | −51,30 | ||||
| 2025-08-14 | 13F | UBS Group AG | 6 609 996 | −1,62 | 345 967 | 0,83 | ||||
| 2025-07-16 | 13F | Diversified Enterprises, LLC | 10 050 | −14,61 | 526 | −12,48 | ||||
| 2025-08-14 | 13F | Dagco, Inc. | 30 527 | 1,37 | 1 598 | 3,90 | ||||
| 2025-07-10 | 13F | HF Advisory Group, LLC | 12 645 | 2,22 | 662 | 4,75 | ||||
| 2025-08-14 | 13F | Gerber Kawasaki Wealth & Investment Management | 2 096 598 | 4,16 | 109 736 | 6,75 | ||||
| 2025-08-13 | 13F | Cresset Asset Management, LLC | 22 165 | −5,63 | 1 160 | −3,25 | ||||
| 2025-07-15 | 13F | Bfsg, Llc | 0 | −100,00 | 0 | |||||
| 2025-07-18 | 13F | Lowery Thomas, Llc | 15 367 | −12,92 | 804 | −10,77 | ||||
| 2025-08-28 | NP | ICSIX - Dynamic U.S. Opportunity Fund Class I | 42 311 | 2 215 | ||||||
| 2025-07-08 | 13F | Atwood & Palmer Inc | 306 | −92,48 | 16 | −92,27 | ||||
| 2025-08-11 | 13F | Heritage Wealth Advisors | 2 200 | 0,00 | 115 | 2,68 | ||||
| 2025-08-13 | 13F | Townsquare Capital Llc | 276 409 | −92,41 | 14 467 | −92,22 | ||||
| 2025-07-25 | 13F | RHS Financial, LLC | 9 067 | 475 | ||||||
| 2025-08-13 | 13F | Willis Johnson & Associates, Inc. | 4 392 930 | 6,28 | 229 926 | 8,92 | ||||
| 2025-07-22 | 13F | Integrated Capital Management, LLC | 419 637 | 4,52 | 22 | 10,00 | ||||
| 2025-07-29 | 13F | Wealthstream Advisors, Inc. | 14 932 | 0,00 | 782 | 2,49 | ||||
| 2025-08-07 | 13F | 1st Source Bank | 47 608 | 3,58 | 2 492 | 6,14 | ||||
| 2025-08-26 | NP | EQ ADVISORS TRUST - EQ/Large Cap Core Managed Volatility Portfolio Class IB | 82 600 | 919,75 | 4 323 | 946,73 | ||||
| 2025-07-08 | 13F | Partnership Wealth Management, LLC | 138 907 | 0,89 | 7 270 | 3,40 | ||||
| 2025-08-13 | 13F | IAG Wealth Partners, LLC | 109 310 | 37,25 | 5 721 | 40,67 | ||||
| 2025-07-25 | 13F | Verdence Capital Advisors LLC | 17 804 | −19,48 | 932 | −17,54 | ||||
| 2025-08-13 | 13F | Baltimore-Washington Financial Advisors, Inc. | 27 507 | −3,66 | 1 440 | −1,30 | ||||
| 2025-08-07 | 13F | Greystone Financial Group, LLC | 6 773 | −0,25 | 354 | 2,31 | ||||
| 2025-08-07 | 13F | Cascade Financial Partners, LLC | 4 000 | −23,49 | 209 | −21,43 | ||||
| 2025-07-16 | 13F | Dakota Wealth Management | 635 558 | 39,13 | 33 265 | 42,60 | ||||
| 2025-07-18 | 13F | SOA Wealth Advisors, LLC. | 236 701 | −27,01 | 12 389 | −25,19 | ||||
| 2025-07-25 | 13F | PrairieView Partners, LLC | 3 131 | 0,00 | 0 | |||||
| 2025-07-10 | 13F | Arbor Wealth Advisors LLC | 9 650 | 0,00 | 505 | 2,64 | ||||
| 2025-07-17 | 13F | CWA Asset Management Group, LLC | 25 863 | −11,82 | 1 354 | −9,62 | ||||
| 2025-08-06 | 13F | Legacy Wealth Managment, LLC/ID | 688 | 0,00 | 36 | 2,86 | ||||
| 2025-07-23 | 13F | Wise Wealth Partners | 5 173 | −5,53 | 271 | −3,23 | ||||
| 2025-07-28 | 13F | Ritholtz Wealth Management | 40 136 | −55,25 | 2 101 | −54,15 | ||||
| 2025-08-05 | 13F | Mma Asset Management Llc | 5 733 | −0,02 | 300 | 2,74 | ||||
| 2025-08-27 | NP | FFOX - FundX Future Fund Opportunities ETF | 365 | 19 | ||||||
| 2025-07-07 | 13F | Global Wealth Strategies & Associates | 995 | 0,00 | 52 | 4,00 | ||||
| 2025-09-11 | 13F | Milestones Private Investment Advisors LLC | 38 177 | 1 998 | ||||||
| 2025-08-05 | 13F | Tsfg, Llc | 526 419 | −16,46 | 28 | −15,62 | ||||
| 2025-06-10 | 13F | Birchbrook, Inc. | 0 | −100,00 | 0 | −100,00 | ||||
| 2025-08-11 | 13F | Lowe Brockenbrough & Co Inc | 15 873 | −0,94 | 831 | 1,47 | ||||
| 2025-08-13 | 13F | JT Stratford LLC | 47 303 | 0,39 | 2 476 | 2,87 | ||||
| 2025-07-29 | 13F | Private Trust Co Na | 89 397 | −13,66 | 4 679 | −11,50 | ||||
| 2025-08-14 | 13F | Fmr Llc | 1 061 274 | −4,05 | 55 547 | −1,66 | ||||
| 2025-08-12 | 13F | Cynosure Management, Llc | 370 454 | 0,38 | 19 390 | 2,88 | ||||
| 2025-08-14 | 13F | Connecticut Wealth Management, LLC | 3 051 332 | 11,44 | 159 707 | 14,21 | ||||
| 2025-08-05 | 13F | Key FInancial Inc | 153 644 | 8,10 | 8 042 | 10,79 | ||||
| 2025-08-14 | 13F | Acorn Wealth Advisors, LLC | 9 090 | 10,84 | 476 | 13,64 | ||||
| 2025-08-04 | 13F | Barnes Dennig Private Wealth Management LLC | 181 | 0,00 | 9 | 0,00 | ||||
| 2025-07-21 | 13F | Wallington Asset Management, LLC | 13 445 | −7,63 | 704 | −5,38 | ||||
| 2025-07-30 | 13F | CORDA Investment Management, LLC. | 52 162 | 0,06 | 2 730 | 2,55 | ||||
| 2025-07-29 | 13F | Angeles Wealth Management, Llc | 1 782 982 | −7,03 | 93 321 | −4,72 | ||||
| 2025-08-14 | 13F | Financial Network Wealth Advisors LLC | 27 440 | −0,83 | 1 436 | 1,63 | ||||
| 2025-04-02 | 13F | Marcum Wealth, LLC | 83 568 | 1,45 | 4 268 | 1,31 | ||||
| 2025-07-25 | 13F | Riverpoint Wealth Management Holdings, LLC | 29 266 | −1,59 | 1 532 | 0,86 | ||||
| 2025-08-13 | 13F | MONECO Advisors, LLC | 611 808 | 12,94 | 32 022 | 15,75 | ||||
| 2025-08-14 | 13F | Integrated Wealth Concepts LLC | 1 000 442 | 32,74 | 52 363 | 36,04 | ||||
| 2025-08-26 | NP | Northern Lights Variable Trust - TOPS Managed Risk Flex ETF Portfolio | 123 927 | −4,03 | 6 486 | −1,64 | ||||
| 2025-08-14 | 13F | Royal Bank Of Canada | 4 673 435 | 10,75 | 244 607 | 13,50 | ||||
| 2025-07-25 | 13F | Apollon Wealth Management, LLC | 5 527 | 2,69 | 289 | 5,47 | ||||
| 2025-05-16 | 13F | Coordinated Financial Services, Inc./CO | 13 286 | 36,52 | 679 | 43,04 | ||||
| 2025-08-14 | 13F | Mission Creek Capital Partners, Inc. | 6 273 | −4,48 | 328 | −2,09 | ||||
| 2025-05-15 | 13F | RMB Capital Management, LLC | 0 | −100,00 | 0 | |||||
| 2025-08-08 | 13F | Hartland & Co., LLC | 6 358 | −1,21 | 333 | 1,22 | ||||
| 2025-07-23 | 13F | Trifecta Capital Advisors, LLC | 3 903 | −10,58 | 204 | −8,11 | ||||
| 2025-08-11 | 13F | Wealthspire Advisors, LLC | 42 431 | −12,69 | 2 221 | −10,52 | ||||
| 2025-08-13 | 13F | Natixis Advisors, L.p. | 116 307 | −14,65 | 6 | 0,00 | ||||
| 2025-08-15 | 13F | Optimist Retirement Group LLC | 231 117 | −0,78 | 12 097 | 1,69 | ||||
| 2025-07-08 | 13F/A | Salem Investment Counselors Inc | 13 | 0,00 | 1 | |||||
| 2025-08-13 | 13F | Idaho Trust Bank | 63 679 | −2,62 | 3 333 | −0,21 | ||||
| 2025-07-28 | 13F | WJ Wealth Management, LLC | 38 302 | −5,08 | 2 005 | −2,72 | ||||
| 2025-08-08 | 13F | Rakuten Securities, Inc. | 1 | 0,00 | 0 | |||||
| 2025-07-24 | 13F | Ronald Blue Trust, Inc. | 1 354 | 5,95 | 71 | 7,69 | ||||
| 2025-08-05 | 13F | Arrowroot Family Office, LLC | 4 928 | −20,34 | 258 | −18,67 | ||||
| 2025-08-13 | 13F | GM Advisory Group, Inc. | 13 106 | 0,00 | 686 | 2,39 | ||||
| 2025-08-14 | 13F | Atomi Financial Group, Inc. | 6 824 | 3,82 | 357 | 6,57 | ||||
| 2025-07-29 | 13F | Smithbridge Asset Management Inc/de | 174 450 | 17,97 | 9 131 | 20,90 | ||||
| 2025-07-16 | 13F/A | CX Institutional | 304 726 | 17,81 | 16 | 15,38 | ||||
| 2025-07-21 | 13F | Ameriflex Group, Inc. | 5 725 | 84,20 | 297 | 87,97 | ||||
| 2025-08-14 | 13F | Ancora Advisors, LLC | 3 019 | −0,07 | 158 | 2,60 | ||||
| 2025-08-05 | 13F | BCGM Wealth Management, LLC | 14 018 | −3,28 | 734 | −0,95 | ||||
| 2025-08-07 | 13F | Hughes Financial Services, LLC | 198 | 0,00 | 10 | 0,00 | ||||
| 2025-08-05 | 13F | Lifeworks Advisors, LLC | 31 700 | −1,54 | 1 659 | 0,91 | ||||
| 2025-07-24 | 13F | Horizon Bancorp Inc /in/ | 36 | 0,00 | 0 | |||||
| 2025-07-16 | 13F | Howard Capital Management Group, LLC | 4 273 | 0,00 | 224 | 2,29 | ||||
| 2025-08-14 | 13F | Jane Street Group, Llc | 15 040 | 95,32 | 787 | 100,25 | ||||
| 2025-07-25 | 13F | Ackerman Capital Advisors, LLC | 471 136 | 60,16 | 24 659 | 64,14 | ||||
| 2025-08-06 | 13F | ZEGA Investments, LLC | 4 536 | 10,80 | 237 | 13,40 | ||||
| 2025-07-11 | 13F | Pinnacle Bancorp, Inc. | 10 746 | −12,73 | 562 | −10,51 | ||||
| 2025-08-06 | 13F | Golden State Wealth Management, LLC | 81 252 | −1,07 | 4 253 | 1,38 | ||||
| 2025-08-08 | 13F | Accredited Investors Inc. | 788 483 | −4,65 | 41 269 | −2,28 | ||||
| 2025-07-24 | 13F | KC Investment Advisors, LLC | 5 860 | −0,34 | 307 | 2,00 | ||||
| 2025-08-05 | 13F | Strategic Financial Concepts, LLC | 989 774 | 3 960,94 | 51 805 | 4 064,31 | ||||
| 2025-07-30 | 13F | Fusion Family Wealth LLC | 4 706 | 0,00 | 246 | 2,50 | ||||
| 2025-04-29 | 13F | Element Wealth, LLC | 0 | −100,00 | 0 | |||||
| 2025-07-15 | 13F | Main Street Group, LTD | 1 628 | 0,49 | 85 | 3,66 | ||||
| 2025-07-23 | 13F | Bear Mountain Capital, Inc. | 0 | −100,00 | 0 | |||||
| 2025-08-26 | NP | Northern Lights Variable Trust - TOPS Aggressive Growth ETF Portfolio Class 2 shares | 177 053 | 9,70 | 9 267 | 12,42 | ||||
| 2025-07-21 | 13F | River Street Advisors LLC | 32 575 | −0,15 | 1 705 | 2,28 | ||||
| 2025-08-11 | 13F | Ritter Daniher Financial Advisory LLC / DE | 231 | 579,41 | 12 | 1 100,00 | ||||
| 2025-08-13 | 13F | Raab & Moskowitz Asset Management LLC | 54 553 | −7,04 | 2 855 | −4,71 | ||||
| 2025-07-29 | 13F | Stratos Wealth Advisors, LLC | 135 687 | 0,65 | 7 102 | 3,14 | ||||
| 2025-07-14 | 13F | Abound Wealth Management | 189 | −86,58 | 10 | −87,32 | ||||
| 2025-07-16 | 13F | ORG Wealth Partners, LLC | 575 | 16,16 | 30 | 20,00 | ||||
| 2025-07-16 | 13F | Signaturefd, Llc | 5 156 | 0,02 | 270 | 2,28 | ||||
| 2025-08-11 | 13F | Lcnb Corp | 6 250 | 0,00 | 327 | 2,51 | ||||
| 2025-07-24 | 13F | IFP Advisors, Inc | 33 078 | −7,37 | 1 731 | −5,05 | ||||
| 2025-07-30 | 13F | DecisionMap Wealth Management, LLC | 99 426 | 3,07 | 5 204 | 5,62 | ||||
| 2025-08-20 | 13F/A | Coppell Advisory Solutions LLC | 30 302 | 1 579 | ||||||
| 2025-08-08 | 13F | Better Money Decisions, LLC | 36 647 | 2,98 | 1 918 | 5,56 | ||||
| 2025-08-01 | 13F | American Financial & Tax Strategies Inc | 150 528 | 1,52 | 7 879 | 4,04 | ||||
| 2025-08-11 | 13F | Avantax Planning Partners, Inc. | 580 273 | 13,89 | 30 371 | 16,72 | ||||
| 2025-08-04 | 13F | Clear Investment Research, Llc | 2 375 | 0,47 | 124 | 3,33 | ||||
| 2025-07-21 | 13F | Crews Bank & Trust | 3 816 | 0,00 | 200 | 2,58 | ||||
| 2025-07-22 | 13F | Team Financial Group, LLC | 277 | 15 | ||||||
| 2025-08-14 | 13F | Stifel Financial Corp | 2 110 741 | 15,12 | 110 476 | 17,98 | ||||
| 2025-07-18 | 13F | Cantor Fitzgerald Investment Adviser L.p. | 30 792 | 7,85 | 1 612 | 10,49 | ||||
| 2025-07-25 | 13F | Sequoia Financial Advisors, LLC | 49 930 | −6,49 | 2 613 | −4,15 | ||||
| 2025-07-25 | 13F | Johnson Investment Counsel Inc | 14 585 | −46,71 | 763 | −45,38 | ||||
| 2025-07-24 | 13F | Capital Advisors, Ltd. LLC | 355 | 29,09 | 0 | |||||
| 2025-07-22 | 13F | BridgePort Financial Solutions, LLC | 8 118 | 0,45 | 425 | 2,91 | ||||
| 2025-05-06 | 13F | Fpc Investment Advisory, Inc. | 0 | −100,00 | 0 | −100,00 | ||||
| 2025-07-09 | 13F | Beacon Financial Group | 11 793 | 0,00 | 617 | 2,49 | ||||
| 2025-08-07 | 13F | Legacy Financial Advisors, Inc. | 0 | −100,00 | 0 | |||||
| 2025-08-14 | 13F | Hancock Whitney Corp | 5 796 | 303 | ||||||
| 2025-07-09 | 13F | Lbmc Investment Advisors, Llc | 13 475 | 0,47 | 705 | 3,07 | ||||
| 2025-08-05 | 13F | Atlas Private Wealth Advisors | 4 505 | 0,09 | 236 | 2,62 | ||||
| 2025-08-26 | 13F/A | Thrivent Financial For Lutherans | 14 787 | −97,60 | 1 | −100,00 | ||||
| 2025-07-03 | 13F | Higgins & Schmidt Wealth Strategies LLC | 564 436 | 12,08 | 29 543 | 14,87 | ||||
| 2025-07-22 | 13F | Iowa State Bank | 7 100 | 0,00 | 372 | 2,49 | ||||
| 2025-08-12 | 13F | Foster Dykema Cabot & Partners, Llc | 569 | 0,00 | 30 | 0,00 | ||||
| 2025-08-13 | 13F | American Money Management, LLC | 74 235 | −1,46 | 3 885 | 0,99 | ||||
| 2025-08-04 | 13F | Atria Investments Llc | 67 942 | −60,53 | 3 556 | −59,54 | ||||
| 2025-08-04 | 13F | Balentine LLC | 887 | −98,30 | 46 | −98,27 | ||||
| 2025-08-06 | 13F | First Horizon Advisors, Inc. | 120 | −49,58 | 6 | −50,00 | ||||
| 2025-08-13 | 13F | Cary Street Partner Investment Advisory Llc | 66 725 | 14,27 | 3 492 | 17,10 | ||||
| 2025-08-14 | 13F | Fiduciary Trust Co | 28 759 | 0,00 | 1 505 | 2,52 | ||||
| 2025-04-30 | 13F | Sofos Investments, Inc. | 163 483 | −0,08 | 8 349 | 4,74 | ||||
| 2025-05-14 | 13F | Synovus Financial Corp | 0 | −100,00 | 0 | |||||
| 2025-08-13 | 13F | Copley Financial Group, Inc. | 12 373 | 8,05 | 648 | 10,79 | ||||
| 2025-07-16 | 13F | Perigon Wealth Management, LLC | 65 283 | −11,15 | 3 417 | −8,96 | ||||
| 2025-08-14 | 13F/A | Skopos Labs, Inc. | 164 | −33,60 | 9 | −33,33 | ||||
| 2025-08-14 | 13F | Smartleaf Asset Management LLC | 18 083 | 477,18 | 942 | 496,20 | ||||
| 2025-08-14 | 13F | Peapack Gladstone Financial Corp | 5 644 | 0 | ||||||
| 2025-04-25 | 13F | EnRich Financial Partners LLC | 0 | −100,00 | 0 | |||||
| 2025-07-16 | 13F | ORG Partners LLC | 8 840 | 14,05 | 467 | 18,23 | ||||
| 2025-07-10 | 13F | Global Financial Private Client, LLC | 53 677 | 0,10 | 2 809 | 2,59 | ||||
| 2025-07-31 | 13F | Sequent Asset Management, LLC | 15 421 | −4,20 | 807 | −1,82 | ||||
| 2025-08-11 | 13F | VSM Wealth Advisory, LLC | 655 | 13,32 | 34 | 17,24 | ||||
| 2025-07-11 | 13F | Williams Financial, LLC | 354 528 | −15,19 | 18 556 | −13,09 | ||||
| 2025-07-22 | 13F | Innovative Wealth Building LLC | 4 095 | −57,21 | 214 | −56,15 | ||||
| 2025-08-14 | 13F | Gallagher Fiduciary Advisors, LLC | 6 506 | 26,11 | 341 | 29,28 | ||||
| 2025-04-25 | 13F | Smallwood Wealth Investment Management, LLC | 5 895 | 0,00 | 301 | 0,00 | ||||
| 2025-07-25 | 13F | Wells Financial Advisors INC | 43 730 | −2,79 | 2 289 | −0,39 | ||||
| 2025-08-18 | 13F | Tactive Advisors, LLC | 5 000 | 0,00 | 262 | 4,40 | ||||
| 2025-07-25 | 13F | Concord Asset Management, LLC/VA | 5 264 | 276 | ||||||
| 2025-07-16 | 13F | Independent Wealth Network Inc. | 140 868 | 3,44 | 7 373 | 6,01 | ||||
| 2025-09-04 | 13F/A | Advisor Group Holdings, Inc. | 3 727 553 | −4,03 | 195 083 | −1,66 | ||||
| 2025-07-09 | 13F | Affinity Capital Advisors, LLC | 36 093 | 174,43 | 1 889 | 200,32 | ||||
| 2025-07-16 | 13F | Crowley Wealth Management, Inc. | 1 322 | 0,00 | 69 | 2,99 | ||||
| 2025-08-08 | 13F | Tortoise Investment Management, LLC | 430 | 0,00 | 23 | 4,76 | ||||
| 2025-08-12 | 13F | J.w. Cole Advisors, Inc. | 79 390 | 15,24 | 4 155 | 18,11 | ||||
| 2025-07-10 | 13F | Capital Advisory Group Advisory Services, LLC | 133 154 | 9,03 | 6 969 | 11,75 | ||||
| 2025-08-13 | 13F | Flow Traders U.s. Llc | 6 941 | −8,20 | 0 | |||||
| 2025-08-14 | 13F | EP Wealth Advisors, Inc. | 48 010 | 11,59 | 2 513 | 14,34 | ||||
| 2025-07-07 | 13F | Thurston, Springer, Miller, Herd & Titak, Inc. | 572 | 0,00 | 30 | 0,00 | ||||
| 2025-08-13 | 13F | My Purposeful Wealth Corp. | 115 122 | 2,57 | 6 070 | 5,90 | ||||
| 2025-08-11 | 13F | Capital Square, LLC | 5 441 | 5,49 | 289 | 9,51 | ||||
| 2025-08-12 | 13F | Mcdonald Partners Llc | 13 348 | 5,51 | 699 | 8,05 | ||||
| 2025-08-13 | 13F | Tranquilli Financial Advisor LLC | 77 251 | −28,44 | 4 043 | −26,66 | ||||
| 2025-05-02 | 13F | Invera Wealth Advisors, LLC | 0 | −100,00 | 0 | |||||
| 2025-07-22 | 13F | Belpointe Asset Management LLC | 95 318 | 72,99 | 4 989 | 77,32 | ||||
| 2025-08-14 | 13F | Sei Investments Co | 9 194 | −12,80 | 481 | −10,59 | ||||
| 2025-07-17 | 13F | Venture Visionary Partners LLC | 135 902 | 4,31 | 7 113 | 6,90 | ||||
| 2025-08-13 | 13F | Brown Advisory Inc | 12 240 | −0,10 | 641 | 2,40 | ||||
| 2025-04-22 | 13F | Wolff Wiese Magana Llc | 0 | −100,00 | 0 | |||||
| 2025-08-11 | 13F | Aptus Capital Advisors, LLC | 6 951 | −6,94 | 364 | −4,72 | ||||
| 2025-08-12 | 13F/A | Cozad Asset Management Inc | 104 524 | −4,45 | 5 471 | −2,08 | ||||
| 2025-07-15 | 13F | Accurate Wealth Management, LLC | 7 100 | 29,30 | 377 | 46,12 | ||||
| 2025-08-11 | 13F | Anfield Capital Management, LLC | 118 | 0,00 | 6 | 0,00 | ||||
| 2025-08-14 | 13F | Betterment LLC | 2 512 074 | −2,44 | 131 | 0,00 | ||||
| 2025-08-13 | 13F | Vertex Planning Partners, LLC | 54 259 | 1,30 | 2 840 | 3,80 | ||||
| 2025-08-07 | 13F | McClarren Financial Advisors, Inc. | 0 | −100,00 | 0 | |||||
| 2025-08-13 | 13F | Balanced Wealth Group Llc | 770 196 | 4,18 | 40 601 | 7,78 | ||||
| 2025-08-11 | 13F | United Advisor Group, LLC | 79 247 | 53,39 | 4 148 | 57,20 | ||||
| 2025-07-16 | 13F | Freestate Advisors LLC | 327 023 | −1,56 | 17 116 | 0,88 | ||||
| 2025-07-30 | 13F | Nottingham Advisors, Inc. | 811 784 | −3,87 | 42 489 | −1,48 | ||||
| 2025-08-12 | 13F | Weitzel Financial Services, Inc. | 33 949 | 1,63 | 1 807 | 10,12 | ||||
| 2025-08-14 | 13F | Seven Mile Advisory | 28 006 | 0,00 | 1 466 | 2,45 | ||||
| 2025-07-15 | 13F | Hofer & Associates. Inc | 209 027 | 1,99 | 10 940 | 4,53 | ||||
| 2025-08-06 | 13F | Stone House Investment Management, LLC | 60 | 0,00 | 3 | 0,00 | ||||
| 2025-08-06 | 13F | Legacy Investment Solutions, LLC | 688 | 0,00 | 36 | 2,86 | ||||
| 2025-08-01 | 13F | Envestnet Asset Management Inc | 4 182 883 | −7,12 | 218 868 | −4,84 | ||||
| 2025-08-11 | 13F | Mosaic Family Wealth Partners, Llc | 4 627 | 242 | ||||||
| 2025-07-11 | 13F | Rockwood Wealth Management, LLC | 4 994 | −3,42 | 261 | −1,14 | ||||
| 2025-08-12 | 13F | Argent Trust Co | 19 076 | 0,00 | 998 | 2,46 | ||||
| 2025-07-14 | 13F | Buttonwood Financial Group, LLC | 102 531 | 2,03 | 5 417 | 14,48 | ||||
| 2025-08-05 | 13F | Compton Financial Group, LLC | 972 397 | 32,15 | 50 895 | 35,44 | ||||
| 2025-08-18 | 13F | Geneos Wealth Management Inc. | 562 442 | 3,04 | 29 438 | 5,61 | ||||
| 2025-08-11 | 13F | von Borstel & Associates, Inc. | 0 | −100,00 | 0 | |||||
| 2025-08-07 | 13F | Donaldson Capital Management, Llc | 4 244 | 0,00 | 222 | 2,78 | ||||
| 2025-08-14 | 13F | Janus Henderson Group Plc | 34 437 | 0,11 | 1 802 | 3,50 | ||||
| 2025-08-01 | 13F | Penobscot Wealth Management | 127 031 | 7,94 | 6 649 | 10,62 | ||||
| 2025-08-08 | 13F | Thrive Capital Management, LLC | 6 312 | 330 | ||||||
| 2025-08-11 | 13F | Vanguard Group Inc | 7 656 | 9,34 | 401 | 12,04 | ||||
| 2025-08-11 | 13F | Pineridge Advisors LLC | 554 | 0,18 | 29 | 3,57 | ||||
| 2025-07-21 | 13F | Curran Financial Partners, LLC | 6 334 | 332 | ||||||
| 2025-08-13 | 13F | Valued Retirements, Inc. | 4 631 | 0,00 | 242 | 2,54 | ||||
| 2025-08-13 | 13F | Gateway Wealth Partners, LLC | 105 604 | 11,28 | 5 527 | 14,05 | ||||
| 2025-07-31 | 13F | Waldron Private Wealth LLC | 17 922 | 0,00 | 938 | 2,51 | ||||
| 2025-08-06 | 13F/A | Headland Capital, LLC | 15 959 | 0,03 | 835 | 2,58 | ||||
| 2025-08-14 | 13F | Group One Trading, L.p. | 83 | 4 | ||||||
| 2025-08-04 | 13F | IFG Advisory, LLC | 269 924 | 43,75 | 14 128 | 47,33 | ||||
| 2025-08-13 | 13F | Fisher Asset Management, LLC | 0 | −100,00 | 0 | |||||
| 2025-07-25 | 13F | Priebe Wealth Holdings LLC | 30 077 | −61,61 | 1 574 | −60,65 | ||||
| 2025-08-14 | 13F | Jane Street Group, Llc | Call | 89 800 | 344,55 | 4 700 | 355,87 | |||
| 2025-07-15 | 13F | Ballentine Partners, LLC | 6 359 | 0,08 | 333 | 2,47 | ||||
| 2025-07-09 | 13F | Westbourne Investments, Inc. | 4 075 | 213 | ||||||
| 2025-04-14 | 13F | Whitaker-Myers Wealth Managers, LTD. | 0 | −100,00 | 0 | |||||
| 2025-07-23 | 13F | Steel Peak Wealth Management LLC | 321 207 | −55,28 | 16 812 | −54,17 | ||||
| 2025-08-12 | 13F | Retirement Planning Co of New England, Inc. | 7 266 | 1,88 | 380 | 4,40 | ||||
| 2025-08-13 | 13F | Wambolt & Associates, LLC | 49 619 | −2,41 | 2 623 | 1,08 | ||||
| 2025-08-07 | 13F | Flagship Wealth Advisors, Llc | 0 | −100,00 | 0 | |||||
| 2025-08-14 | 13F | Wiley Bros.-aintree Capital, Llc | 83 525 | 185,43 | 4 372 | 195,14 | ||||
| 2025-08-06 | 13F | Soltis Investment Advisors LLC | 5 680 | −20,41 | 297 | −18,41 | ||||
| 2025-08-11 | 13F | NewEdge Wealth, LLC | 11 442 | 28,58 | 605 | 33,04 |
Other Listings
| MX:SPYV |