Grundläggande statistik
| Institutionella ägare | 238 total, 238 long only, 0 short only, 0 long/short - change of −0,42% MRQ |
| Genomsnittlig portföljallokering | 0.8636 % - change of −6,22% MRQ |
| Institutionella aktier (lång) | 27 117 004 (ex 13D/G) - change of 1,19MM shares 4,60% MRQ |
| Institutionellt värde (lång) | $ 1 223 635 USD ($1000) |
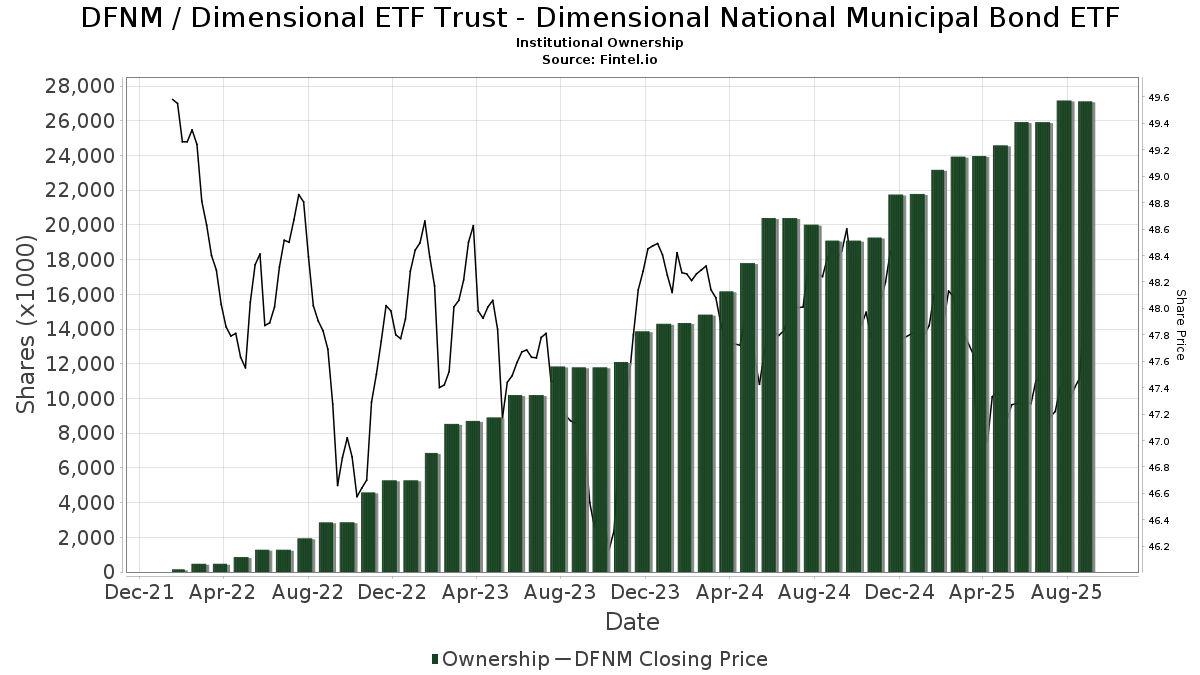
Institutionellt ägande och aktieägare
Dimensional ETF Trust - Dimensional National Municipal Bond ETF (US:DFNM) har 238 Institutionella ägare och aktieägare som har lämnat in 13D/G- eller 13F-formulär till Securities Exchange Commission (SEC). Dessa institut innehar totalt 27,117,004 aktier. Största aktieägare inkluderar Truepoint, Inc., Colony Group, LLC, Foster Group, Inc., GeoWealth Management, LLC, Beaird Harris Wealth Management, LLC, Pathstone Holdings, LLC, Rather & Kittrell, Inc., Sequoia Financial Advisors, LLC, Buckingham Strategic Partners, and MBL Wealth, LLC .
Dimensional ETF Trust - Dimensional National Municipal Bond ETF (ARCA:DFNM) Institutionell ägarstruktur visar institutioners och fonders nuvarande positioner i företaget, samt de senaste förändringarna i positionernas storlek. Större aktieägare kan vara enskilda investerare, fonder, hedgefonder eller institutioner. Bilaga 13D visar att investeraren äger (eller ägde) mer än 5% av företaget och avser (eller avsåg) att aktivt eftersträva en förändring av affärsstrategin. Schedule 13G indikerar en passiv investering på över 5%.
The share price as of September 17, 2025 is 48,16 / share. Previously, on September 17, 2024, the share price was 48,43 / share. This represents a decline of 0,56% over that period.
Fondsentimentets poäng
Fondsentimentet poängen(fka Ägarackumulation-poäng) visar vilka aktier som är mest köpta av fonder. Det är resultatet av en sofistikerad kvantitativ flerfaktormodell som identifierar företag med de högsta nivåerna av institutionell ackumulering. Poängsättningsmodellen använder en kombination av den totala ökningen av redovisade ägare, förändringarna i portföljallokeringarna för dessa ägare och andra mått. Siffran sträcker sig från 0 till 100, där högre siffror indikerar en högre nivå av ackumulering i förhållande till sina konkurrenter, och 50 är genomsnittet.
Uppdateringsfrekvens: Dagligen
Se Ownership Explorer, som innehåller en lista över de högst rankade företagen.
Institutionell sälj/köp-kvot
Förutom att rapportera vanliga eget kapital- och skuldemissioner måste institutioner med mer än 100MM tillgångar under förvaltning också avslöja sina innehav av sälj- och köpoptioner. Eftersom säljoptioner i allmänhet indikerar ett negativt sentiment och köpoptioner indikerar ett positivt sentiment, kan vi få en uppfattning om det övergripande institutionella sentimentet genom att plotta förhållandet mellan säljoptioner och köpoptioner. Diagrammet till höger visar det historiska förhållandet mellan sälj- och köpoptioner för detta instrument.
Genom att använda sälj/köp-kvoten som en indikator på aktieägarnas sentiment undviker man en av de största bristerna med att använda det totala institutionella ägandet, nämligen att en betydande del av de förvaltade tillgångarna investeras passivt för att följa index. Passivt förvaltade fonder köper vanligtvis inte optioner, så indikatorn för sälj/köp-kvoten ger en bättre bild av stämningen i aktivt förvaltade fonder.
13F- och NPORT-arkiveringar
Detaljer om 13F-arkiveringar är gratis. Detaljer om NP-arkiveringar kräver ett premiummedlemskap. Gröna rader indikerar nya positioner. Röda rader indikerar stängda positioner. Klicka på länk symbolen för att se hela transaktionshistoriken.
Uppgradera
för att låsa upp premiumdata och exportera till Excel ![]() .
.
| Fil Datum | Källa | Investerare | Typ | Genomsnittligt pris (beräknat) |
Aktier | Δ Aktier (%) |
Rapporterat värde (1000 USD) |
Δ Värde (%) |
Portföljallokering (%) |
|
|---|---|---|---|---|---|---|---|---|---|---|
| 2025-04-14 | 13F | McCarthy & Cox | 0 | −100,00 | 0 | |||||
| 2025-07-28 | 13F | RCS Financial Planning, LLC | 8 455 | 7,04 | 401 | 6,93 | ||||
| 2025-07-22 | 13F | Awm Capital, Llc | 472 297 | 37,42 | 22 401 | 37,02 | ||||
| 2025-08-14 | 13F | Kovitz Investment Group Partners, LLC | 234 555 | 1 713,34 | 11 125 | 1 708,78 | ||||
| 2025-08-05 | 13F | GPS Wealth Strategies Group, LLC | 2 000 | −46,02 | 95 | −46,59 | ||||
| 2025-07-14 | 13F | Shearwater Capital LLC | 40 051 | 2,76 | 1 900 | 2,43 | ||||
| 2025-07-22 | 13F | Iowa State Bank | 11 271 | 0,00 | 535 | −0,37 | ||||
| 2025-07-15 | 13F | Level Financial Advisors, Inc. | 5 775 | 274 | ||||||
| 2025-05-05 | 13F | J.w. Cole Advisors, Inc. | 0 | −100,00 | 0 | −100,00 | ||||
| 2025-08-12 | 13F | Tableaux Llc | 0 | −100,00 | 0 | |||||
| 2025-08-13 | 13F | Jones Financial Companies Lllp | 11 233 | 160,02 | 532 | 159,51 | ||||
| 2025-08-13 | 13F | Cary Street Partner Investment Advisory Llc | 2 101 | −64,40 | 100 | −64,64 | ||||
| 2025-08-11 | 13F | One Capital Management, LLC | 20 480 | 14,19 | 971 | 13,83 | ||||
| 2025-08-14 | 13F | Sentinel Wealth Management, Inc. | 107 077 | 5 | ||||||
| 2025-05-01 | 13F | McCarthy Grittinger Financial Group, LLC | 0 | −100,00 | 0 | |||||
| 2025-07-10 | 13F | Websterrogers Financial Advisors, Llc | 27 357 | 29,11 | 1 298 | 28,80 | ||||
| 2025-08-08 | 13F | Truepoint, Inc. | 2 637 846 | −3,56 | 125 113 | −3,85 | ||||
| 2025-05-01 | 13F | Bleakley Financial Group, LLC | 0 | −100,00 | 0 | −100,00 | ||||
| 2025-07-10 | 13F | Strathmore Capital Advisors, Inc. | 259 734 | −29,35 | 12 332 | −29,78 | ||||
| 2025-08-12 | 13F | Jacobi Capital Management LLC | 10 556 | 0,74 | 501 | 0,40 | ||||
| 2025-08-14 | 13F | Great Valley Advisor Group, Inc. | 33 685 | 1,13 | 1 598 | 0,82 | ||||
| 2025-08-15 | 13F | Binnacle Investments Inc | 10 594 | 25,67 | 502 | 25,19 | ||||
| 2025-07-31 | 13F | CVA Family Office, LLC | 10 785 | 0,00 | 512 | −0,39 | ||||
| 2025-07-11 | 13F | Farther Finance Advisors, LLC | 2 062 | −0,48 | 98 | −1,02 | ||||
| 2025-08-06 | 13F | Summit Wealth Group, LLC | 65 171 | 1 187,71 | 3 | |||||
| 2025-08-11 | 13F | Principal Securities, Inc. | 0 | −100,00 | 0 | |||||
| 2025-08-14 | 13F | Mpwm Advisory Solutions, Llc | 412 | 0,00 | 20 | 0,00 | ||||
| 2025-07-14 | 13F | Maryland Capital Advisors Inc. | 126 773 | −30,71 | 6 013 | −30,92 | ||||
| 2025-08-15 | 13F | CI Private Wealth, LLC | 85 352 | −22,59 | 4 048 | −22,82 | ||||
| 2025-07-23 | 13F | Quarry Hill Advisors, Llc | 38 427 | 6,28 | 1 823 | 5,99 | ||||
| 2025-08-11 | 13F | Western Wealth Management, LLC | 10 590 | −5,99 | 502 | −6,17 | ||||
| 2025-07-14 | 13F | AdvisorNet Financial, Inc | 311 | 0,65 | 15 | 0,00 | ||||
| 2025-07-17 | 13F | Porter White Investment Advisors, Inc. | 156 384 | 57,83 | 7 417 | 57,37 | ||||
| 2025-08-14 | 13F | Envision Financial Planning, LLC | 6 526 | −1,67 | 310 | −1,90 | ||||
| 2025-07-16 | 13F | Jentner Corp | 8 123 | 0,00 | 385 | −0,26 | ||||
| 2025-07-24 | 13F | Us Bancorp \de\ | 37 952 | 0,00 | 1 800 | −0,28 | ||||
| 2025-08-14 | 13F | Navigoe, LLC | 4 082 | 0,00 | 0 | |||||
| 2025-07-09 | 13F | Hiley Hunt Wealth Management | 38 041 | 0,35 | 1 806 | −0,11 | ||||
| 2025-08-14 | 13F | McIlrath & Eck, LLC | 7 686 | −18,83 | 365 | −19,11 | ||||
| 2025-07-17 | 13F | Northwest Wealth Management, Llc | 21 251 | −17,52 | 1 008 | −17,80 | ||||
| 2025-08-12 | 13F | LPL Financial LLC | 399 622 | 32,61 | 18 954 | 32,22 | ||||
| 2025-08-11 | 13F | HighTower Advisors, LLC | 578 554 | 5,20 | 27 441 | 4,88 | ||||
| 2025-07-17 | 13F | XY Planning Network, Inc. | 17 674 | 74,47 | 838 | 74,22 | ||||
| 2025-08-11 | 13F | Beta Wealth Group, Inc. | 8 290 | −7,56 | 393 | −7,75 | ||||
| 2025-07-14 | 13F | Park Avenue Securities Llc | 42 496 | 5,45 | 2 | 100,00 | ||||
| 2025-07-25 | 13F | Sequoia Financial Advisors, LLC | 781 593 | 4,96 | 37 071 | 4,65 | ||||
| 2025-08-11 | 13F | Diversified Portfolios, Inc. | 0 | −100,00 | 0 | |||||
| 2025-08-11 | 13F | Elequin Capital Lp | 0 | −100,00 | 0 | |||||
| 2025-05-13 | 13F | Wells Fargo & Company/mn | 0 | −100,00 | 0 | |||||
| 2025-07-16 | 13F | Tassel Capital Management, Inc. | 60 980 | 1,19 | 2 892 | 0,91 | ||||
| 2025-07-23 | 13F | Asset Planning Corporation | 217 686 | −20,21 | 10 325 | −20,44 | ||||
| 2025-07-22 | 13F | Wealthcare Advisory Partners LLC | 14 483 | 0,81 | 687 | 0,44 | ||||
| 2025-07-31 | 13F | City State Bank | 1 038 | 0,00 | 49 | 0,00 | ||||
| 2025-07-23 | 13F | Clear Creek Financial Management, LLC | 0 | −100,00 | 0 | |||||
| 2025-07-29 | 13F | Fundamentun, Llc | 9 475 | 449 | ||||||
| 2025-07-29 | 13F | Aspiriant, Llc | 347 452 | 4 541,36 | 16 480 | 4 528,93 | ||||
| 2025-07-22 | 13F | MBL Wealth, LLC | 667 113 | −3,86 | 31 641 | −4,14 | ||||
| 2025-07-30 | 13F | Exencial Wealth Advisors, Llc | 10 682 | 1,48 | 507 | 1,20 | ||||
| 2025-07-15 | 13F | Great Oak Capital Partners, Llc | 39 624 | 316,48 | 1 880 | 314,79 | ||||
| 2025-08-01 | 13F | Envestnet Asset Management Inc | 94 608 | −19,41 | 4 487 | −19,65 | ||||
| 2025-08-12 | 13F | Rather & Kittrell, Inc. | 782 727 | 1,95 | 37 125 | 1,65 | ||||
| 2025-08-15 | 13F | North Ridge Wealth Advisors, Inc. | 37 657 | −28,55 | 1 786 | −28,76 | ||||
| 2025-08-12 | 13F | Eldridge Investment Advisors, Inc. | 10 007 | −17,31 | 475 | −17,57 | ||||
| 2025-08-14 | 13F | Bank Of America Corp /de/ | 307 275 | −2,90 | 14 574 | −3,18 | ||||
| 2025-08-11 | 13F | Wescott Financial Advisory Group, LLC | 79 108 | −0,74 | 3 752 | −1,03 | ||||
| 2025-08-12 | 13F | Burk Holdings LLC | 8 555 | −6,29 | 406 | −6,68 | ||||
| 2025-07-21 | 13F | Creative Capital Management Investments LLC | 4 421 | −10,61 | 210 | −11,06 | ||||
| 2025-07-17 | 13F | Claris Advisors, Llc / Mo / | 10 288 | 16,22 | 488 | 15,68 | ||||
| 2025-07-18 | 13F | Citrine Capital LLC | 106 685 | −0,07 | 5 060 | −0,35 | ||||
| 2025-08-13 | 13F | Colonial Trust Co / SC | 5 921 | 1,06 | 281 | 0,72 | ||||
| 2025-07-31 | 13F | Core Wealth Management, Inc. | 110 149 | −6,46 | 5 224 | −6,73 | ||||
| 2025-08-06 | 13F | Commonwealth Equity Services, Llc | 589 215 | 0,70 | 28 | 0,00 | ||||
| 2025-08-14 | 13F | Smartleaf Asset Management LLC | 114 | 5 | ||||||
| 2025-08-11 | 13F | Root Financial Partners, LLC | 7 377 | 43,08 | 350 | 42,45 | ||||
| 2025-07-08 | 13F | Apella Capital, LLC | 611 392 | −4,99 | 29 023 | −3,85 | ||||
| 2025-08-14 | 13F | Jane Street Group, Llc | 0 | −100,00 | 0 | |||||
| 2025-07-21 | 13F | 25 Llc | 58 120 | 48,08 | 2 757 | 47,62 | ||||
| 2025-08-01 | 13F | Rossby Financial, LCC | 70 | −1,41 | 3 | 0,00 | ||||
| 2025-08-07 | 13F | Resources Investment Advisors, LLC. | 26 486 | −28,68 | 1 256 | −28,88 | ||||
| 2025-07-30 | 13F | Blume Capital Management, Inc. | 22 685 | −16,45 | 1 076 | −16,73 | ||||
| 2025-08-13 | 13F | Northwestern Mutual Wealth Management Co | 7 573 | 1 571,74 | 359 | 1 609,52 | ||||
| 2025-08-13 | 13F | Beacon Pointe Advisors, LLC | 0 | −100,00 | 0 | |||||
| 2025-07-18 | 13F | Truist Financial Corp | 50 665 | 0,45 | 2 403 | 0,17 | ||||
| 2025-07-15 | 13F | Mather Group, Llc. | 36 938 | −26,28 | 1 752 | −26,52 | ||||
| 2025-07-03 | 13F | Collective Family Office Llc | 139 105 | −9,89 | 6 598 | −10,16 | ||||
| 2025-07-08 | 13F | Parallel Advisors, LLC | 478 | 0,63 | 23 | 0,00 | ||||
| 2025-07-14 | 13F | UMA Financial Services, Inc. | 8 444 | 0,00 | 401 | −0,25 | ||||
| 2025-07-09 | 13F | Aurelius Family Office LLC | 64 040 | 0,30 | 3 037 | 0,00 | ||||
| 2025-07-28 | 13F | Heritage Wealth Management, Inc. /CA/ | 27 888 | 0,07 | 1 323 | −0,23 | ||||
| 2025-07-25 | 13F | PrairieView Partners, LLC | 66 227 | −8,37 | 3 | 0,00 | ||||
| 2025-07-30 | 13F | Rehmann Capital Advisory Group | 14 671 | −4,11 | 696 | −4,40 | ||||
| 2025-08-05 | 13F | C2P Capital Advisory Group, LLC d.b.a. Prosperity Capital Advisors | 0 | −100,00 | 0 | |||||
| 2025-07-14 | 13F | Foster Group, Inc. | 1 503 402 | 36,13 | 71 306 | 35,73 | ||||
| 2025-08-13 | 13F | EverSource Wealth Advisors, LLC | 9 075 | 430 | ||||||
| 2025-08-14 | 13F | Raymond James Financial Inc | 4 269 | 202 | ||||||
| 2025-08-13 | 13F | Cary Street Partners Financial Llc | 54 775 | 12,04 | 2 598 | 11,70 | ||||
| 2025-08-14 | 13F | Royal Bank Of Canada | 19 243 | −37,86 | 913 | −38,02 | ||||
| 2025-08-14 | 13F | Financial Engines Advisors L.L.C. | 35 029 | −50,00 | 1 661 | −50,15 | ||||
| 2025-07-16 | 13F | Strategic Investment Solutions, Inc. /IL | 10 909 | −62,00 | 517 | −62,12 | ||||
| 2025-07-25 | 13F | Concord Wealth Partners | 27 861 | 156,55 | 1 321 | 156,01 | ||||
| 2025-07-21 | 13F | Patriot Financial Group Insurance Agency, LLC | 51 377 | 24,18 | 2 437 | 23,78 | ||||
| 2025-08-06 | 13F | Modera Wealth Management, LLC | 69 668 | −6,83 | 3 304 | −7,11 | ||||
| 2025-08-04 | 13F | ArborFi Advisors, LLC | 14 553 | 61,20 | 690 | 60,84 | ||||
| 2025-08-14 | 13F | Comerica Bank | 13 523 | 75,37 | 641 | 75,14 | ||||
| 2025-08-13 | 13F | United Wealth Management, LLC | 107 625 | 7,93 | 5 105 | 7,61 | ||||
| 2025-07-16 | 13F | Signature Resources Capital Management, LLC | 23 448 | 3 762,93 | 1 112 | 3 871,43 | ||||
| 2025-08-04 | 13F | Assetmark, Inc | 337 654 | −16,35 | 16 015 | −16,60 | ||||
| 2025-08-06 | 13F | Csenge Advisory Group | 5 729 | 6,98 | 271 | 7,54 | ||||
| 2025-08-15 | 13F | Captrust Financial Advisors | 0 | −100,00 | 0 | |||||
| 2025-07-24 | 13F | Blair William & Co/il | 76 | −7,32 | 4 | 0,00 | ||||
| 2025-05-14 | 13F | Flow Traders U.s. Llc | 0 | −100,00 | 0 | |||||
| 2025-07-17 | 13F | Sage Rhino Capital Llc | 0 | −100,00 | 0 | |||||
| 2025-08-12 | 13F | Jpmorgan Chase & Co | 58 794 | −36,77 | 2 789 | −36,95 | ||||
| 2025-05-07 | 13F | WMS Partners, LLC | 0 | −100,00 | 0 | |||||
| 2025-07-18 | 13F | Liberty Capital Management, Inc. | 44 468 | −2,61 | 2 109 | −2,90 | ||||
| 2025-07-30 | 13F | Mills Wealth Advisors LLC | 35 995 | −29,65 | 1 707 | −29,87 | ||||
| 2025-08-14 | 13F | Colony Group, LLC | 2 090 487 | 4,42 | 99 152 | 4,12 | ||||
| 2025-08-12 | 13F | Pathstone Holdings, LLC | 793 418 | 6,00 | 37 632 | 5,70 | ||||
| 2025-08-12 | 13F | Nemes Rush Group LLC | 1 460 | 40,38 | 69 | 40,82 | ||||
| 2025-08-08 | 13F | Meridian Wealth Management, LLC | 8 493 | 403 | ||||||
| 2025-08-13 | 13F | GeoWealth Management, LLC | 862 408 | −1,89 | 40 904 | −2,18 | ||||
| 2025-07-17 | 13F | Oceanside Advisors LLC | 6 622 | 1,96 | 314 | 1,95 | ||||
| 2025-08-12 | 13F | Triune Financial Partners, LLC | 5 984 | −29,09 | 284 | −29,43 | ||||
| 2025-08-13 | 13F | Baker Avenue Asset Management, LP | 54 972 | −2,67 | 2 607 | −2,94 | ||||
| 2025-04-30 | 13F | Tru Independence Asset Management 2, Llc | 0 | −100,00 | 0 | |||||
| 2025-07-21 | 13F | West Financial Advisors, LLC | 187 521 | 2,09 | 8 894 | 1,80 | ||||
| 2025-07-02 | 13F | Helen Stephens Group, LLC | 69 632 | 51,26 | 3 303 | 50,85 | ||||
| 2025-08-12 | 13F | Global Retirement Partners, LLC | 1 147 | 19,35 | 54 | 20,00 | ||||
| 2025-07-30 | 13F | Clune & Associates, Ltd. | 5 320 | 0,00 | 252 | −0,40 | ||||
| 2025-08-01 | 13F | SwitchPoint Financial Planning, LLC | 34 125 | −10,95 | 1 619 | −11,20 | ||||
| 2025-08-05 | 13F | Beckerman Institutional, LLC | 9 057 | 2,27 | 0 | |||||
| 2025-08-06 | 13F | AE Wealth Management LLC | 138 | 0,00 | 7 | 0,00 | ||||
| 2025-07-08 | 13F | FF Advisors,LLC | 55 952 | 0,00 | 2 654 | 0,11 | ||||
| 2025-08-11 | 13F | Private Advisor Group, LLC | 43 070 | 2,24 | 2 043 | 1,95 | ||||
| 2025-07-14 | 13F | Friday Financial | 13 728 | −3,04 | 651 | −3,41 | ||||
| 2025-08-14 | 13F | Mml Investors Services, Llc | 11 698 | 0,74 | 1 | |||||
| 2025-08-14 | 13F | Aqr Capital Management Llc | 0 | −100,00 | 0 | |||||
| 2025-07-10 | 13F | White Wing Wealth Management | 22 638 | 2,51 | 1 074 | 3,27 | ||||
| 2025-08-01 | 13F | Red Lighthouse Investment Management, Llc | 6 141 | −3,70 | 291 | −4,90 | ||||
| 2025-07-28 | 13F | Verisail Partners, LLC | 44 840 | 2,50 | 2 127 | 2,21 | ||||
| 2025-07-21 | 13F | Crews Bank & Trust | 12 210 | 0,00 | 579 | −0,17 | ||||
| 2025-08-06 | 13F | Entrewealth, Llc | 123 484 | −22,39 | 5 857 | −22,63 | ||||
| 2025-07-11 | 13F | Scratch Capital Llc | 19 795 | −19,27 | 939 | −19,55 | ||||
| 2025-08-08 | 13F | RAM Investment Partners, LLC | 335 907 | −21,21 | 15 932 | −21,44 | ||||
| 2025-08-26 | 13F/A | Thrivent Financial For Lutherans | 19 756 | 1 | ||||||
| 2025-07-07 | 13F | Kings Path Partners LLC | 10 007 | 122,28 | 475 | 121,50 | ||||
| 2025-08-07 | 13F | Roberts Glore & Co Inc /il/ | 20 600 | 0,00 | 977 | −0,20 | ||||
| 2025-08-14 | 13F | DecisionPoint Financial, LLC | 9 344 | −7,47 | 443 | −7,71 | ||||
| 2025-08-11 | 13F | Aptus Capital Advisors, LLC | 7 504 | 10,05 | 356 | 9,57 | ||||
| 2025-07-22 | 13F | Vested Financial Planning, LLC | 185 768 | 1,61 | 8 811 | 1,31 | ||||
| 2025-07-21 | 13F | Life Planning Partners, Inc | 7 871 | 51,37 | 373 | 51,01 | ||||
| 2025-07-18 | 13F | PBMares Wealth Management LLC | 509 241 | 4,13 | 24 153 | 3,83 | ||||
| 2025-08-14 | 13F | GWM Advisors LLC | 28 171 | 4,58 | 1 336 | 4,29 | ||||
| 2025-07-17 | 13F | Sterling Wealth Advisors Inc | 18 086 | 3,22 | 858 | 2,88 | ||||
| 2025-08-08 | 13F | Pnc Financial Services Group, Inc. | 0 | −100,00 | 0 | |||||
| 2025-07-30 | 13F | Phillips Financial Management, Llc | 21 347 | −41,87 | 1 012 | −42,07 | ||||
| 2025-08-07 | 13F | Tillman Hartley LLC | 53 681 | 2 546 | ||||||
| 2025-07-11 | 13F | Physician Wealth Solutions Inc. | 23 538 | −7,83 | 1 116 | −8,07 | ||||
| 2025-07-31 | 13F | Buckingham Strategic Partners | 694 395 | −9,56 | 32 935 | −9,82 | ||||
| 2025-07-15 | 13F | Vestment Financial LLC | 227 907 | 11,40 | 10 811 | 10,83 | ||||
| 2025-07-15 | 13F | Oak Wealth Advisors LLC | 21 011 | 21,88 | 997 | 21,46 | ||||
| 2025-08-07 | 13F | Allworth Financial LP | 61 424 | −16,10 | 2 913 | −15,39 | ||||
| 2025-04-28 | 13F | First Horizon Advisors, Inc. | 0 | −100,00 | 0 | −100,00 | ||||
| 2025-07-11 | 13F | Seacrest Wealth Management, Llc | 4 986 | 0,00 | 236 | −0,42 | ||||
| 2025-07-18 | 13F | BCO Wealth Management LLC | 73 321 | 8,29 | 3 478 | 7,98 | ||||
| 2025-07-03 | 13F | CPA Asset Management LLC | 17 764 | −41,83 | 843 | −42,01 | ||||
| 2025-08-11 | 13F | WPWealth LLP | 21 030 | 10,19 | 997 | 9,92 | ||||
| 2025-08-18 | 13F | Geneos Wealth Management Inc. | 2 063 | 68,68 | 98 | 67,24 | ||||
| 2025-05-15 | 13F | Gts Securities Llc | 0 | −100,00 | 0 | |||||
| 2025-07-29 | 13F | Wealthstream Advisors, Inc. | 0 | −100,00 | 0 | |||||
| 2025-08-01 | 13F | Financial Counselors Inc | 0 | −100,00 | 0 | |||||
| 2025-07-22 | 13F | Yardley Wealth Management LLC | 280 206 | −5,75 | 13 | −7,14 | ||||
| 2025-08-13 | 13F | Legacy Capital Wealth Partners, LLC | 8 326 | 395 | ||||||
| 2025-08-12 | 13F | Ameritas Investment Partners, Inc. | 6 197 | 0,73 | 294 | 0,34 | ||||
| 2025-07-25 | 13F | Landmark Wealth Management, LLC | 39 142 | −23,35 | 2 | −50,00 | ||||
| 2025-07-14 | 13F | Brady Martz Wealth Solutions, LLC | 156 680 | 291,37 | 7 431 | 290,28 | ||||
| 2025-07-31 | 13F | Resonant Capital Advisors, LLC | 216 429 | −8,35 | 10 265 | −8,62 | ||||
| 2025-07-18 | 13F | Pure Financial Advisors, Inc. | 38 351 | 98,99 | 1 819 | 98,58 | ||||
| 2025-07-10 | 13F | Wealth Enhancement Advisory Services, Llc | 383 826 | −8,64 | 18 220 | −8,83 | ||||
| 2025-07-22 | 13F | Firethorn Wealth Partners, Llc | 0 | −100,00 | 0 | |||||
| 2025-08-04 | 13F | IFG Advisory, LLC | 7 423 | 1,48 | 352 | 1,44 | ||||
| 2025-08-14 | 13F | Safeguard Investment Advisory Group, LLC | 20 202 | 6,18 | 958 | 5,86 | ||||
| 2025-08-14 | 13F | Warren Averett Asset Management, LLC | 80 670 | 7,86 | 3 826 | 7,56 | ||||
| 2025-08-07 | 13F | Alpha Financial Advisors, LLC | 0 | −100,00 | 0 | |||||
| 2025-07-09 | 13F | GEM Asset Management, LLC | 67 054 | −6,72 | 3 183 | −7,12 | ||||
| 2025-07-14 | 13F | Kfg Wealth Management, Llc | 5 579 | 0,16 | 265 | 0,00 | ||||
| 2025-08-01 | 13F | JDH Wealth Management, LLC | 7 511 | −48,28 | 356 | −48,41 | ||||
| 2025-08-06 | 13F | Savant Capital, LLC | 29 827 | −9,09 | 1 415 | −9,36 | ||||
| 2025-08-11 | 13F | Brown Brothers Harriman & Co | 16 600 | 0,00 | 787 | −0,25 | ||||
| 2025-08-14 | 13F | Mercer Global Advisors Inc /adv | 24 099 | 2,82 | 1 143 | 2,60 | ||||
| 2025-07-16 | 13F | Vestia Personal Wealth Advisors | 115 657 | −4,74 | 5 486 | −5,02 | ||||
| 2025-07-17 | 13F | CogentBlue Wealth Advisors, LLC | 22 765 | −28,17 | 1 080 | −28,40 | ||||
| 2025-08-12 | 13F | Legacy Financial Group, Inc. | 76 154 | −18,06 | 3 612 | −18,32 | ||||
| 2025-07-09 | 13F | Graves-Light Private Wealth Management, Inc. | 246 063 | −2,04 | 11 671 | −2,33 | ||||
| 2025-04-15 | 13F | Simplicity Wealth,LLC | 0 | −100,00 | 0 | |||||
| 2025-07-17 | 13F | Mattern Wealth Management LLC | 553 864 | 75,64 | 26 270 | 75,13 | ||||
| 2025-08-14 | 13F | Beaird Harris Wealth Management, LLC | 821 988 | 2,36 | 38 987 | 2,05 | ||||
| 2025-08-14 | 13F | Integrated Wealth Concepts LLC | 186 045 | −5,29 | 8 824 | −5,57 | ||||
| 2025-07-17 | 13F | Vermillion Wealth Management, Inc. | 75 876 | 8,72 | 3 599 | 8,41 | ||||
| 2025-07-15 | 13F | SJS Investment Consulting Inc. | 1 940 | 11,24 | 92 | 12,20 | ||||
| 2025-07-28 | 13F | Wealthspan Partners, Llc | 0 | −100,00 | 0 | |||||
| 2025-07-22 | 13F | HFM Investment Advisors, LLC | 370 076 | 1,48 | 17 553 | 1,19 | ||||
| 2025-07-22 | 13F | David Wealth Management LLC | 172 600 | −0,28 | 8 186 | −0,57 | ||||
| 2025-08-13 | 13F | Parkworth Wealth Management, Inc. | 16 593 | 8,75 | 787 | 8,41 | ||||
| 2025-08-13 | 13F | American Investment Services, Inc. | 65 088 | −27,31 | 3 087 | −27,52 | ||||
| 2025-08-14 | 13F | Old Mission Capital Llc | 37 774 | 1 792 | ||||||
| 2025-07-15 | 13F | Hartmann Taylor Wealth Management, LLC | 37 250 | −27,60 | 1 767 | −27,83 | ||||
| 2025-07-15 | 13F | Kwmg, Llc | 7 710 | 366 | ||||||
| 2025-08-15 | 13F | Equitable Holdings, Inc. | 5 370 | 255 | ||||||
| 2025-08-12 | 13F | Hanover Advisors Inc | 5 267 | 250 | ||||||
| 2025-07-17 | 13F | Keystone Global Partners, LLC | 0 | −100,00 | 0 | |||||
| 2025-07-30 | 13F | Jackson Thornton Asset Management, Llc | 23 903 | 4,76 | 1 134 | 5,49 | ||||
| 2025-08-08 | 13F | Creative Planning | 10 478 | −4,62 | 497 | −4,98 | ||||
| 2025-08-14 | 13F | Stage Harbor Financial, Llc | 0 | −100,00 | 0 | |||||
| 2025-08-14 | 13F | Betterment LLC | 22 393 | 91,39 | 1 | |||||
| 2025-08-12 | 13F | BWM Planning, LLC | 5 061 | −26,15 | 240 | −26,38 | ||||
| 2025-07-31 | 13F | Glass Jacobson Investment Advisors llc | 8 840 | 3,50 | 419 | 2,70 | ||||
| 2025-05-14 | 13F | Rockefeller Capital Management L.P. | 0 | −100,00 | 0 | |||||
| 2025-07-23 | 13F | Wheelhouse Advisory Group LLC | 119 012 | 24,44 | 5 645 | 24,07 | ||||
| 2025-08-14 | 13F | Investmark Advisory Group LLC | 22 084 | 0,00 | 1 047 | −0,29 | ||||
| 2025-07-01 | 13F | Confluence Investment Management Llc | 167 895 | −3,08 | 7 963 | −3,36 | ||||
| 2025-07-31 | 13F | LJI Wealth Management, LLC | 9 043 | 2,40 | 429 | 1,90 | ||||
| 2025-07-15 | 13F | Evanson Asset Management, LLC | 81 687 | −3,68 | 3 874 | −3,97 | ||||
| 2025-08-08 | 13F | Cetera Investment Advisers | 8 076 | 383 | ||||||
| 2025-07-17 | 13F | HB Wealth Management, LLC | 66 155 | 187,71 | 3 138 | 187,01 | ||||
| 2025-08-01 | 13F | Anson Capital, Inc. | 7 935 | 38,36 | 376 | 38,24 | ||||
| 2025-07-09 | 13F | Dynamic Advisor Solutions LLC | 10 033 | −16,06 | 476 | −16,37 | ||||
| 2025-07-16 | 13F | Meredith Wealth Planning | 7 775 | 19,80 | 369 | 19,48 | ||||
| 2025-07-28 | NP | SPMFX - Symmetry Panoramic Municipal Fixed Income Fund Class I Shares | 148 681 | −1,54 | 7 034 | −3,39 | ||||
| 2025-07-17 | 13F | DiNuzzo Private Wealth, Inc. | 70 628 | −1,01 | 3 350 | −1,33 | ||||
| 2025-07-29 | 13F | Grunden Financial Advisory, Inc. | 10 993 | 0,74 | 521 | 0,39 | ||||
| 2025-07-10 | 13F | Pacific Asset Management, LLC | 11 168 | 27,43 | 530 | 27,16 | ||||
| 2025-08-14 | 13F | Stifel Financial Corp | 79 580 | −2,07 | 3 774 | −2,35 | ||||
| 2025-08-12 | 13F | Martin Worley Group | 37 726 | 293,80 | 1 789 | 293,19 | ||||
| 2025-07-16 | 13F | Plancorp, LLC | 164 192 | 158,62 | 7 788 | 157,85 | ||||
| 2025-08-14 | 13F | Sei Investments Co | 22 300 | 1 058 | ||||||
| 2025-07-21 | 13F | Verus Financial Partners, Inc. | 94 002 | 10,87 | 4 463 | 11,99 | ||||
| 2025-07-21 | 13F | Keb Asset Management, Llc | 9 168 | 41,81 | 435 | 41,37 | ||||
| 2025-07-31 | 13F | Warburton Capital Management, LLC | 22 204 | 131,05 | 1 | |||||
| 2025-08-08 | 13F | Capital Investment Advisory Services, LLC | 48 | 0,00 | 2 | 0,00 | ||||
| 2025-07-24 | 13F | IFP Advisors, Inc | 10 631 | 1 214,09 | 504 | 1 226,32 | ||||
| 2025-08-07 | 13F | Compass Financial Group, Inc. | 176 441 | −0,88 | 8 369 | −1,17 | ||||
| 2025-07-18 | 13F | Forza Wealth Management, LLC | 90 000 | 4 269 | ||||||
| 2025-07-25 | 13F | Concord Asset Management, LLC/VA | 27 861 | 1 321 | ||||||
| 2025-08-14 | 13F | Note Advisors, LLC | 35 837 | 89,04 | 1 700 | 88,57 | ||||
| 2025-08-07 | 13F | Midwest Trust Co | 7 264 | 345 | ||||||
| 2025-08-05 | 13F | Sigma Planning Corp | 0 | −100,00 | 0 | |||||
| 2025-08-14 | 13F | Acorn Wealth Advisors, LLC | 0 | −100,00 | 0 | |||||
| 2025-08-07 | 13F | Timonier Family Office, LTD. | 47 474 | −22,71 | 2 252 | −22,94 | ||||
| 2025-07-25 | 13F | One Degree Advisors Inc | 22 814 | 1,87 | 1 | 0,00 | ||||
| 2025-08-11 | 13F | Copperleaf Capital, LLC | 8 187 | −3,25 | 388 | −3,48 | ||||
| 2025-08-12 | 13F | Proequities, Inc. | 0 | 0 | ||||||
| 2025-07-30 | 13F | Paul Damon & Associates, Inc. | 31 047 | 2,21 | 1 473 | 1,94 | ||||
| 2025-07-16 | 13F | Five Oceans Advisors | 9 620 | 0,00 | 456 | −0,22 | ||||
| 2025-04-10 | 13F | Breakwater Capital Group | 0 | −100,00 | 0 | |||||
| 2025-07-24 | 13F | Vantage Point Financial LLC | 5 945 | 0,46 | 282 | 0,00 | ||||
| 2025-07-09 | 13F | Seaside Wealth Management, Inc. | 6 252 | 19,34 | 297 | 18,88 | ||||
| 2025-07-23 | 13F | Elevate Wealth Advisory, Inc | 35 968 | 4,29 | 1 706 | 3,96 | ||||
| 2025-07-23 | 13F | Sax Wealth Advisors, Llc | 41 463 | −46,54 | 1 967 | −46,71 | ||||
| 2025-08-07 | 13F | Verus Capital Partners, Llc | 4 497 | −54,77 | 213 | −54,87 | ||||
| 2025-08-14 | 13F | Main Street Financial Solutions, LLC | 13 501 | −32,96 | 640 | −33,12 | ||||
| 2025-08-13 | 13F | RW Investment Management LLC | 76 239 | −7,29 | 3 616 | −7,57 | ||||
| 2025-08-15 | 13F | Morgan Stanley | 8 789 | −0,53 | 417 | −0,95 | ||||
| 2025-05-15 | 13F | Two Sigma Securities, Llc | 0 | −100,00 | 0 | −100,00 | ||||
| 2025-08-14 | 13F | Sterling Wealth Management, Inc. | 12 554 | 113,87 | 595 | 112,50 | ||||
| 2025-07-17 | 13F | Dopkins Wealth Management, Llc | 119 085 | 53,90 | 5 648 | 53,48 | ||||
| 2025-07-25 | 13F | Cwm, Llc | 842 | 0,00 | 0 | |||||
| 2025-09-04 | 13F/A | Advisor Group Holdings, Inc. | 133 499 | 1,77 | 6 336 | 1,52 | ||||
| 2025-07-29 | 13F | Disciplined Investments, LLC | 15 333 | 0,00 | 727 | −0,27 | ||||
| 2025-08-08 | 13F | Austin Wealth Management, LLC | 378 263 | −41,12 | 17 884 | −40,82 | ||||
| 2025-08-05 | 13F | Integrity Wealth Solutions LLC | 19 366 | −25,60 | 919 | −25,85 | ||||
| 2025-07-23 | 13F | SpringVest Wealth Management LLC | 11 374 | 0,00 | 539 | −0,37 | ||||
| 2025-07-31 | 13F | Cambridge Investment Research Advisors, Inc. | 14 538 | 18,24 | 1 | |||||
| 2025-08-06 | 13F | New Dimensions Wealth Management, LLC | 17 877 | −1,56 | 848 | −1,85 |