Grundläggande statistik
| Institutionella ägare | 327 total, 327 long only, 0 short only, 0 long/short - change of 4,78% MRQ |
| Genomsnittlig portföljallokering | 0.5180 % - change of 4,41% MRQ |
| Institutionella aktier (lång) | 102 892 792 (ex 13D/G) - change of 6,50MM shares 6,74% MRQ |
| Institutionellt värde (lång) | $ 1 964 466 USD ($1000) |
Institutionellt ägande och aktieägare
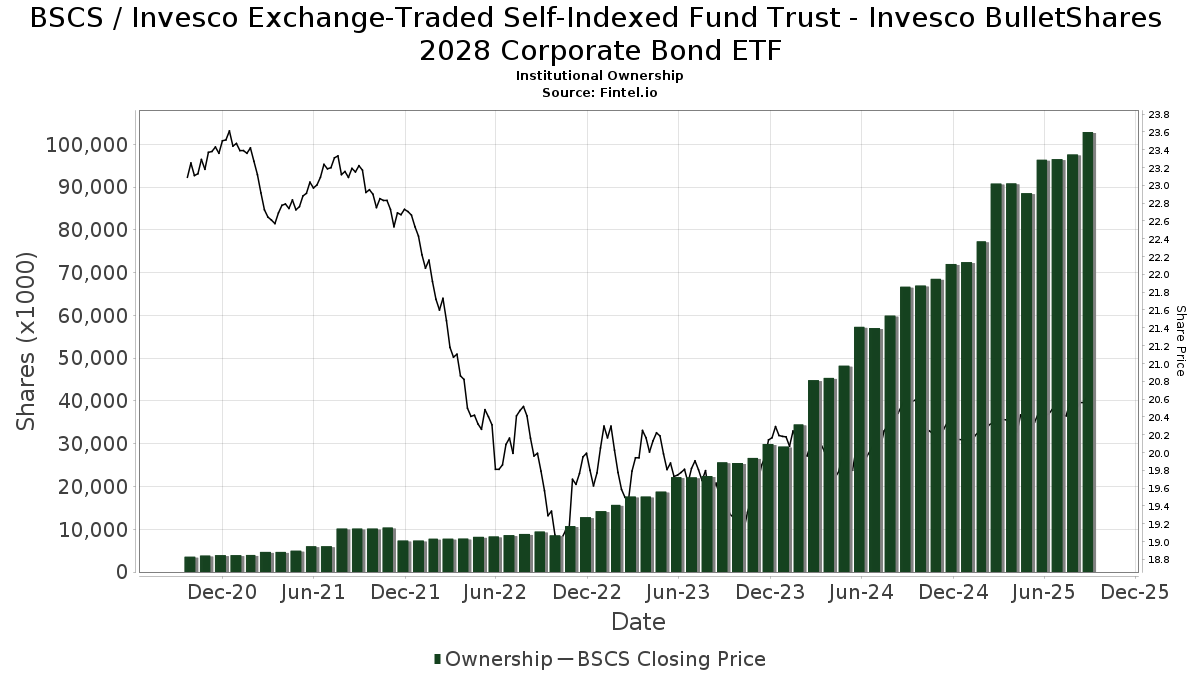
Invesco Exchange-Traded Self-Indexed Fund Trust - Invesco BulletShares 2028 Corporate Bond ETF (US:BSCS) har 327 Institutionella ägare och aktieägare som har lämnat in 13D/G- eller 13F-formulär till Securities Exchange Commission (SEC). Dessa institut innehar totalt 102,892,792 aktier. Största aktieägare inkluderar Morgan Stanley, Wells Fargo & Company/mn, Raymond James Financial Inc, Lido Advisors, LLC, LPL Financial LLC, TruWealth Advisors, LLC, Bank Of America Corp /de/, Laurel Wealth Advisors LLC, Hartland & Co., LLC, and UBS Group AG .
Invesco Exchange-Traded Self-Indexed Fund Trust - Invesco BulletShares 2028 Corporate Bond ETF (NasdaqGM:BSCS) Institutionell ägarstruktur visar institutioners och fonders nuvarande positioner i företaget, samt de senaste förändringarna i positionernas storlek. Större aktieägare kan vara enskilda investerare, fonder, hedgefonder eller institutioner. Bilaga 13D visar att investeraren äger (eller ägde) mer än 5% av företaget och avser (eller avsåg) att aktivt eftersträva en förändring av affärsstrategin. Schedule 13G indikerar en passiv investering på över 5%.
The share price as of September 12, 2025 is 20,63 / share. Previously, on September 16, 2024, the share price was 20,66 / share. This represents a decline of 0,15% over that period.
Fondsentimentets poäng
Fondsentimentet poängen(fka Ägarackumulation-poäng) visar vilka aktier som är mest köpta av fonder. Det är resultatet av en sofistikerad kvantitativ flerfaktormodell som identifierar företag med de högsta nivåerna av institutionell ackumulering. Poängsättningsmodellen använder en kombination av den totala ökningen av redovisade ägare, förändringarna i portföljallokeringarna för dessa ägare och andra mått. Siffran sträcker sig från 0 till 100, där högre siffror indikerar en högre nivå av ackumulering i förhållande till sina konkurrenter, och 50 är genomsnittet.
Uppdateringsfrekvens: Dagligen
Se Ownership Explorer, som innehåller en lista över de högst rankade företagen.
Institutionell sälj/köp-kvot
Förutom att rapportera vanliga eget kapital- och skuldemissioner måste institutioner med mer än 100MM tillgångar under förvaltning också avslöja sina innehav av sälj- och köpoptioner. Eftersom säljoptioner i allmänhet indikerar ett negativt sentiment och köpoptioner indikerar ett positivt sentiment, kan vi få en uppfattning om det övergripande institutionella sentimentet genom att plotta förhållandet mellan säljoptioner och köpoptioner. Diagrammet till höger visar det historiska förhållandet mellan sälj- och köpoptioner för detta instrument.
Genom att använda sälj/köp-kvoten som en indikator på aktieägarnas sentiment undviker man en av de största bristerna med att använda det totala institutionella ägandet, nämligen att en betydande del av de förvaltade tillgångarna investeras passivt för att följa index. Passivt förvaltade fonder köper vanligtvis inte optioner, så indikatorn för sälj/köp-kvoten ger en bättre bild av stämningen i aktivt förvaltade fonder.
13F- och NPORT-arkiveringar
Detaljer om 13F-arkiveringar är gratis. Detaljer om NP-arkiveringar kräver ett premiummedlemskap. Gröna rader indikerar nya positioner. Röda rader indikerar stängda positioner. Klicka på länk symbolen för att se hela transaktionshistoriken.
Uppgradera
för att låsa upp premiumdata och exportera till Excel ![]() .
.
| Fil Datum | Källa | Investerare | Typ | Genomsnittligt pris (beräknat) |
Aktier | Δ Aktier (%) |
Rapporterat värde (1000 USD) |
Δ Värde (%) |
Portföljallokering (%) |
|
|---|---|---|---|---|---|---|---|---|---|---|
| 2025-07-14 | 13F | CRA Financial Services, LLC | 101 234 | 4,13 | 2 074 | 4,85 | ||||
| 2025-07-14 | 13F | Proathlete Wealth Management Llc | 761 | 16 | ||||||
| 2025-08-05 | 13F | Pacific Wealth Strategies Group, Inc. | 40 399 | 825 | ||||||
| 2025-07-23 | 13F | Opulen Financial Group LLC | 116 587 | 5,67 | 2 389 | 6,37 | ||||
| 2025-07-22 | 13F | Berkshire Money Management, Inc. | 20 159 | 0,00 | 413 | 0,73 | ||||
| 2025-07-29 | 13F | Tradewinds Capital Management, LLC | 88 | 0,00 | 2 | 0,00 | ||||
| 2025-08-14 | 13F | Financial Advisory Service, Inc. | 5 303 | 1,14 | 109 | 1,89 | ||||
| 2025-08-07 | 13F | Davis R M Inc | 746 650 | 26,27 | 15 299 | 27,14 | ||||
| 2025-04-17 | 13F | Rebalance, Llc | 0 | −100,00 | 0 | |||||
| 2025-07-11 | 13F | Farther Finance Advisors, LLC | 9 808 | 1 861,60 | 201 | 1 900,00 | ||||
| 2025-07-09 | 13F | Central Valley Advisors, Llc | 465 429 | 6,25 | 9 537 | 6,98 | ||||
| 2025-07-15 | 13F | Tenon Financial LLC | 23 205 | 86,75 | 475 | 88,49 | ||||
| 2025-07-28 | 13F | Harbour Investments, Inc. | 55 208 | 0,53 | 1 131 | 1,25 | ||||
| 2025-08-15 | 13F | Kestra Advisory Services, LLC | 91 190 | 21,66 | 1 868 | 22,49 | ||||
| 2025-07-18 | 13F | Ledgewood Wealth Advisors, LLC | 401 982 | 13,93 | 8 237 | 14,72 | ||||
| 2025-08-11 | 13F | Summit Wealth Partners, LLC | 12 220 | 0,22 | 250 | 0,81 | ||||
| 2025-08-06 | 13F | Rialto Wealth Management, LLC | 8 980 | 0,00 | 184 | 1,10 | ||||
| 2025-08-07 | 13F | Kestra Private Wealth Services, Llc | 81 953 | 57,85 | 1 679 | 59,00 | ||||
| 2025-08-14 | 13F | Integrated Wealth Concepts LLC | 191 291 | −10,43 | 3 920 | −9,83 | ||||
| 2025-08-12 | 13F | Proequities, Inc. | 0 | 0 | ||||||
| 2025-08-12 | 13F | Franklin Resources Inc | 37 961 | 0,00 | 778 | 0,65 | ||||
| 2025-08-14 | 13F | Arete Wealth Advisors, LLC | 26 242 | −1,02 | 1 | |||||
| 2025-08-13 | 13F | VestGen Advisors, LLC | 264 053 | 13,30 | 5 424 | 14,36 | ||||
| 2025-07-22 | 13F | Wealthcare Advisory Partners LLC | 20 049 | 411 | ||||||
| 2025-07-25 | 13F | Community Bank, N.A. | 1 837 | 0,00 | 38 | 0,00 | ||||
| 2025-08-01 | 13F | Redmond Asset Management, LLC | 53 675 | 6,98 | 1 100 | 7,64 | ||||
| 2025-08-12 | 13F | Allen Capital Group, LLC | 30 218 | 7,74 | 619 | 8,60 | ||||
| 2025-08-12 | 13F | Fca Corp /tx | 36 673 | 751 | ||||||
| 2025-07-21 | 13F | Ameritas Advisory Services, LLC | 3 303 | 68 | ||||||
| 2025-07-22 | 13F | Marietta Wealth Management, LLC | 310 401 | 0,93 | 6 360 | 1,63 | ||||
| 2025-08-14 | 13F | Wiley Bros.-aintree Capital, Llc | 224 087 | 84,51 | 4 592 | 86,85 | ||||
| 2025-04-23 | 13F | Field & Main Bank | 0 | −100,00 | 0 | |||||
| 2025-08-08 | 13F | Cetera Investment Advisers | 147 848 | 60,82 | 3 029 | 61,98 | ||||
| 2025-08-14 | 13F | Vista Investment Management | 383 854 | −4,84 | 7 865 | −4,18 | ||||
| 2025-08-11 | 13F | Aptus Capital Advisors, LLC | 205 329 | −89,11 | 4 207 | −89,04 | ||||
| 2025-07-29 | 13F | Manchester Financial Inc | 973 575 | 510,53 | 19 949 | 514,73 | ||||
| 2025-08-11 | 13F | Cordatus Wealth Management LLC | 30 225 | 13,21 | 1 | |||||
| 2025-08-12 | 13F | Kohmann Bosshard Financial Services, LLC | 73 272 | 0,09 | 1 501 | 0,81 | ||||
| 2025-07-01 | 13F | Harbor Investment Advisory, Llc | 440 | 0,00 | 9 | 12,50 | ||||
| 2025-08-08 | 13F | Financial Life Planners | 56 627 | 3,51 | 1 160 | 4,22 | ||||
| 2025-07-29 | 13F | Wingate Wealth Advisors, Inc. | 75 635 | 0,81 | 1 550 | 1,51 | ||||
| 2025-08-01 | 13F | Envestnet Asset Management Inc | 808 689 | 3,10 | 16 570 | 3,82 | ||||
| 2025-08-05 | 13F | Ellevest, Inc. | 111 474 | 1,50 | 2 284 | 2,24 | ||||
| 2025-08-11 | 13F | HighTower Advisors, LLC | 178 477 | 4,48 | 3 657 | 5,18 | ||||
| 2025-07-23 | 13F | Meitav Dash Investments Ltd | 20 219 | 31,05 | 414 | 32,27 | ||||
| 2025-09-04 | 13F/A | Advisor Group Holdings, Inc. | 985 783 | 6,69 | 20 202 | 7,42 | ||||
| 2025-05-12 | 13F | Independent Advisor Alliance | 0 | −100,00 | 0 | |||||
| 2025-08-14 | 13F | Warren Averett Asset Management, LLC | 20 235 | 11,35 | 415 | 12,20 | ||||
| 2025-07-23 | 13F | Roundview Capital LLC | 80 394 | 0,00 | 1 647 | 0,67 | ||||
| 2025-08-11 | 13F | Landaas & Co /wi /adv | 24 763 | 0,00 | 507 | 0,60 | ||||
| 2025-04-29 | 13F | Resources Investment Advisors, LLC. | 0 | −100,00 | 0 | −100,00 | ||||
| 2025-05-01 | 13F | Country Club Bank /gfn | 0 | −100,00 | 0 | −100,00 | ||||
| 2025-05-14 | 13F | Quartz Partners, LLC | 0 | −100,00 | 0 | |||||
| 2025-07-30 | 13F | Fusion Family Wealth LLC | 1 627 839 | 5,48 | 33 354 | 6,20 | ||||
| 2025-08-11 | 13F | Shufro Rose & Co Llc | 273 921 | −0,08 | 5 574 | −0,07 | ||||
| 2025-08-12 | 13F | O'shaughnessy Asset Management, Llc | 1 718 | 35 | ||||||
| 2025-07-22 | 13F | Siligmueller & Norvid Wealth Advisors LLC | 914 990 | 19,56 | 18 721 | 20,21 | ||||
| 2025-08-01 | 13F | Oarsman Capital, Inc. | 17 862 | 0,00 | 366 | 0,55 | ||||
| 2025-07-15 | 13F | Accurate Wealth Management, LLC | 35 564 | 728 | ||||||
| 2025-07-17 | 13F | Janney Montgomery Scott LLC | 408 850 | −11,89 | 8 | −11,11 | ||||
| 2025-07-28 | 13F | Tlwm | 1 356 426 | 0,07 | 27 793 | 0,76 | ||||
| 2025-07-24 | 13F | Eastern Bank | 28 201 | −76,15 | 578 | −76,02 | ||||
| 2025-05-09 | 13F | Delta Financial Group, Inc. | 25 664 | 6,77 | 1 | |||||
| 2025-07-15 | 13F | Marquette Asset Management, LLC | 3 840 | 0,00 | 79 | 0,00 | ||||
| 2025-08-14 | 13F | Ameriprise Financial Inc | 641 989 | 37,14 | 13 155 | 38,00 | ||||
| 2025-08-13 | 13F | Northwestern Mutual Wealth Management Co | 145 270 | 11,23 | 2 977 | 12,01 | ||||
| 2025-07-08 | 13F | Everpar Advisors Llc | 26 694 | 67,06 | 547 | 68,00 | ||||
| 2025-08-08 | 13F | Pnc Financial Services Group, Inc. | 3 294 | 0,00 | 67 | 0,00 | ||||
| 2025-07-17 | 13F | HB Wealth Management, LLC | 29 483 | 3,13 | 604 | 3,96 | ||||
| 2025-07-17 | 13F | XY Planning Network, Inc. | 24 792 | 508 | ||||||
| 2025-08-14 | 13F | Atomi Financial Group, Inc. | 19 353 | 40,23 | 397 | 41,43 | ||||
| 2025-08-08 | 13F | Smithfield Trust Co | 1 030 | −7,04 | 0 | |||||
| 2025-08-08 | 13F | Creative Planning | 115 255 | −6,88 | 2 362 | −6,24 | ||||
| 2025-07-30 | 13F/A | Old Point Trust & Financial Services N A | 46 622 | 19,86 | 955 | 20,73 | ||||
| 2025-07-15 | 13F | McCarthy & Cox | 198 214 | 6,64 | 4 061 | 7,38 | ||||
| 2025-07-23 | 13F | ETF Portfolio Partners, Inc. | 9 914 | 0,00 | 203 | 1,00 | ||||
| 2025-07-29 | 13F | Semitam Bonam Llc | 74 630 | 1 529 | ||||||
| 2025-07-15 | 13F | First City Capital Management, Inc. | 41 450 | −1,31 | 849 | −0,59 | ||||
| 2025-08-05 | 13F | Hills Bank & Trust Co | 2 289 871 | 0,13 | 46 919 | 0,82 | ||||
| 2025-07-09 | 13F | Dynamic Advisor Solutions LLC | 28 435 | 45,33 | 583 | 46,23 | ||||
| 2025-08-12 | 13F | Jpmorgan Chase & Co | 514 | −95,74 | 11 | −95,92 | ||||
| 2025-08-08 | 13F | IMA Wealth, Inc. | 13 891 | −25,84 | 285 | −25,46 | ||||
| 2025-07-31 | 13F | Darden Wealth Group Inc | 10 000 | 205 | ||||||
| 2025-08-12 | 13F | J.w. Cole Advisors, Inc. | 103 997 | 4,21 | 2 131 | 4,93 | ||||
| 2025-07-16 | 13F | ORG Partners LLC | 1 688 | 0,00 | 35 | 0,00 | ||||
| 2025-07-10 | 13F | Strathmore Capital Advisors, Inc. | 48 315 | 989 | ||||||
| 2025-07-08 | 13F | Webster Bank, N. A. | 5 000 | 0,00 | 102 | 0,99 | ||||
| 2025-07-11 | 13F | Matthew Goff Investment Advisor, LLC | 96 132 | −2,50 | 1 970 | −1,84 | ||||
| 2025-07-18 | 13F | Foundry Financial Group, Inc. | 9 995 | 0,00 | 205 | 0,49 | ||||
| 2025-07-30 | 13F | Nottingham Advisors, Inc. | 94 532 | −0,88 | 1 937 | −0,21 | ||||
| 2025-07-16 | 13F | Tassel Capital Management, Inc. | 16 045 | 1,15 | 329 | 1,86 | ||||
| 2025-07-31 | 13F | Topsail Wealth Management, LLC | 1 330 | 0,00 | 27 | 0,00 | ||||
| 2025-08-13 | 13F | Congress Wealth Management LLC / DE / | 51 786 | 0,84 | 1 061 | 1,73 | ||||
| 2025-08-13 | 13F | Vermillion & White Wealth Management Group, LLC | 3 103 | 0,00 | 64 | 0,00 | ||||
| 2025-08-13 | 13F | Farnam Financial LLC | 175 931 | 20,66 | 3 605 | 21,47 | ||||
| 2025-07-22 | 13F | Yoder Wealth Management, Inc. | 13 450 | 0,00 | 276 | 0,73 | ||||
| 2025-07-21 | 13F | Empirical Financial Services, LLC d.b.a. Empirical Wealth Management | 163 331 | 3,81 | 3 347 | 4,53 | ||||
| 2025-08-06 | 13F | Prospera Financial Services Inc | 140 336 | 5,04 | 2 876 | 5,78 | ||||
| 2025-08-14 | 13F | LaSalle St. Investment Advisors, LLC | 14 587 | 0,00 | 0 | |||||
| 2025-07-25 | 13F | Atria Wealth Solutions, Inc. | 20 833 | −28,88 | 427 | −28,52 | ||||
| 2025-07-28 | 13F | Cypress Wealth Services, LLC | 44 571 | −1,47 | 913 | −0,76 | ||||
| 2025-08-05 | 13F | American Institute for Advanced Investment Management, LLP | 31 785 | 6,68 | 651 | 7,43 | ||||
| 2025-08-14 | 13F | Comerica Bank | 36 324 | −41,84 | 744 | −41,42 | ||||
| 2025-07-16 | 13F | West Branch Capital LLC | 1 057 | 0,00 | 22 | 0,00 | ||||
| 2025-07-23 | 13F | True Vision MN LLC | 32 350 | −3,70 | 663 | −3,07 | ||||
| 2025-07-10 | 13F | Redhawk Wealth Advisors, Inc. | 19 692 | −3,10 | 403 | −2,42 | ||||
| 2025-08-13 | 13F | Capital Analysts, Inc. | 53 074 | −0,25 | 1 | 0,00 | ||||
| 2025-07-08 | 13F | Parisi Gray Wealth Management | 107 992 | −2,99 | 2 213 | −2,34 | ||||
| 2025-07-18 | 13F | SMI Advisory Services, LLC | 0 | −100,00 | 0 | |||||
| 2025-07-07 | 13F | Horizons Wealth Management | 186 867 | −0,62 | 3 829 | 0,05 | ||||
| 2025-08-14 | 13F | UBS Group AG | 2 654 851 | 13,97 | 54 398 | 14,75 | ||||
| 2025-07-25 | 13F | Concurrent Investment Advisors, LLC | 14 587 | −1,66 | 299 | −1,00 | ||||
| 2025-07-23 | 13F | BankPlus Trust Department | 7 786 | 1 630,22 | 160 | 1 666,67 | ||||
| 2025-08-05 | 13F | Summit Investment Advisory Services, LLC | 28 818 | 590 | ||||||
| 2025-08-06 | 13F | Atlantic Union Bankshares Corp | 34 399 | 13,45 | 705 | 14,10 | ||||
| 2025-08-15 | 13F | Equitable Holdings, Inc. | 141 217 | −40,08 | 2 894 | −39,68 | ||||
| 2025-08-06 | 13F | SOUTH STATE Corp | 40 | 1 | ||||||
| 2025-07-24 | 13F | IFP Advisors, Inc | 61 551 | 10,31 | 1 261 | 11,10 | ||||
| 2025-07-29 | 13F | Latitude Advisors, LLC | 0 | −100,00 | 0 | |||||
| 2025-08-08 | 13F | Larson Financial Group LLC | 19 870 | −0,72 | 407 | 0,00 | ||||
| 2025-08-11 | 13F | Principal Securities, Inc. | 18 925 | 35,05 | 388 | 37,23 | ||||
| 2025-07-17 | 13F | Nelson, Van Denburg & Campbell Wealth Management Group, LLC | 132 615 | 11,29 | 2 717 | 12,09 | ||||
| 2025-08-14 | 13F | Smartleaf Asset Management LLC | 0 | −100,00 | 0 | −100,00 | ||||
| 2025-08-12 | 13F | Heritage Trust Co | 63 086 | 26,59 | 1 293 | 27,42 | ||||
| 2025-07-30 | 13F | Cookson Peirce & Co Inc | 488 989 | 0,81 | 10 019 | 1,51 | ||||
| 2025-04-15 | 13F | Members Wealth Llc | 20 506 | 2,53 | 417 | 3,47 | ||||
| 2025-07-23 | 13F | Ironwood Financial, llc | 502 400 | 0,00 | 10 224 | 0,00 | ||||
| 2025-08-01 | 13F | Koss-Olinger Consulting, LLC | 33 989 | −11,50 | 696 | −11,00 | ||||
| 2025-08-18 | 13F | Tyler-Stone Wealth Management | 29 000 | 74,70 | 594 | 76,26 | ||||
| 2025-08-04 | 13F | AlphaStar Capital Management, LLC | 121 906 | 14,68 | 2 498 | 15,44 | ||||
| 2025-08-12 | 13F | NFP Retirement, Inc. | 19 881 | 0,00 | 407 | 0,74 | ||||
| 2025-07-08 | 13F | Ballew Advisors, Inc | 27 233 | 0,00 | 557 | 1,46 | ||||
| 2025-07-22 | 13F | Kickstand Ventures, Llc. | 11 048 | −10,53 | 226 | −9,96 | ||||
| 2025-08-13 | 13F | Brown Advisory Inc | 31 524 | 0,96 | 646 | 1,57 | ||||
| 2025-07-22 | 13F | Duncan Williams Asset Management, LLC | 11 048 | 226 | ||||||
| 2025-08-14 | 13F | GWM Advisors LLC | 601 372 | 13,64 | 12 322 | 14,42 | ||||
| 2025-07-15 | 13F | SJS Investment Consulting Inc. | 3 190 | 0,00 | 65 | 1,56 | ||||
| 2025-07-29 | 13F | Stephens Inc /ar/ | 114 227 | 4,59 | 2 341 | 5,31 | ||||
| 2025-08-04 | 13F | ArborFi Advisors, LLC | 65 415 | 2,41 | 1 340 | 3,16 | ||||
| 2025-08-12 | 13F | Tableaux Llc | 133 861 | 4 760 | ||||||
| 2025-07-08 | 13F | Nbc Securities, Inc. | 635 | 0 | ||||||
| 2025-08-12 | 13F | Ameritas Investment Partners, Inc. | 1 774 | −15,08 | 36 | −14,29 | ||||
| 2025-08-07 | 13F | Hennion & Walsh Asset Management, Inc. | 117 637 | 3,91 | 2 410 | 4,65 | ||||
| 2025-08-08 | 13F | Advisors Capital Management, LLC | 499 685 | 0,44 | 10 239 | 1,13 | ||||
| 2025-08-06 | 13F | Summit Investment Advisors, Inc. | 29 270 | 17,75 | 601 | 18,58 | ||||
| 2025-08-13 | 13F | Jones Financial Companies Lllp | 298 634 | 22,71 | 6 110 | 23,43 | ||||
| 2025-08-11 | 13F | Nations Financial Group Inc, /ia/ /adv | 25 194 | −2,01 | 516 | −1,34 | ||||
| 2025-08-01 | 13F | Gwn Securities Inc. | 0 | −100,00 | 0 | |||||
| 2025-08-25 | 13F | Silverlake Wealth Management Llc | 101 207 | 1,74 | 2 074 | 2,42 | ||||
| 2025-07-18 | 13F | Trilogy Capital Inc. | 213 810 | −4,23 | 4 381 | −3,59 | ||||
| 2025-08-13 | 13F | River Wealth Advisors LLC | 68 914 | 15,29 | 1 412 | 16,12 | ||||
| 2025-08-13 | 13F | Baird Financial Group, Inc. | 760 675 | 6,83 | 15 586 | 7,57 | ||||
| 2025-07-31 | 13F | Insight Wealth Partners, LLC | 45 829 | 4,50 | 939 | 5,27 | ||||
| 2025-07-25 | 13F | Cwm, Llc | 391 607 | 5,17 | 8 | 14,29 | ||||
| 2025-08-19 | 13F | Asset Dedication, LLC | 567 164 | 4,14 | 11 621 | 4,86 | ||||
| 2025-08-11 | 13F | Private Advisor Group, LLC | 288 693 | −17,21 | 5 915 | −16,64 | ||||
| 2025-07-23 | 13F | Sax Wealth Advisors, Llc | 35 382 | 37,60 | 725 | 38,43 | ||||
| 2025-07-29 | 13F | Private Trust Co Na | 11 460 | 0,00 | 235 | 0,43 | ||||
| 2025-03-25 | 13F | Higgins & Schmidt Wealth Strategies LLC | 0 | −100,00 | 0 | −100,00 | ||||
| 2025-07-31 | 13F | Carnegie Capital Asset Management, LLC | 272 871 | 3,51 | 5 591 | 4,86 | ||||
| 2025-08-27 | 13F/A | Brinker Capital Investments, LLC | 130 475 | 8,60 | 2 673 | 9,33 | ||||
| 2025-07-17 | 13F | Sound Income Strategies, LLC | 174 | −71,57 | 4 | −75,00 | ||||
| 2025-07-29 | 13F | Novare Capital Management Llc | 144 542 | 0,31 | 2 962 | 0,99 | ||||
| 2025-07-22 | 13F | Comprehensive Financial Consultants Institutional, Inc. | 28 131 | 0,00 | 576 | 0,70 | ||||
| 2025-08-08 | 13F | Sawgrass Asset Management Llc | 60 533 | −6,38 | 1 240 | −5,70 | ||||
| 2025-07-24 | 13F | Coordinated Financial Services, Inc. | 38 492 | 55,21 | 789 | 57,92 | ||||
| 2025-08-05 | 13F | Blue Barn Wealth, LLC | 90 562 | 2,68 | 1 856 | 3,40 | ||||
| 2025-07-17 | 13F/A | Capital Investment Advisors, LLC | 29 759 | −2,44 | 610 | −1,77 | ||||
| 2025-04-17 | 13F | Robertson Stephens Wealth Management, LLC | 0 | −100,00 | 0 | |||||
| 2025-07-17 | 13F | Independence Bank of Kentucky | 50 358 | 2,65 | 1 032 | 3,31 | ||||
| 2025-07-25 | 13F | Bill Few Associates, Inc. | 10 480 | 0,00 | 215 | 0,47 | ||||
| 2025-08-04 | 13F | Arkadios Wealth Advisors | 38 789 | 14,91 | 795 | 15,74 | ||||
| 2025-07-15 | 13F | Legacy Financial Group LLC | 751 174 | −7,41 | 15 392 | −6,78 | ||||
| 2025-07-15 | 13F | Unified Investment Management | 26 740 | 0,53 | 548 | 1,11 | ||||
| 2025-05-12 | 13F | Aveo Capital Partners, LLC | 0 | −100,00 | 0 | |||||
| 2025-08-08 | 13F | Avantax Advisory Services, Inc. | 144 683 | −7,03 | 2 965 | −6,38 | ||||
| 2025-05-16 | 13F | Coordinated Financial Services, Inc./CO | 34 115 | 41,73 | 694 | 44,58 | ||||
| 2025-08-12 | 13F | Laurel Wealth Advisors LLC | 2 872 278 | 2 281,48 | 140 | −94,30 | ||||
| 2025-07-14 | 13F | Oliver Luxxe Assets LLC | 154 019 | −5,98 | 3 156 | −5,34 | ||||
| 2025-07-09 | 13F | Sarver Vrooman Wealth Advisors | 3 092 | 0,00 | 63 | 1,61 | ||||
| 2025-08-07 | 13F | Gs Investments, Inc. | 75 | 0,00 | 2 | 0,00 | ||||
| 2025-05-19 | 13F | Ubs Asset Management Americas Inc | 0 | −100,00 | 0 | |||||
| 2025-07-31 | 13F | Optimum Investment Advisors | 2 900 | 59 | ||||||
| 2025-08-12 | 13F | SRS Capital Advisors, Inc. | 1 430 | 29 | ||||||
| 2025-08-01 | 13F | Motley Fool Wealth Management, LLC | 1 221 193 | −24,17 | 25 022 | −23,64 | ||||
| 2025-08-13 | 13F | Lido Advisors, LLC | 5 274 692 | 4,49 | 108 078 | 5,21 | ||||
| 2025-07-08 | 13F | Apella Capital, LLC | 43 241 | −2,02 | 884 | −1,56 | ||||
| 2025-07-17 | 13F | DiNuzzo Private Wealth, Inc. | 433 | 0,00 | 9 | 0,00 | ||||
| 2025-08-15 | 13F | Provenance Wealth Advisors, LLC | 30 154 | −5,93 | 618 | −5,37 | ||||
| 2025-08-15 | 13F | Morgan Stanley | 7 397 729 | 2,89 | 151 579 | 3,59 | ||||
| 2025-07-16 | 13F | Kathmere Capital Management, LLC | 23 686 | 34,22 | 485 | 35,10 | ||||
| 2025-07-21 | 13F | Old Second National Bank Of Aurora | 2 450 | 0,00 | 50 | 2,04 | ||||
| 2025-08-26 | 13F/A | Thrivent Financial For Lutherans | 10 433 | 0 | ||||||
| 2025-08-14 | 13F | EP Wealth Advisors, Inc. | 67 227 | 0,89 | 1 377 | 1,62 | ||||
| 2025-08-08 | 13F | Hartland & Co., LLC | 2 696 392 | 3,79 | 55 249 | 4,50 | ||||
| 2025-07-01 | 13F | Legacy Wealth Management, LLC / MS | 45 604 | 6,52 | 934 | 7,23 | ||||
| 2025-07-17 | 13F | Hengehold Capital Management Llc | 421 960 | 3,57 | 8 646 | 4,28 | ||||
| 2025-07-10 | 13F | Sterling Financial Group, Inc. | 730 147 | 1,19 | 14 961 | 1,89 | ||||
| 2025-04-24 | 13F | Legacy CG, LLC | 0 | −100,00 | 0 | |||||
| 2025-07-29 | 13F | Angeles Wealth Management, Llc | 1 904 | 39 | ||||||
| 2025-07-08 | 13F | Red Spruce Capital, LLC | 308 114 | −13,43 | 6 313 | −12,83 | ||||
| 2025-08-07 | 13F | Addison Advisors LLC | 119 132 | −45,15 | 2 441 | −44,77 | ||||
| 2025-07-07 | 13F | TruWealth Advisors, LLC | 4 341 009 | 2,14 | 88 947 | 2,84 | ||||
| 2025-08-11 | 13F | Goodman Financial Corp | 28 277 | 0,00 | 579 | 0,70 | ||||
| 2025-04-01 | 13F | Cornerstone Planning, LLC | 86 877 | 1 749 | ||||||
| 2025-07-16 | 13F | Kirr Marbach & Co Llc /in/ | 503 314 | 5,87 | 10 313 | 6,59 | ||||
| 2025-07-25 | 13F | We Are One Seven, LLC | 234 549 | 13,14 | 4 806 | 13,92 | ||||
| 2025-05-15 | 13F/A | Orion Portfolio Solutions, LLC | 120 148 | 2,57 | 2 445 | 3,69 | ||||
| 2025-07-22 | 13F | Berger Financial Group, Inc | 230 187 | −1,37 | 4 717 | −0,69 | ||||
| 2025-08-14 | 13F | Wilkins Miller Wealth Management, LLC | 328 971 | 1,10 | 6 741 | 1,80 | ||||
| 2025-08-15 | 13F | Keel Point, LLC | 12 043 | 0,00 | 247 | 0,41 | ||||
| 2025-07-24 | 13F | Reuter James Wealth Management, Llc | 44 124 | 88,54 | 904 | 89,92 | ||||
| 2025-08-11 | 13F | Western Wealth Management, LLC | 28 700 | 0,00 | 588 | 0,68 | ||||
| 2025-07-18 | 13F | Truist Financial Corp | 68 533 | −33,99 | 1 404 | −33,52 | ||||
| 2025-08-11 | 13F | Aspen Investment Management Inc | 161 155 | 32,20 | 3 | 50,00 | ||||
| 2025-06-27 | NP | DRSK - Aptus Defined Risk ETF | 1 710 969 | 9,52 | 34 938 | 10,71 | ||||
| 2025-08-14 | 13F | Leisure Capital Management | 148 373 | 0,43 | 3 040 | 1,13 | ||||
| 2025-08-18 | 13F | Geneos Wealth Management Inc. | 216 358 | 61,50 | 4 433 | 62,62 | ||||
| 2025-08-08 | 13F | Capital Investment Advisory Services, LLC | 10 044 | 0,29 | 206 | 0,99 | ||||
| 2025-08-14 | 13F | Royal Bank Of Canada | 1 196 457 | 6,76 | 24 515 | 7,49 | ||||
| 2025-07-08 | 13F | Legacy Private Trust Co. | 39 141 | −29,88 | 802 | −29,43 | ||||
| 2025-07-24 | 13F | First Fiduciary Investment Counsel, Inc. | 18 465 | 0,00 | 0 | |||||
| 2025-08-13 | 13F | Flow Traders U.s. Llc | 78 285 | 2 | ||||||
| 2025-07-11 | 13F | First PREMIER Bank | 305 | 0,00 | 0 | |||||
| 2025-08-14 | 13F | Citadel Advisors Llc | 665 407 | 1 132,67 | 13 634 | 1 141,71 | ||||
| 2025-07-22 | 13F | Net Worth Advisory Group | 36 683 | 138,60 | 752 | 140,71 | ||||
| 2025-08-12 | 13F | Global Retirement Partners, LLC | 2 826 | 0,00 | 58 | 1,79 | ||||
| 2025-08-08 | 13F | Foundations Investment Advisors, LLC | 66 371 | 120,63 | 1 360 | 122,06 | ||||
| 2025-08-12 | 13F | YANKCOM Partnership | 22 115 | 9,94 | 453 | 10,76 | ||||
| 2025-08-15 | 13F | Stonebridge Capital Advisors LLC | 30 795 | −21,55 | 631 | −21,05 | ||||
| 2025-08-06 | 13F | Horan Securities, Inc. | 10 076 | 1,00 | 206 | 1,48 | ||||
| 2025-05-14 | 13F | Monterey Private Wealth, Inc. | 28 240 | 1,11 | 575 | 2,14 | ||||
| 2025-07-14 | 13F | Whitener Capital Management, Inc. | 60 951 | 45,11 | 1 249 | 46,14 | ||||
| 2025-08-14 | 13F | TCG Advisory Services, LLC | 349 147 | 0,41 | 7 154 | 1,10 | ||||
| 2025-07-10 | 13F | Wealth Enhancement Advisory Services, Llc | 184 596 | 0,95 | 3 777 | 1,48 | ||||
| 2025-07-21 | 13F | Crews Bank & Trust | 19 830 | 8,18 | 406 | 8,85 | ||||
| 2025-07-28 | 13F | Morris Financial Concepts, Inc. | 9 708 | 0,00 | 199 | 0,51 | ||||
| 2025-08-14 | 13F | Jane Street Group, Llc | 122 423 | −91,59 | 2 508 | −91,53 | ||||
| 2025-08-12 | 13F | Wayfinding Financial, LLC | 0 | −100,00 | 0 | |||||
| 2025-07-15 | 13F | BCS Wealth Management | 315 050 | 8,12 | 6 | 20,00 | ||||
| 2025-08-14 | 13F | Schwallier Wealth Management LLC | 0 | −100,00 | 0 | −100,00 | ||||
| 2025-08-14 | 13F | Wells Fargo & Company/mn | 7 274 063 | 24,93 | 149 046 | 25,79 | ||||
| 2025-08-14 | 13F | CIBC World Markets Inc. | 0 | −100,00 | 0 | |||||
| 2025-07-11 | 13F | Butensky & Cohen Financial Security, Inc | 61 821 | 3,47 | 1 267 | 4,20 | ||||
| 2025-08-12 | 13F | Richmond Investment Services, LLC | 87 581 | 103,61 | 1 795 | 105,03 | ||||
| 2025-08-07 | 13F | Montag A & Associates Inc | 12 587 | 103,48 | 258 | 105,60 | ||||
| 2025-08-01 | 13F | First Command Advisory Services, Inc. | 51 772 | 18,36 | 1 061 | 19,10 | ||||
| 2025-08-14 | 13F | Mercer Global Advisors Inc /adv | 32 678 | −35,93 | 670 | −35,49 | ||||
| 2025-08-06 | 13F | AE Wealth Management LLC | 579 | 12 | ||||||
| 2025-08-12 | 13F | Cynosure Management, Llc | 41 794 | 0,00 | 856 | 0,71 | ||||
| 2025-07-11 | 13F | AA Financial Advisors, LLC | 117 427 | 1,97 | 2 406 | 2,69 | ||||
| 2025-08-05 | 13F | Sensible Money, LLC | 26 261 | 0,05 | 538 | 0,75 | ||||
| 2025-08-12 | 13F | Steward Partners Investment Advisory, Llc | 7 106 | 2,76 | 146 | 3,57 | ||||
| 2025-07-31 | 13F | Leavell Investment Management, Inc. | 44 449 | −11,08 | 911 | −10,52 | ||||
| 2025-05-05 | 13F | Eagle Bay Advisors LLC | 0 | −100,00 | 0 | −100,00 | ||||
| 2025-08-07 | 13F | SFE Investment Counsel | 285 523 | 20,15 | 5 850 | 20,97 | ||||
| 2025-08-06 | 13F | SNS Financial Group, LLC | 189 966 | 18,16 | 3 892 | 18,99 | ||||
| 2025-04-11 | 13F | Davis Capital Management | 12 322 | −1,93 | 251 | −0,79 | ||||
| 2025-07-22 | 13F | Kessler Investment Group, LLC | 8 568 | 17,43 | 176 | 18,24 | ||||
| 2025-08-14 | 13F | First International Bank of Israel Ltd. | 498 000 | 10 204 | ||||||
| 2025-05-14 | 13F | Susquehanna International Group, Llp | 0 | −100,00 | 0 | |||||
| 2025-08-13 | 13F | Morton Community Bank | 260 533 | −1,11 | 5 338 | −0,43 | ||||
| 2025-05-14 | 13F | Van Hulzen Asset Management, LLC | 0 | −100,00 | 0 | |||||
| 2025-08-13 | 13F | RPg Family Wealth Advisory, LLC | 25 000 | 0,00 | 512 | 0,79 | ||||
| 2025-07-30 | 13F | Brookstone Capital Management | 1 371 721 | −5,08 | 28 107 | −4,43 | ||||
| 2025-08-06 | 13F | Commonwealth Equity Services, Llc | 477 748 | 9,94 | 10 | 12,50 | ||||
| 2025-07-25 | 13F | G2 Capital Management, Llc / Oh | 78 759 | 1,14 | 1 614 | 1,83 | ||||
| 2025-08-01 | 13F | Redwood Park Advisors LLC | 0 | −100,00 | 0 | |||||
| 2025-08-12 | 13F | Hanover Advisors Inc | 58 922 | 4,31 | 1 207 | 5,05 | ||||
| 2025-07-10 | 13F | Sovran Advisors, LLC | 0 | −100,00 | 0 | |||||
| 2025-07-31 | 13F | Vaughan David Investments Inc/il | 393 115 | 1,76 | 8 | 14,29 | ||||
| 2025-07-25 | 13F | Hobbs Group Advisors, LLC | 45 010 | −14,02 | 922 | −13,43 | ||||
| 2025-08-11 | 13F | Parr Mcknight Wealth Management Group, Llc | 196 902 | 16,91 | 4 035 | 17,71 | ||||
| 2025-07-31 | 13F | Cambridge Investment Research Advisors, Inc. | 915 236 | 16,70 | 19 | 20,00 | ||||
| 2025-04-17 | 13F | Missouri Trust & Investment Co | 0 | −100,00 | 0 | |||||
| 2025-08-14 | 13F | Fmr Llc | 391 | 51,55 | 8 | 60,00 | ||||
| 2025-07-14 | 13F | Sound Stewardship, LLC | 350 356 | 9,99 | 7 179 | 10,74 | ||||
| 2025-07-08 | 13F | S.E.E.D. Planning Group LLC | 165 408 | 2,43 | 3 389 | 3,13 | ||||
| 2025-08-14 | 13F | Guardian Wealth Advisors, Llc / Nc | 181 599 | −3,99 | 3 721 | −3,35 | ||||
| 2025-08-14 | 13F | Coastal Bridge Advisors, LLC | 96 026 | −0,43 | 1 968 | 0,25 | ||||
| 2025-08-15 | 13F | Captrust Financial Advisors | 581 680 | 35,67 | 11 919 | 36,60 | ||||
| 2025-07-31 | 13F | United Community Bank | 5 500 | 0,00 | 113 | 0,90 | ||||
| 2025-07-14 | 13F | Infinity Wealth Counsel, LLC | 172 127 | 0,74 | 3 527 | 1,41 | ||||
| 2025-08-04 | 13F | Creekmur Asset Management LLC | 49 | 1 | ||||||
| 2025-07-29 | 13F | Stratos Wealth Partners, LTD. | 52 890 | −6,89 | 1 084 | −6,23 | ||||
| 2025-08-01 | 13F | GPM Growth Investors, Inc. | 653 878 | 5,62 | 13 398 | 6,34 | ||||
| 2025-07-24 | 13F | Vantage Point Financial LLC | 48 337 | −1,05 | 990 | −0,40 | ||||
| 2025-08-14 | 13F | JPL Wealth Management, LLC | 53 313 | 27,09 | 1 092 | 28,02 | ||||
| 2025-07-22 | 13F | 4Thought Financial Group Inc. | 38 339 | 9,14 | 786 | 9,94 | ||||
| 2025-07-29 | 13F | Sigma Investment Counselors Inc | 15 494 | −5,52 | 317 | −4,80 | ||||
| 2025-08-11 | 13F | United Capital Financial Advisers, Llc | 20 605 | 13,18 | 422 | 14,05 | ||||
| 2025-07-15 | 13F | Genesis Wealth Advisors, LLC | 106 052 | 8,19 | 2 173 | 8,98 | ||||
| 2025-08-05 | 13F | Strategic Financial Concepts, LLC | 0 | −100,00 | 0 | |||||
| 2025-08-05 | 13F | Key FInancial Inc | 51 685 | 12,84 | 1 059 | 13,63 | ||||
| 2025-08-13 | 13F | Colonial Trust Co / SC | 165 673 | 16,85 | 3 395 | 17,64 | ||||
| 2025-08-14 | 13F | Benjamin Edwards Inc | 10 671 | −0,63 | 219 | 0,00 | ||||
| 2025-07-24 | 13F | Leo Wealth, LLC | 14 178 | 291 | ||||||
| 2025-07-29 | 13F | Altus Wealth Group LLC | 16 417 | 0,18 | 336 | 0,90 | ||||
| 2025-08-01 | 13F | Rossby Financial, LCC | 828 | 0,00 | 17 | 0,00 | ||||
| 2025-08-14 | 13F | Colony Group, LLC | 395 585 | 4,07 | 8 106 | 4,78 | ||||
| 2025-08-14 | 13F | Mariner, LLC | 30 147 | 7,36 | 618 | 8,06 | ||||
| 2025-07-23 | 13F | Evexia Wealth Llc | 95 332 | −14,99 | 1 954 | −14,34 | ||||
| 2025-07-22 | 13F | DAVENPORT & Co LLC | 12 695 | 0,00 | 260 | 0,78 | ||||
| 2025-08-01 | 13F | Clark Asset Management, LLC | 721 036 | 17,18 | 14 774 | 17,99 | ||||
| 2025-08-07 | 13F | Allworth Financial LP | 87 323 | −0,80 | 1 789 | 0,06 | ||||
| 2025-08-13 | 13F | Alerus Financial Na | 5 547 | 114 | ||||||
| 2025-08-14 | 13F | Stifel Financial Corp | 768 603 | 6,71 | 15 749 | 7,44 | ||||
| 2025-08-05 | 13F | Sigma Planning Corp | 48 261 | −0,57 | 989 | 0,10 | ||||
| 2025-08-06 | 13F | Souders Financial Advisors | 186 475 | 5,88 | 3 821 | 6,61 | ||||
| 2025-08-08 | 13F | ProVise Management Group, LLC | 222 696 | 6,64 | 4 563 | 7,39 | ||||
| 2025-08-14 | 13F | Bank Of America Corp /de/ | 3 367 938 | 1,29 | 69 009 | 1,99 | ||||
| 2025-07-29 | 13F | Straight Path Wealth Management | 421 105 | 9,96 | 8 628 | 10,71 | ||||
| 2025-07-29 | 13F | Carmel Capital Partners, LLC | 290 838 | 6,78 | 5 959 | 7,52 | ||||
| 2025-08-05 | 13F | Huntington National Bank | 2 455 | 5,64 | ||||||
| 2025-08-13 | 13F | Willis Johnson & Associates, Inc. | 14 411 | 0,00 | 295 | 0,68 | ||||
| 2025-08-14 | 13F | Redwood Financial Network Corp | 74 920 | 2,20 | 1 535 | 2,95 | ||||
| 2025-08-11 | 13F | Oder Investment Management, LLC | 33 885 | 2,06 | 694 | 2,81 | ||||
| 2025-07-31 | 13F | Gill Capital Partners, Llc | 147 905 | 5,95 | 3 031 | 6,69 | ||||
| 2025-07-17 | 13F | Camelot Portfolios, LLC | 91 097 | −6,39 | 1 867 | −5,76 | ||||
| 2025-08-14 | 13F | Ancora Advisors, LLC | 27 523 | −1,14 | 564 | −0,53 | ||||
| 2025-07-09 | 13F | Beacon Financial Group | 15 500 | 0,00 | 318 | 0,63 | ||||
| 2025-08-14 | 13F | Raymond James Financial Inc | 5 503 246 | −7,70 | 112 762 | −7,06 | ||||
| 2025-07-21 | 13F | Segment Wealth Management, LLC | 57 872 | −3,44 | 1 186 | −2,79 | ||||
| 2025-08-19 | 13F | Newbridge Financial Services Group, Inc. | 26 | 0,00 | 1 | |||||
| 2025-08-19 | 13F | Anchor Investment Management, LLC | 965 775 | 3,38 | 19 789 | 4,09 | ||||
| 2025-07-14 | 13F | GAMMA Investing LLC | 6 804 | −73,44 | 139 | −73,32 | ||||
| 2025-08-04 | 13F | Atria Investments Llc | 133 145 | −0,32 | 2 728 | 0,37 | ||||
| 2025-08-11 | 13F | Howard Wealth Management, Llc | 228 313 | 0,44 | 4 678 | 1,15 | ||||
| 2025-08-12 | 13F | LPL Financial LLC | 4 783 420 | 2,32 | 98 012 | 3,02 | ||||
| 2025-08-14 | 13F | Mml Investors Services, Llc | 778 550 | 9,38 | 16 | 7,14 | ||||
| 2025-07-17 | 13F | Western Financial Corp/CA | 48 850 | −1,36 | 1 001 | −0,70 | ||||
| 2025-07-22 | 13F | BridgePort Financial Solutions, LLC | 10 080 | 0,00 | 207 | 0,49 | ||||
| 2025-08-06 | 13F | Aspect Partners, LLC | 975 | 0,00 | 20 | 0,00 | ||||
| 2025-08-12 | 13F | CIBC Private Wealth Group, LLC | 0 | −100,00 | 0 | |||||
| 2025-07-14 | 13F | Park Avenue Securities Llc | 0 | −100,00 | 0 | |||||
| 2025-05-22 | 13F | Mattson Financial Services, LLC | 0 | −100,00 | 0 | |||||
| 2025-08-12 | 13F | MAI Capital Management | 1 569 972 | 0,30 | 32 169 | 0,99 | ||||
| 2025-08-12 | 13F | Goepper Burkhardt LLC | 504 936 | 5,37 | 10 346 | 6,10 | ||||
| 2025-08-08 | 13F | Kingsview Wealth Management, LLC | 29 957 | −0,08 | 614 | 0,49 | ||||
| 2025-08-13 | 13F | MONECO Advisors, LLC | 995 005 | 17,25 | 20 388 | 18,06 | ||||
| 2025-08-08 | 13F | Flaharty Asset Management, LLC | 0 | −100,00 | 0 | |||||
| 2025-07-24 | 13F | Us Bancorp \de\ | 3 029 | 0,00 | 62 | 1,64 | ||||
| 2025-04-15 | 13F | Chris Bulman Inc | 0 | −100,00 | 0 | |||||
| 2025-07-10 | 13F | Secure Asset Management, LLC | 0 | −100,00 | 0 | |||||
| 2025-07-23 | 13F | Hager Investment Management Services, Llc | 0 | −100,00 | 0 | |||||
| 2025-08-13 | 13F | Invesco Ltd. | 2 157 631 | 13,24 | 44 210 | 14,02 | ||||
| 2025-08-13 | 13F | AMJ Financial Wealth Management | 432 616 | 1,25 | 8 864 | 1,96 | ||||
| 2025-07-30 | 13F | Eqis Capital Management, Inc. | 48 494 | −0,78 | 994 | −0,10 | ||||
| 2025-07-30 | 13F | Phoenix Holdings Ltd. | 162 437 | 4,92 | 3 326 | 5,62 | ||||
| 2025-07-21 | 13F | Exchange Capital Management, Inc. | 32 321 | −0,36 | 662 | 0,30 | ||||
| 2025-07-14 | 13F | AdvisorNet Financial, Inc | 5 010 | 0,20 | 103 | 0,99 | ||||
| 2025-08-13 | 13F | Colonial Trust Advisors | 222 433 | 9,25 | 4 558 | 9,99 | ||||
| 2025-08-01 | 13F | Financial Counselors Inc | 0 | −100,00 | 0 | |||||
| 2025-09-11 | 13F | Milestones Private Investment Advisors LLC | 115 296 | 2 362 | ||||||
| 2025-07-25 | 13F | Astoria Portfolio Advisors LLC. | 16 222 | −10,21 | 331 | −9,32 | ||||
| 2025-08-06 | 13F | Financial Advisory Corp /ut/ /adv | 131 570 | −4,16 | 3 | 0,00 | ||||
| 2025-08-11 | 13F | Pinnacle Financial Group, LLC / IL | 24 087 | 26,55 | 494 | 27,39 | ||||
| 2025-07-16 | 13F | Old Port Advisors | 159 590 | 30,12 | 3 270 | 31,02 | ||||
| 2025-07-28 | 13F | Brown Financial Advisory | 20 734 | 40,20 | 425 | 41,33 | ||||
| 2025-08-07 | 13F | Apeiron RIA LLC | 58 314 | 7,64 | 1 195 | 8,35 | ||||
| 2025-08-12 | 13F | Gladstone Institutional Advisory LLC | 119 171 | 0,40 | 2 442 | 1,08 | ||||
| 2025-08-14 | 13F | Certified Advisory Corp | 22 117 | 50,03 | 453 | 51,00 |