Grundläggande statistik
| Portföljvärde | $ 505 748 625 |
| Aktuella positioner | 55 |
Senaste innehav, resultat, förvaltat kapital (från 13F, 13D)
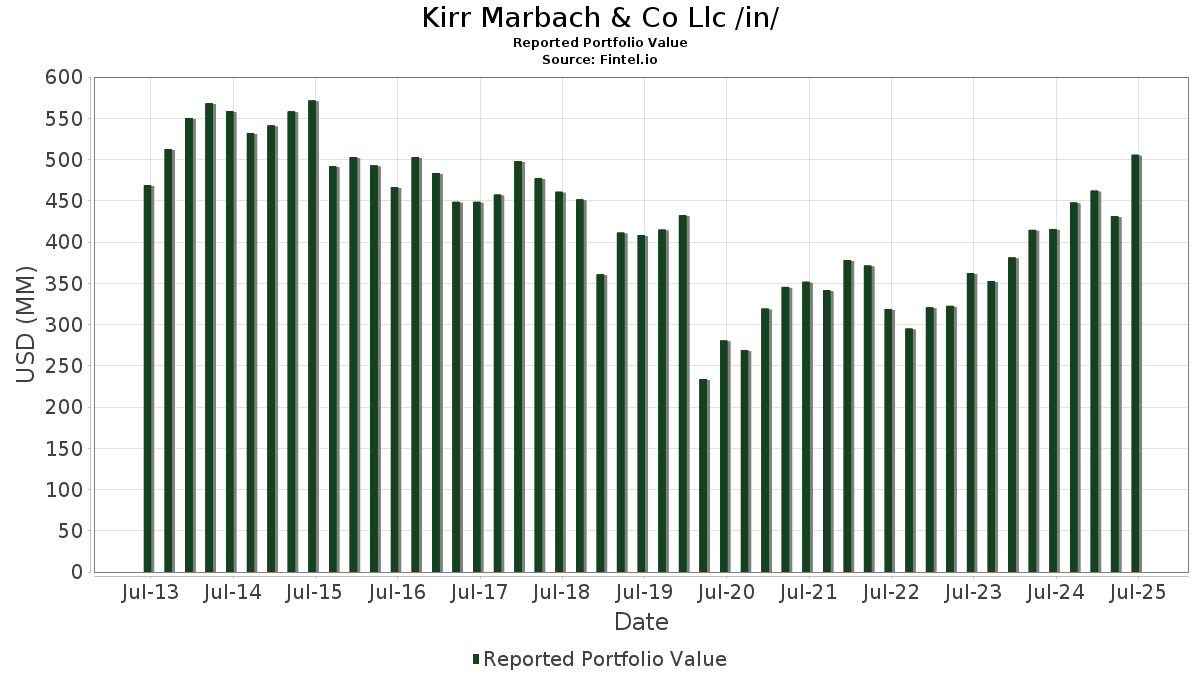
Kirr Marbach & Co Llc /in/ har redovisat 55 totala innehav i sina senaste SEC-arkiveringar. Det senaste portföljvärdet beräknas vara $ 505 748 625 USD. Faktiskt förvaltade tillgångar (AUM) är detta värde plus likvida medel (som inte redovisas). Kirr Marbach & Co Llc /in/s största innehav är Broadcom Inc. (US:AVGO) , Vistra Corp. (US:VST) , EMCOR Group, Inc. (US:EME) , MasTec, Inc. (US:MTZ) , and AutoZone, Inc. (US:AZO) . Kirr Marbach & Co Llc /in/s nya positioner inkluderar Generac Holdings Inc. (US:GNRC) , Amrize AG (US:AMRZ) , Peloton Interactive, Inc. (US:PTON) , .
Största ökningarna detta kvartal
Vi använder förändringen i portföljallokeringen eftersom det är det mest meningsfulla måttet. Förändringar kan bero på transaktioner eller förändringar i aktiekurser.
| Värdepapper | Aktier (MM) |
Värde (MM$) |
Portfölj % av | ΔPortfölj % av |
|---|---|---|---|---|
| 0,17 | 32,70 | 6,4653 | 1,9111 | |
| 0,05 | 7,57 | 1,4975 | 1,4975 | |
| 0,06 | 32,35 | 6,3964 | 1,2535 | |
| 0,17 | 29,25 | 5,7837 | 1,1669 | |
| 0,15 | 41,80 | 8,2659 | 1,0843 | |
| 0,07 | 3,68 | 0,7267 | 0,7267 | |
| 0,47 | 3,27 | 0,6456 | 0,6456 | |
| 0,06 | 5,70 | 1,1276 | 0,4032 | |
| 0,18 | 9,35 | 1,8493 | 0,3393 | |
| 0,11 | 10,49 | 2,0746 | 0,2420 |
Största minskningarna detta kvartal
Vi använder förändringen i portföljallokeringen eftersom det är det mest meningsfulla måttet. Förändringar kan bero på transaktioner eller förändringar i aktiepriser.
| Värdepapper | Aktier (MM) |
Värde (MM$) |
Portfölj % av | ΔPortfölj % av |
|---|---|---|---|---|
| 0,01 | 28,93 | 5,7194 | −1,1447 | |
| 0,05 | 4,57 | 0,9034 | −0,8343 | |
| 0,97 | 20,09 | 3,9722 | −0,7328 | |
| 0,09 | 21,93 | 4,3370 | −0,6403 | |
| 0,99 | 19,41 | 3,8381 | −0,5712 | |
| 0,19 | 15,57 | 3,0789 | −0,5353 | |
| 0,07 | 7,50 | 1,4826 | −0,4253 | |
| 0,10 | 2,48 | 0,4907 | −0,3311 | |
| 0,68 | 13,46 | 2,6614 | −0,3207 | |
| 0,14 | 18,53 | 3,6631 | −0,2974 |
13F- och fond arkiveringar
Denna blankett lämnades in den 2025-07-16 för rapporteringsperioden 2025-06-30. Klicka på länksymbolen för att se hela transaktionshistoriken.
Uppgradera för att låsa upp premiumdata och exportera till Excel![]() .
.
| Värdepapper | Typ | Genomsnittligt aktiepris | Aktier (MM) |
ΔAktier (%) |
ΔAktier (%) |
Värde ($MM) |
Portfölj (%) |
ΔPortfölj (%) |
|
|---|---|---|---|---|---|---|---|---|---|
| AVGO / Broadcom Inc. | 0,15 | −17,98 | 41,80 | 35,03 | 8,2659 | 1,0843 | |||
| VST / Vistra Corp. | 0,17 | 0,92 | 32,70 | 66,55 | 6,4653 | 1,9111 | |||
| EME / EMCOR Group, Inc. | 0,06 | 0,83 | 32,35 | 45,91 | 6,3964 | 1,2535 | |||
| MTZ / MasTec, Inc. | 0,17 | 0,64 | 29,25 | 46,97 | 5,7837 | 1,1669 | |||
| AZO / AutoZone, Inc. | 0,01 | 0,40 | 28,93 | −2,25 | 5,7194 | −1,1447 | |||
| RSG / Republic Services, Inc. | 0,09 | 0,38 | 21,93 | 2,22 | 4,3370 | −0,6403 | |||
| BSCP / Invesco Exchange-Traded Self-Indexed Fund Trust - Invesco BulletShares 2025 Corporate Bond ETF | 0,97 | −0,96 | 20,09 | −0,96 | 3,9722 | −0,7328 | |||
| BSCQ / Invesco Exchange-Traded Self-Indexed Fund Trust - Invesco BulletShares 2026 Corporate Bond ETF | 0,99 | 1,91 | 19,41 | 2,12 | 3,8381 | −0,5712 | |||
| CIGI / Colliers International Group Inc. | 0,14 | 0,71 | 18,53 | 8,50 | 3,6631 | −0,2974 | |||
| MKL / Markel Group Inc. | 0,01 | 0,87 | 16,27 | 7,76 | 3,2167 | −0,2853 | |||
| GOOGL / Alphabet Inc. | 0,09 | 0,76 | 16,14 | 14,83 | 3,1920 | −0,0691 | |||
| SSNC / SS&C Technologies Holdings, Inc. | 0,19 | 0,82 | 15,57 | −0,06 | 3,0789 | −0,5353 | |||
| LRN / Stride, Inc. | 0,10 | 0,88 | 14,90 | 15,78 | 2,9462 | −0,0390 | |||
| CP / Canadian Pacific Kansas City Limited | 0,17 | 0,32 | 13,53 | 13,29 | 2,6747 | −0,0951 | |||
| BSCR / Invesco Exchange-Traded Self-Indexed Fund Trust - Invesco BulletShares 2027 Corporate Bond ETF | 0,68 | 4,38 | 13,46 | 4,70 | 2,6614 | −0,3207 | |||
| BKFOF / Brookfield Corporation - Preferred Stock | 0,18 | 0,89 | 11,03 | 19,07 | 2,1807 | 0,0321 | |||
| DLTR / Dollar Tree, Inc. | 0,11 | 0,66 | 10,49 | 32,81 | 2,0746 | 0,2420 | |||
| BSCS / Invesco Exchange-Traded Self-Indexed Fund Trust - Invesco BulletShares 2028 Corporate Bond ETF | 0,50 | 5,87 | 10,31 | 6,59 | 2,0391 | −0,2050 | |||
| APG / APi Group Corporation | 0,18 | 0,64 | 9,35 | 43,68 | 1,8493 | 0,3393 | |||
| BCO / The Brink's Company | 0,10 | 0,64 | 8,52 | 4,30 | 1,6841 | −0,2103 | |||
| MPC / Marathon Petroleum Corporation | 0,05 | 0,82 | 8,36 | 14,94 | 1,6536 | −0,0340 | |||
| VLTO / Veralto Corporation | 0,08 | 0,67 | 8,09 | 4,28 | 1,5997 | −0,1999 | |||
| GXO / GXO Logistics, Inc. | 0,16 | 0,90 | 7,84 | 25,74 | 1,5504 | 0,1038 | |||
| GNRC / Generac Holdings Inc. | 0,05 | 7,57 | 1,4975 | 1,4975 | |||||
| XOM / Exxon Mobil Corporation | 0,07 | 0,58 | 7,50 | −8,84 | 1,4826 | −0,4253 | |||
| LYV / Live Nation Entertainment, Inc. | 0,05 | 3,29 | 7,35 | 19,66 | 1,4535 | 0,0285 | |||
| BSCT / Invesco Exchange-Traded Self-Indexed Fund Trust - Invesco BulletShares 2029 Corporate Bond ETF | 0,38 | 12,95 | 7,16 | 13,99 | 1,4149 | −0,0413 | |||
| VC / Visteon Corporation | 0,07 | 0,40 | 6,62 | 20,68 | 1,3096 | 0,0365 | |||
| CROX / Crocs, Inc. | 0,06 | 91,49 | 5,70 | 82,64 | 1,1276 | 0,4032 | |||
| MOGA / Moog, Inc. - Class A | 0,03 | 1,29 | 5,35 | 5,74 | 1,0569 | −0,1157 | |||
| CXT / Crane NXT, Co. | 0,10 | 0,25 | 5,24 | 5,12 | 1,0355 | −0,1200 | |||
| ICUI / ICU Medical, Inc. | 0,04 | 0,65 | 4,77 | −4,20 | 0,9434 | −0,2120 | |||
| IOSP / Innospec Inc. | 0,05 | −31,28 | 4,57 | −39,01 | 0,9034 | −0,8343 | |||
| ALIT / Alight, Inc. | 0,77 | 0,96 | 4,37 | −3,64 | 0,8647 | −0,1880 | |||
| DIS / The Walt Disney Company | 0,03 | 0,57 | 4,21 | 26,36 | 0,8330 | 0,0596 | |||
| SHYF / The Shyft Group, Inc. | 0,34 | 0,01 | 4,21 | 55,04 | 0,8328 | 0,2026 | |||
| AMRZ / Amrize AG | 0,07 | 3,68 | 0,7267 | 0,7267 | |||||
| PTON / Peloton Interactive, Inc. | 0,47 | 3,27 | 0,6456 | 0,6456 | |||||
| RXO / RXO, Inc. | 0,19 | 0,61 | 2,99 | −17,19 | 0,5905 | −0,2461 | |||
| ATEX / Anterix Inc. | 0,10 | −0,05 | 2,48 | −29,95 | 0,4907 | −0,3311 | |||
| BAM / Brookfield Asset Management Ltd. | 0,04 | 0,70 | 1,97 | 14,87 | 0,3897 | −0,0082 | |||
| ET / Energy Transfer LP - Limited Partnership | 0,11 | −3,92 | 1,92 | −6,30 | 0,3796 | −0,0957 | |||
| LLY / Eli Lilly and Company | 0,00 | 0,00 | 1,61 | −5,62 | 0,3187 | −0,0774 | |||
| TY / Tri-Continental Corporation | 0,02 | 0,00 | 0,63 | 3,28 | 0,1245 | −0,0170 | |||
| CMI / Cummins Inc. | 0,00 | 0,00 | 0,49 | 4,44 | 0,0978 | −0,0120 | |||
| AVNW / Aviat Networks, Inc. | 0,02 | 0,00 | 0,45 | 25,56 | 0,0884 | 0,0057 | |||
| OFIX / Orthofix Medical Inc. | 0,04 | 0,00 | 0,44 | −31,57 | 0,0870 | −0,0623 | |||
| QQQ / Invesco QQQ Trust, Series 1 | 0,00 | 0,00 | 0,41 | 17,61 | 0,0819 | 0,0002 | |||
| AAPL / Apple Inc. | 0,00 | 10,55 | 0,32 | 2,22 | 0,0638 | −0,0095 | |||
| PKB / Invesco Exchange-Traded Fund Trust - Invesco Building & Construction ETF | 0,00 | 0,00 | 0,32 | 4,95 | 0,0629 | −0,0074 | |||
| HD / The Home Depot, Inc. | 0,00 | 0,00 | 0,31 | 0,00 | 0,0612 | −0,0106 | |||
| SKWD / Skyward Specialty Insurance Group, Inc. | 0,00 | 0,00 | 0,29 | 9,51 | 0,0570 | −0,0042 | |||
| AMZN / Amazon.com, Inc. | 0,00 | 0,00 | 0,24 | 15,31 | 0,0477 | −0,0008 | |||
| ABBV / AbbVie Inc. | 0,00 | 3,29 | 0,23 | −8,66 | 0,0461 | −0,0130 | |||
| MSFT / Microsoft Corporation | 0,00 | 0,22 | 0,0428 | 0,0428 | |||||
| VIG / Vanguard Specialized Funds - Vanguard Dividend Appreciation ETF | 0,00 | −100,00 | 0,00 | 0,0000 | |||||
| BIIB / Biogen Inc. | 0,00 | −100,00 | 0,00 | 0,0000 | |||||
| INMD / InMode Ltd. | 0,00 | −100,00 | 0,00 | 0,0000 |