Grundläggande statistik
| Institutionella ägare | 659 total, 629 long only, 0 short only, 30 long/short - change of 1,85% MRQ |
| Genomsnittlig portföljallokering | 0.3449 % - change of −17,36% MRQ |
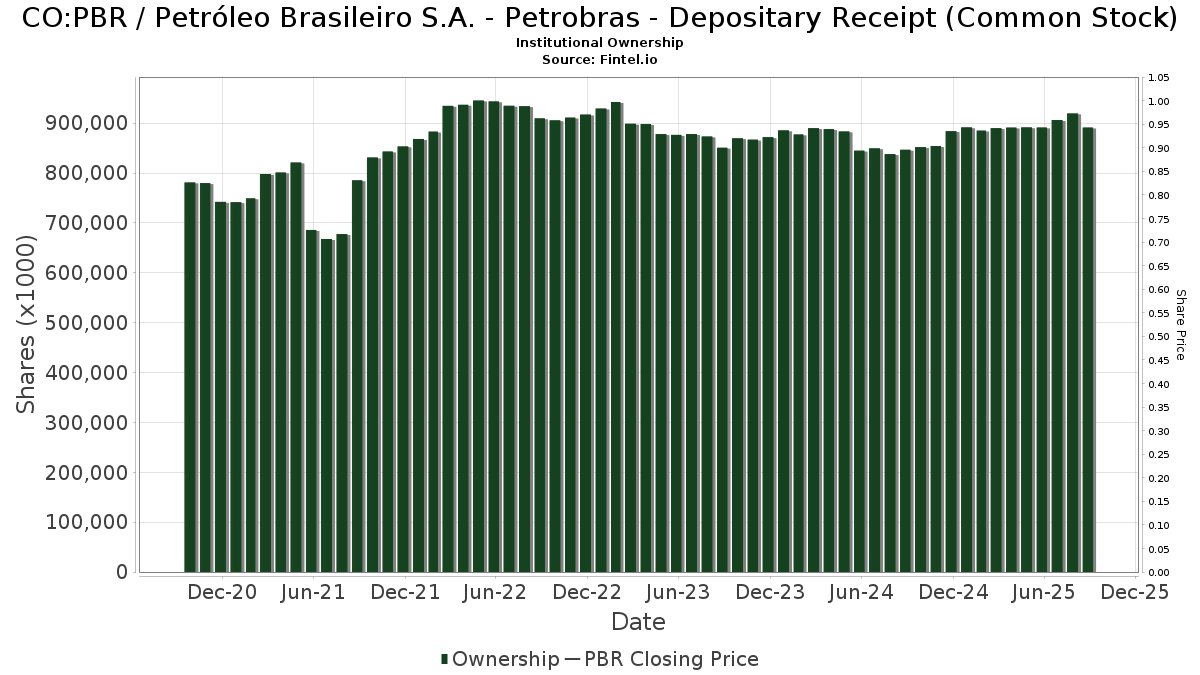
| Institutionella aktier (lång) | 891 131 784 (ex 13D/G) - change of −1,35MM shares −0,15% MRQ |
| Institutionellt värde (lång) | $ 10 425 071 USD ($1000) |
Institutionellt ägande och aktieägare
Petróleo Brasileiro S.A. - Petrobras - Depositary Receipt (Common Stock) (CO:PBR) har 659 Institutionella ägare och aktieägare som har lämnat in 13D/G- eller 13F-formulär till Securities Exchange Commission (SEC). Dessa institut innehar totalt 891,131,784 aktier. Största aktieägare inkluderar GQG Partners LLC, GSIHX - Goldman Sachs GQG Partners International Opportunities Fund Class A Shares, GQGPX - GQG PARTNERS EMERGING MARKETS EQUITY FUND Investor Shares, Baillie Gifford & Co, Fmr Llc, Schroder Investment Management Group, Lazard Asset Management Llc, Capital International Investors, Fisher Asset Management, LLC, and Massachusetts Financial Services Co /ma/ .
Petróleo Brasileiro S.A. - Petrobras - Depositary Receipt (Common Stock) (BVC:PBR) Institutionell ägarstruktur visar institutioners och fonders nuvarande positioner i företaget, samt de senaste förändringarna i positionernas storlek. Större aktieägare kan vara enskilda investerare, fonder, hedgefonder eller institutioner. Bilaga 13D visar att investeraren äger (eller ägde) mer än 5% av företaget och avser (eller avsåg) att aktivt eftersträva en förändring av affärsstrategin. Schedule 13G indikerar en passiv investering på över 5%.
Fondsentimentets poäng
Fondsentimentet poängen(fka Ägarackumulation-poäng) visar vilka aktier som är mest köpta av fonder. Det är resultatet av en sofistikerad kvantitativ flerfaktormodell som identifierar företag med de högsta nivåerna av institutionell ackumulering. Poängsättningsmodellen använder en kombination av den totala ökningen av redovisade ägare, förändringarna i portföljallokeringarna för dessa ägare och andra mått. Siffran sträcker sig från 0 till 100, där högre siffror indikerar en högre nivå av ackumulering i förhållande till sina konkurrenter, och 50 är genomsnittet.
Uppdateringsfrekvens: Dagligen
Se Ownership Explorer, som innehåller en lista över de högst rankade företagen.
13F- och NPORT-arkiveringar
Detaljer om 13F-arkiveringar är gratis. Detaljer om NP-arkiveringar kräver ett premiummedlemskap. Gröna rader indikerar nya positioner. Röda rader indikerar stängda positioner. Klicka på länk symbolen för att se hela transaktionshistoriken.
Uppgradera
för att låsa upp premiumdata och exportera till Excel ![]() .
.
| Fil Datum | Källa | Investerare | Typ | Genomsnittligt pris (beräknat) |
Aktier | Δ Aktier (%) |
Rapporterat värde (1000 USD) |
Δ Värde (%) |
Portföljallokering (%) |
|
|---|---|---|---|---|---|---|---|---|---|---|
| 2025-07-09 | 13F | Krilogy Financial LLC | 19 815 | 8,78 | 248 | −5,36 | ||||
| 2025-08-29 | NP | Gabelli Global Utility & Income Trust | 10 000 | 0,00 | 125 | −12,59 | ||||
| 2025-08-21 | NP | LAZARD RETIREMENT SERIES INC - Lazard Retirement Emerging Markets Equity Portfolio Service Shares | 318 438 | −18,17 | 3 984 | −28,62 | ||||
| 2025-08-18 | 13F/A | Nomura Holdings Inc | Put | 95 000 | 0,00 | 1 188 | −12,78 | |||
| 2025-08-18 | 13F/A | Nomura Holdings Inc | 69 680 | 29,21 | 872 | 12,68 | ||||
| 2025-05-15 | 13F | Altshuler Shaham Ltd | 0 | −100,00 | 0 | |||||
| 2025-07-15 | 13F | Drum Hill Capital, LLC | 132 048 | −1,09 | 1 652 | −13,74 | ||||
| 2025-07-17 | 13F | Park Place Capital Corp | 884 | 0,00 | 11 | −8,33 | ||||
| 2025-08-04 | 13F | Assetmark, Inc | 1 033 002 | 2,43 | 12 923 | −10,64 | ||||
| 2025-06-26 | NP | DEHP - Dimensional Emerging Markets High Profitability ETF | 8 060 | 53,23 | 91 | 21,62 | ||||
| 2025-05-15 | 13F | Balyasny Asset Management Llc | 0 | −100,00 | 0 | −100,00 | ||||
| 2025-06-26 | NP | Thrivent Core Funds - Thrivent Core Emerging Markets Equity Fund | 54 548 | 0,00 | 616 | −20,65 | ||||
| 2025-08-07 | 13F | Resources Investment Advisors, LLC. | 12 457 | −1,46 | 156 | −14,36 | ||||
| 2025-07-29 | 13F | Lesa Sroufe & Co | 343 008 | 0,38 | 4 | 0,00 | ||||
| 2025-08-07 | 13F | Allworth Financial LP | 12 006 | 138,17 | 150 | 163,16 | ||||
| 2025-08-12 | 13F | Journey Strategic Wealth Llc | 73 492 | 78,94 | 919 | 56,29 | ||||
| 2025-08-27 | NP | RYWTX - Emerging Markets 2x Strategy Fund Class A | 9 905 | 147,93 | 124 | 115,79 | ||||
| 2025-08-19 | 13F | State of Wyoming | 59 222 | −0,22 | 741 | −13,04 | ||||
| 2025-08-14 | 13F | BTG Pactual Asset Management US LLC | 0 | −100,00 | 0 | −100,00 | ||||
| 2025-08-22 | NP | AAAAX - DWS RREEF Real Assets Fund Class A | 728 956 | −16,34 | 9 119 | −27,02 | ||||
| 2025-04-28 | 13F | Ativo Capital Management LLC | 0 | −100,00 | 0 | −100,00 | ||||
| 2025-08-14 | 13F | TCG Advisory Services, LLC | 0 | −100,00 | 0 | |||||
| 2025-08-26 | NP | BGATX - Baillie Gifford Global Alpha Equities Fund Class 2 | 256 555 | 3 210 | ||||||
| 2025-08-12 | 13F | O'shaughnessy Asset Management, Llc | 951 968 | 6,04 | 11 909 | −7,49 | ||||
| 2025-08-13 | 13F | Allie Family Office LLC | 13 860 | 0,00 | 173 | −13,93 | ||||
| 2025-07-14 | 13F | Ridgewood Investments LLC | 47 086 | 52,62 | 589 | 150,64 | ||||
| 2025-08-14 | 13F | EP Wealth Advisors, Inc. | 17 992 | 225 | ||||||
| 2025-08-14 | 13F | Federation des caisses Desjardins du Quebec | 111 606 | −0,71 | 1 398 | −13,34 | ||||
| 2025-08-14 | 13F | Turim 21 Investimentos Ltda. | 3 820 | 48 | ||||||
| 2025-07-25 | NP | DIFAX - MFS Diversified Income Fund A | 221 128 | 62,45 | 2 552 | 40,40 | ||||
| 2025-07-07 | 13F | Retirement Wealth Solutions LLC | 882 | 0,00 | 11 | −8,33 | ||||
| 2025-08-13 | 13F | Mount Yale Investment Advisors, LLC | 13 429 | 168 | ||||||
| 2025-08-14 | 13F | Daiwa Securities Group Inc. | 159 113 | −40,26 | 2 | −66,67 | ||||
| 2025-08-29 | NP | LIVR - Intelligent Livermore ETF | 23 859 | 298 | ||||||
| 2025-07-22 | 13F | MAS Advisors LLC | 29 024 | 4,45 | 363 | −8,79 | ||||
| 2025-06-25 | NP | IPAYX - Integrity Dividend Summit Fund Class I | 23 000 | 15,00 | 260 | −8,80 | ||||
| 2025-08-08 | 13F | Hudock, Inc. | 20 046 | 34,63 | 251 | 17,37 | ||||
| 2025-08-21 | NP | MXENX - Great-West Emerging Markets Equity Fund Institutional Class | 128 591 | −72,12 | 1 609 | −75,69 | ||||
| 2025-08-04 | 13F | Pensionmark Financial Group, Llc | 14 361 | −47,45 | 180 | −54,22 | ||||
| 2025-08-05 | 13F | X-Square Capital, LLC | 21 748 | 0 | ||||||
| 2025-08-06 | 13F | Stone House Investment Management, LLC | 0 | −100,00 | 0 | |||||
| 2025-08-12 | 13F | Advisors Asset Management, Inc. | 152 680 | 8,76 | 1 910 | −5,12 | ||||
| 2025-08-12 | 13F | Rhumbline Advisers | 111 646 | −8,81 | 1 397 | −20,46 | ||||
| 2025-08-13 | 13F | Northern Trust Corp | 1 880 483 | −8,03 | 23 525 | −19,77 | ||||
| 2025-06-26 | NP | EMQAX - Ashmore Emerging Markets Active Equity Fund CLASS A | 19 272 | −30,43 | 218 | −44,78 | ||||
| 2025-07-29 | NP | RBB FUND, INC. - Aquarius International Fund | 10 959 | −81,02 | 126 | −83,64 | ||||
| 2025-05-08 | 13F | Tandem Financial, LLC | 0 | −100,00 | 0 | |||||
| 2025-03-28 | NP | DFEV - Dimensional Emerging Markets Value ETF | 0 | −100,00 | 0 | −100,00 | ||||
| 2025-08-25 | NP | MFS VARIABLE INSURANCE TRUST II - MFS Global Tactical Allocation Portfolio Initial Class | 23 739 | 10,84 | 297 | −3,58 | ||||
| 2025-07-25 | 13F | We Are One Seven, LLC | 55 625 | 8,55 | 696 | −5,31 | ||||
| 2025-08-14 | 13F | Balyasny Asset Management Llc | Call | 56 800 | 711 | |||||
| 2025-08-14 | 13F | Balyasny Asset Management Llc | Put | 31 600 | 395 | |||||
| 2025-08-11 | 13F | B. Metzler seel. Sohn & Co. AG | 410 526 | 0,83 | 5 136 | −12,04 | ||||
| 2025-08-27 | 13F/A | Brinker Capital Investments, LLC | 90 645 | 13,80 | 1 134 | −0,79 | ||||
| 2025-08-29 | 13F | Total Investment Management Inc | 450 | 6 | ||||||
| 2025-09-04 | 13F/A | Advisor Group Holdings, Inc. | 449 315 | 68,84 | 6 069 | 59,01 | ||||
| 2025-08-14 | 13F | Voloridge Investment Management, Llc | 11 396 | −99,78 | 143 | −99,81 | ||||
| 2025-05-12 | 13F | Sagil Capital Llp | Put | 0 | −100,00 | 0 | −100,00 | |||
| 2025-08-12 | 13F | BlackRock, Inc. | 10 934 808 | 10,30 | 136 794 | −3,78 | ||||
| 2025-08-27 | NP | Advanced Series Trust - Ast International Growth Portfolio | 87 809 | −5,71 | 1 098 | −17,75 | ||||
| 2025-04-22 | 13F | Duncker Streett & Co Inc | 0 | −100,00 | 0 | −100,00 | ||||
| 2025-05-13 | 13F | Thrivent Financial For Lutherans | 0 | −100,00 | 0 | −100,00 | ||||
| 2025-08-11 | 13F | Inspire Advisors, LLC | 0 | −100,00 | 0 | |||||
| 2025-08-14 | 13F | Massar Capital Management, LP | 27 500 | 0,00 | 344 | −12,69 | ||||
| 2025-08-13 | 13F | Schroder Investment Management Group | 31 261 243 | 4,90 | 391 078 | −8,48 | ||||
| 2025-07-25 | 13F | JustInvest LLC | 13 728 | 4,17 | 172 | −9,04 | ||||
| 2025-07-11 | 13F | Viking Fund Management Llc | 23 000 | 0,00 | 288 | −12,77 | ||||
| 2025-08-06 | 13F | First Horizon Advisors, Inc. | 207 | 3 | ||||||
| 2025-07-23 | 13F | Vontobel Holding Ltd. | 83 079 | 74,84 | 1 039 | 52,57 | ||||
| 2025-08-08 | 13F | Altfest L J & Co Inc | 0 | −100,00 | 0 | |||||
| 2025-08-27 | NP | THRIVENT SERIES FUND INC - Thrivent International Allocation Portfolio Class A | 26 146 | 90,68 | 327 | 66,84 | ||||
| 2025-07-31 | 13F | Cambridge Investment Research Advisors, Inc. | 184 708 | 12,08 | 2 | 0,00 | ||||
| 2025-08-13 | 13F | Grantham, Mayo, Van Otterloo & Co. LLC | 29 218 | −85,92 | 366 | −87,73 | ||||
| 2025-07-31 | 13F | R Squared Ltd | 28 348 | 94,16 | 355 | 69,38 | ||||
| 2025-06-25 | NP | PRLAX - T. Rowe Price Latin America Fund This fund is a listed as child fund of Price T Rowe Associates Inc /md/ and if that institution has disclosed ownership in this security, then these positions will not be double counted when calculating total shares and total value | 635 177 | 0,00 | 7 171 | −20,54 | ||||
| 2025-05-15 | 13F/A | Clear Street Llc | Call | 0 | −100,00 | 0 | ||||
| 2025-08-06 | 13F | Pekin Hardy Strauss, Inc. | 31 852 | 3,24 | 398 | −9,95 | ||||
| 2025-08-08 | 13F | Banco Bilbao Vizcaya Argentaria, S.a. | 27 621 | 95,53 | 347 | 71,29 | ||||
| 2025-08-14 | 13F | Cubist Systematic Strategies, LLC | Call | 334 800 | 267,91 | 4 188 | 221,17 | |||
| 2025-08-12 | 13F | Segall Bryant & Hamill, Llc | 36 200 | −27,74 | 453 | −37,05 | ||||
| 2025-08-14 | 13F | Cubist Systematic Strategies, LLC | 317 658 | 722,91 | 3 974 | 618,44 | ||||
| 2025-08-14 | 13F | Cubist Systematic Strategies, LLC | Put | 239 300 | −44,09 | 2 994 | −51,23 | |||
| 2025-07-30 | 13F | Whittier Trust Co | 91 382 | 11,51 | 1 143 | −2,72 | ||||
| 2025-08-11 | 13F | Resurgent Financial Advisors LLC | 15 620 | 0,00 | 195 | −12,56 | ||||
| 2025-08-26 | NP | UEMPX - UBS Emerging Markets Equity Opportunity Fund CLASS P | 551 620 | 5,57 | 6 901 | −7,90 | ||||
| 2025-05-15 | 13F/A | Clear Street Llc | Put | 0 | −100,00 | 0 | ||||
| 2025-08-11 | 13F | Lsv Asset Management | 22 000 | 0,00 | 0 | |||||
| 2025-08-13 | 13F | Todd Asset Management Llc | 2 989 446 | 1,09 | 37 398 | −11,81 | ||||
| 2025-04-15 | 13F | TrimTabs Asset Management, LLC | 0 | −100,00 | 0 | |||||
| 2025-07-18 | 13F | Founders Capital Management | 5 000 | 0,00 | 63 | −12,68 | ||||
| 2025-08-26 | NP | EQ ADVISORS TRUST - EQ/International Core Managed Volatility Portfolio Class IB | 53 367 | −10,98 | 668 | −22,35 | ||||
| 2025-08-13 | 13F | Jones Financial Companies Lllp | 39 008 | 307,69 | 483 | 251,82 | ||||
| 2025-07-28 | NP | AVEEX - Avantis Emerging Markets Equity Fund Institutional Class This fund is a listed as child fund of American Century Companies Inc and if that institution has disclosed ownership in this security, then these positions will not be double counted when calculating total shares and total value | 134 560 | −5,56 | 1 553 | −18,40 | ||||
| 2025-07-28 | 13F | Axxcess Wealth Management, Llc | 19 240 | −6,05 | 241 | −18,09 | ||||
| 2025-08-20 | NP | REMG - Emerging Markets Equity Active ETF | 8 995 | 113 | ||||||
| 2025-07-22 | 13F | Old National Bancorp /in/ | 10 675 | −0,68 | 134 | −13,64 | ||||
| 2025-08-05 | 13F | Fullcircle Wealth Llc | 14 525 | 17,14 | 185 | 30,28 | ||||
| 2025-08-11 | 13F | Sprott Inc. | 46 555 | 582 | ||||||
| 2025-08-13 | 13F | Cerity Partners LLC | 43 786 | 10,86 | 548 | −3,36 | ||||
| 2025-08-11 | 13F | Bell Investment Advisors, Inc | 207 | −68,45 | 3 | −77,78 | ||||
| 2025-08-28 | NP | NDOW - Anydrus Advantage ETF | 5 086 | 18,44 | 64 | 3,28 | ||||
| 2025-08-28 | NP | Amplify ETF Trust - Amplify Natural Resources Dividend Income ETF | 49 067 | 5,79 | 614 | −7,82 | ||||
| 2025-08-14 | 13F | Barometer Capital Management Inc. | 0 | −100,00 | 0 | |||||
| 2025-08-13 | 13F | Beacon Pointe Advisors, LLC | 45 061 | −8,82 | 564 | −20,48 | ||||
| 2025-08-14 | 13F | Bnp Paribas | 1 240 | 0,00 | 16 | −11,76 | ||||
| 2025-08-07 | 13F | Cypress Capital Management LLC (WY) | 4 | −99,99 | 0 | −100,00 | ||||
| 2025-07-10 | 13F | Wealth Enhancement Advisory Services, Llc | 90 935 | 1,20 | 1 188 | −7,84 | ||||
| 2025-08-28 | NP | RAPAX - Cohen & Steers Real Assets Fund, Inc. Class A | 81 891 | −1,29 | 1 024 | −13,88 | ||||
| 2025-03-28 | NP | GERIX - Goldman Sachs Emerging Markets Equity Insights Fund Institutional | 1 035 100 | 228,92 | 14 709 | 227,57 | ||||
| 2025-08-14 | 13F | Clark Capital Management Group, Inc. | 0 | −100,00 | 0 | |||||
| 2025-08-13 | 13F | Oaktree Fund Advisors, LLC | 0 | −100,00 | 0 | |||||
| 2025-05-22 | NP | OEQAX - Oaktree Emerging Markets Equity Fund Class A | 173 192 | −22,46 | 2 484 | −13,54 | ||||
| 2025-08-14 | 13F | Erste Asset Management GmbH | 20 000 | 248 | ||||||
| 2025-08-05 | 13F | Carrhae Capital LLP | 0 | −100,00 | 0 | |||||
| 2025-08-05 | 13F | Wellington Shields Capital Management, LLC | 10 000 | −50,00 | 125 | −56,29 | ||||
| 2025-06-26 | NP | FHKFX - Fidelity Series Emerging Markets Fund This fund is a listed as child fund of Fmr Llc and if that institution has disclosed ownership in this security, then these positions will not be double counted when calculating total shares and total value | 814 272 | −25,65 | 9 193 | −40,93 | ||||
| 2025-08-12 | 13F | Franklin Resources Inc | 800 654 | 79,61 | 10 016 | 56,70 | ||||
| 2025-08-14 | 13F | Vennlight Capital Management, LP | 162 000 | 2 027 | ||||||
| 2025-07-17 | 13F | SeaBridge Investment Advisors LLC | 116 031 | 26,62 | 1 452 | 10,43 | ||||
| 2025-08-11 | 13F | Empowered Funds, LLC | 29 979 | 375 | ||||||
| 2025-08-13 | 13F/A | StoneX Group Inc. | 0 | −100,00 | 0 | −100,00 | ||||
| 2025-08-14 | 13F | LMR Partners LLP | Put | 3 400 | −92,22 | 43 | −93,29 | |||
| 2025-08-14 | 13F | LMR Partners LLP | Call | 25 800 | −59,11 | 323 | −64,38 | |||
| 2025-05-15 | 13F | Qube Research & Technologies Ltd | 0 | −100,00 | 0 | −100,00 | ||||
| 2025-04-25 | 13F | Henry James International Management Inc. | 0 | −100,00 | 0 | |||||
| 2025-08-13 | 13F | Capital Fund Management S.a. | Call | 539 900 | 411,75 | 6 754 | 346,69 | |||
| 2025-08-13 | 13F | Capital Fund Management S.a. | Put | 148 200 | 1 854 | |||||
| 2025-05-15 | 13F | Qube Research & Technologies Ltd | Call | 0 | −100,00 | 0 | −100,00 | |||
| 2025-05-15 | 13F | Qube Research & Technologies Ltd | Put | 0 | −100,00 | 0 | −100,00 | |||
| 2025-08-07 | 13F | Teachers Retirement System Of The State Of Kentucky | 1 817 730 | 0,00 | 23 | −15,38 | ||||
| 2025-07-31 | 13F | Glass Jacobson Investment Advisors llc | 0 | −100,00 | 0 | |||||
| 2025-06-24 | NP | JEMA - JPMorgan Emerging Markets Equity Core ETF | 687 800 | 1 112,09 | 7 765 | 863,40 | ||||
| 2025-08-28 | NP | GQGPX - GQG PARTNERS EMERGING MARKETS EQUITY FUND Investor Shares | 61 035 997 | 5,06 | 763 560 | −8,35 | ||||
| 2025-08-13 | 13F | Marshall Wace, Llp | 5 874 953 | 73 496 | ||||||
| 2025-05-05 | 13F | Allianz Asset Management GmbH | 0 | −100,00 | 0 | |||||
| 2025-08-13 | 13F | Diametric Capital, LP | 10 336 | 129 | ||||||
| 2025-06-26 | NP | Dimensional Emerging Markets Value Fund - Dimensional Emerging Markets Value Fund This fund is a listed as child fund of Dimensional Fund Advisors Lp and if that institution has disclosed ownership in this security, then these positions will not be double counted when calculating total shares and total value | 1 849 041 | −3,30 | 20 876 | −23,17 | ||||
| 2025-07-17 | 13F | City Holding Co | 6 773 | 0,00 | 85 | −13,40 | ||||
| 2025-08-14 | 13F | Mariner, LLC | 33 273 | −18,61 | 416 | −29,01 | ||||
| 2025-08-13 | 13F | PACK Private Wealth, LLC | 13 661 | 27,27 | 171 | 11,11 | ||||
| 2025-07-23 | 13F | Tyche Wealth Partners LLC | 25 717 | 45,15 | 322 | 26,38 | ||||
| 2025-08-13 | 13F | CMT Capital Markets Trading GmbH | 168 984 | 106,02 | 2 | 100,00 | ||||
| 2025-08-08 | 13F | Fiera Capital Corp | 0 | −100,00 | 0 | |||||
| 2025-08-08 | 13F/A | Ignite Planners, LLC | 19 511 | −74,60 | 234 | −73,13 | ||||
| 2025-08-13 | 13F | Employees Retirement System of Texas | 314 235 | −21,48 | 4 | −40,00 | ||||
| 2025-08-07 | 13F | Vise Technologies, Inc. | 42 699 | 25,90 | 534 | 22,48 | ||||
| 2025-07-29 | 13F | TrueMark Investments, LLC | 221 000 | 18,32 | 2 765 | 3,21 | ||||
| 2025-08-12 | 13F | Clear Street Markets Llc | 12 700 | 21,25 | 159 | 5,33 | ||||
| 2025-08-14 | 13F | Fmr Llc | 32 413 971 | 1,10 | 405 499 | −11,80 | ||||
| 2025-08-08 | 13F | Candriam Luxembourg S.C.A. | 33 041 | 0,00 | 413 | −12,68 | ||||
| 2025-08-28 | NP | SPEM - SPDR(R) Portfolio Emerging Markets ETF | 2 340 163 | 8,72 | 29 275 | −5,15 | ||||
| 2025-04-28 | 13F | Redmont Wealth Advisors Llc | 0 | −100,00 | 0 | |||||
| 2025-07-30 | 13F | Eqis Capital Management, Inc. | 0 | −100,00 | 0 | |||||
| 2025-07-16 | 13F | Kathmere Capital Management, LLC | 33 966 | 37,04 | 425 | 19,44 | ||||
| 2025-08-22 | NP | VARIABLE INSURANCE PRODUCTS FUND II - Emerging Markets Portfolio Initial Class | 1 556 947 | 33,48 | 19 477 | 16,45 | ||||
| 2025-05-02 | 13F | Capital A Wealth Management, LLC | 637 | 0,00 | 9 | 12,50 | ||||
| 2025-08-14 | 13F | Macquarie Group Ltd | 5 018 966 | 4,77 | 62 787 | −8,60 | ||||
| 2025-05-06 | 13F | Winch Advisory Services, LLC | 0 | −100,00 | 0 | |||||
| 2025-08-12 | 13F | Evelyn Partners Investment Management LLP | 14 910 | 0,00 | 10 | −9,09 | ||||
| 2025-09-05 | 13F | Abn Amro Investment Solutions | 0 | −100,00 | 0 | −100,00 | ||||
| 2025-06-18 | NP | RAZAX - Multi-Asset Growth Strategy Fund Class A | 42 504 | 0,00 | 480 | −20,56 | ||||
| 2025-08-13 | 13F | Hsbc Holdings Plc | 873 924 | 31,49 | 10 932 | 14,70 | ||||
| 2025-08-13 | 13F | Hsbc Holdings Plc | Call | 186 700 | −6,79 | 2 336 | −19,04 | |||
| 2025-08-13 | 13F | Hsbc Holdings Plc | Put | 544 500 | −11,71 | 6 812 | −23,30 | |||
| 2025-07-14 | 13F | Kapitalo Investimentos Ltda | 87 293 | 1 092 | ||||||
| 2025-08-13 | 13F | Twin Peaks Wealth Advisors, LLC | 67 | 1 | ||||||
| 2025-07-28 | NP | AVEM - Avantis Emerging Markets Equity ETF This fund is a listed as child fund of American Century Companies Inc and if that institution has disclosed ownership in this security, then these positions will not be double counted when calculating total shares and total value | 2 412 680 | 21,11 | 27 842 | 4,69 | ||||
| 2025-06-26 | NP | FAMKX - Fidelity Advisor Emerging Markets Fund Class A This fund is a listed as child fund of Fmr Llc and if that institution has disclosed ownership in this security, then these positions will not be double counted when calculating total shares and total value | 10 908 047 | 58,80 | 123 152 | 26,17 | ||||
| 2025-05-12 | 13F | Virtu Financial LLC | 0 | −100,00 | 0 | −100,00 | ||||
| 2025-08-12 | 13F | CIBC Private Wealth Group, LLC | 508 | −29,64 | 6 | −25,00 | ||||
| 2025-07-18 | 13F | Truist Financial Corp | 33 213 | 83,30 | 415 | 60,23 | ||||
| 2025-07-25 | 13F | Sovereign Financial Group, Inc. | 10 617 | 0,00 | 133 | −13,16 | ||||
| 2025-05-14 | 13F | Greenwoods Asset Management Hong Kong Ltd. | 0 | −100,00 | 0 | |||||
| 2025-07-25 | NP | DEMAX - Delaware Emerging Markets Fund Class A | 3 200 000 | 0,00 | 36 928 | −13,56 | ||||
| 2025-08-06 | 13F | Prospera Financial Services Inc | 30 523 | 5,25 | 382 | −8,19 | ||||
| 2025-07-25 | NP | NRES - Xtrackers RREEF Global Natural Resources ETF | 23 155 | 186,18 | 267 | 117,07 | ||||
| 2025-08-13 | 13F | Walleye Capital LLC | Put | 45 500 | 105,88 | 569 | 80,06 | |||
| 2025-08-13 | 13F | Walleye Capital LLC | 84 985 | −65,96 | 1 063 | −70,31 | ||||
| 2025-08-13 | 13F | Walleye Capital LLC | Call | 21 000 | 412,20 | 263 | 351,72 | |||
| 2025-08-08 | 13F | North of South Capital LLP | 113 724 | −36,24 | 1 423 | −44,39 | ||||
| 2025-07-14 | 13F | GAMMA Investing LLC | 895 | −3,14 | 11 | −15,38 | ||||
| 2025-08-14 | 13F | Dark Forest Capital Management Lp | 49 950 | 625 | ||||||
| 2025-08-14 | 13F | Warren Averett Asset Management, LLC | 11 500 | −8,33 | 144 | −20,11 | ||||
| 2025-07-21 | 13F | Patriot Financial Group Insurance Agency, LLC | 12 216 | 3,52 | 153 | −10,06 | ||||
| 2025-06-23 | NP | UBPIX - Ultralatin America Profund Investor Class | 37 098 | −1,32 | 419 | −21,72 | ||||
| 2025-08-28 | NP | SPGM - SPDR(R) Portfolio MSCI Global Stock Market ETF | 21 645 | 2,95 | 271 | −10,30 | ||||
| 2025-08-05 | 13F | Huntington National Bank | 5 498 | 12,07 | 69 | −2,86 | ||||
| 2025-07-28 | 13F | Morningstar Investment Management LLC | 298 508 | 23,83 | 4 | 0,00 | ||||
| 2025-08-08 | 13F | Principal Financial Group Inc | 33 628 | −43,28 | 421 | −50,59 | ||||
| 2025-08-27 | NP | Jnl Series Trust - Jnl/lazard Emerging Markets Fund (a) | 824 875 | 11,90 | 10 319 | −2,38 | ||||
| 2025-07-15 | 13F | Cranbrook Wealth Management, LLC | 600 | 0,00 | 8 | −12,50 | ||||
| 2025-07-25 | NP | BRXAX - MFS Blended Research International Equity Fund A | 476 635 | 9,66 | 5 500 | −5,21 | ||||
| 2025-06-11 | NP | SLANX - DWS Latin America Equity Fund Class A | 288 100 | −15,24 | 3 253 | −32,66 | ||||
| 2025-04-23 | 13F | KG&L Capital Management,LLC | 0 | −100,00 | 0 | −100,00 | ||||
| 2025-08-14 | 13F | Boston Private Wealth Llc | 0 | −100,00 | 0 | |||||
| 2025-08-14 | 13F | Wetherby Asset Management Inc | 40 251 | −8,06 | 504 | −10,50 | ||||
| 2025-08-20 | NP | NATIONWIDE VARIABLE INSURANCE TRUST - NVIT GS Emerging Markets Equity Insights Fund Class Y | 32 550 | −58,22 | 407 | −59,34 | ||||
| 2025-08-13 | 13F | Avestar Capital, LLC | 33 045 | 3,13 | 413 | −10,02 | ||||
| 2025-08-26 | NP | IXC - iShares Global Energy ETF | 1 228 794 | 1,86 | 15 372 | −11,13 | ||||
| 2025-05-01 | 13F | Schechter Investment Advisors, LLC | 0 | −100,00 | 0 | −100,00 | ||||
| 2025-08-11 | 13F | Banque Cantonale Vaudoise | 7 495 | 0 | ||||||
| 2025-08-26 | NP | EQ ADVISORS TRUST - EQ/Lazard Emerging Markets Equity Portfolio Class IB | 471 052 | −17,23 | 5 893 | −27,79 | ||||
| 2025-06-27 | NP | PCEMX - PACE International Emerging Markets Equity Investments Class P | 362 697 | 4,78 | 4 095 | −16,75 | ||||
| 2025-08-14 | 13F | Parvin Asset Management, LLC | 9 200 | 39,39 | 115 | 22,34 | ||||
| 2025-07-24 | 13F | Us Bancorp \de\ | 106 002 | 5,62 | 1 326 | −7,85 | ||||
| 2025-08-06 | 13F | True Wealth Design, LLC | 155 | −13,41 | 2 | −50,00 | ||||
| 2025-08-14 | 13F | DRW Securities, LLC | 76 149 | −41,11 | 953 | −48,65 | ||||
| 2025-08-11 | 13F | Nomura Asset Management Co Ltd | 60 687 | −5,62 | 759 | −17,68 | ||||
| 2025-07-30 | 13F | FNY Investment Advisers, LLC | 12 500 | 448,25 | 0 | |||||
| 2025-08-12 | 13F | Mizuho Securities Co. Ltd. | 200 | −33,33 | 3 | −50,00 | ||||
| 2025-08-01 | 13F | James Investment Research Inc | 26 586 | 0,00 | 333 | −12,86 | ||||
| 2025-08-12 | 13F | American Century Companies Inc | 2 663 898 | 17,21 | 33 325 | 2,25 | ||||
| 2025-07-30 | 13F | Financial Perspectives, Inc | 1 764 | 0,00 | 22 | −12,00 | ||||
| 2025-08-01 | 13F | Banco Santander, S.A. | 293 961 | 89,35 | 3 677 | 65,18 | ||||
| 2025-08-15 | 13F/A | MONECO Advisors, LLC | 0 | −100,00 | 0 | |||||
| 2025-08-14 | 13F/A | Skopos Labs, Inc. | 23 258 | 76,45 | 291 | 53,44 | ||||
| 2025-07-14 | 13F | AdvisorNet Financial, Inc | 268 | −61,60 | 3 | −70,00 | ||||
| 2025-08-13 | 13F | PineBridge Investments, L.P. | 202 110 | 0,00 | 2 528 | −12,77 | ||||
| 2025-07-23 | 13F | Nbt Bank N A /ny | 2 000 | −11,50 | 25 | −21,87 | ||||
| 2025-08-28 | NP | GNR - SPDR(R) S&P(R) Global Natural Resources ETF | 1 282 173 | 1,11 | 16 040 | −11,79 | ||||
| 2025-07-30 | 13F | Legacy Wealth Asset Management, LLC | 39 667 | 2,97 | 496 | −10,14 | ||||
| 2025-08-21 | NP | Thornburg Income Builder Opportunities Trust | 302 585 | 0,00 | 3 785 | −12,77 | ||||
| 2025-08-14 | 13F | Parallax Volatility Advisers, L.P. | 14 578 | 182 | ||||||
| 2025-03-31 | NP | VMNVX - Vanguard Global Minimum Volatility Fund Admiral Shares | 29 677 | −15,54 | 422 | −29,36 | ||||
| 2025-08-13 | 13F | Centiva Capital, LP | 69 415 | 868 | ||||||
| 2025-08-26 | NP | ILF - iShares Latin America 40 ETF | 6 527 485 | 9,44 | 81 659 | −4,53 | ||||
| 2025-06-17 | NP | GSIHX - Goldman Sachs GQG Partners International Opportunities Fund Class A Shares | 71 773 456 | 5,18 | 810 322 | −16,43 | ||||
| 2025-08-07 | NP | OTGAX - OTG Latin America Fund Class A Shares | 36 250 | 0,00 | 453 | −12,72 | ||||
| 2025-08-26 | NP | JOEMX - JOHCM Emerging Markets Opportunities Fund Class Z Shares | 1 459 835 | −1,50 | 18 263 | −14,07 | ||||
| 2025-08-20 | NP | NATIONWIDE VARIABLE INSURANCE TRUST - NVIT Emerging Markets Fund Class I | 191 000 | 20,66 | 2 389 | 5,24 | ||||
| 2025-07-07 | 13F | Wesbanco Bank Inc | 11 208 | 140 | ||||||
| 2025-08-14 | 13F | Group One Trading, L.p. | 2 342 809 | 127,71 | 29 309 | 98,66 | ||||
| 2025-08-08 | 13F | SG Americas Securities, LLC | 440 602 | −30,09 | 6 | −44,44 | ||||
| 2025-08-25 | NP | AMERICAN FUNDS INSURANCE SERIES - New World Fund Class 1 This fund is a listed as child fund of Capital World Investors and if that institution has disclosed ownership in this security, then these positions will not be double counted when calculating total shares and total value | 344 847 | 1 748,35 | 4 314 | 1 705,02 | ||||
| 2025-08-14 | 13F | Group One Trading, L.p. | Put | 13 400 | −99,32 | 155 | −99,45 | |||
| 2025-05-06 | 13F | ANTIPODES PARTNERS Ltd | 0 | −100,00 | 0 | −100,00 | ||||
| 2025-08-14 | 13F | Group One Trading, L.p. | Call | 3 700 | −99,55 | 43 | −99,64 | |||
| 2025-08-26 | NP | BGEHX - Baillie Gifford Emerging Markets Equities Fund Class 2 | 9 158 144 | −14,27 | 114 568 | −25,21 | ||||
| 2025-06-26 | NP | DEXC - Dimensional Emerging Markets ex China Core Equity ETF | 48 450 | 22,97 | 547 | −2,15 | ||||
| 2025-07-21 | 13F | Ping Capital Management, Inc. | 235 000 | 179,76 | 2 940 | 144,10 | ||||
| 2025-06-30 | NP | VT - Vanguard Total World Stock Index Fund ETF Shares | 179 623 | 0,00 | 2 028 | −20,57 | ||||
| 2025-08-11 | 13F | Principal Securities, Inc. | 9 689 | −65,52 | 121 | −66,48 | ||||
| 2025-07-21 | 13F | 25 Llc | 16 818 | 210 | ||||||
| 2025-07-30 | 13F | Cullen/frost Bankers, Inc. | 558 | 0,90 | 7 | −14,29 | ||||
| 2025-08-12 | 13F | Wood Tarver Financial Group, LLC | 221 | 0,00 | 0 | −100,00 | ||||
| 2025-08-13 | 13F | Guggenheim Capital Llc | 136 051 | 11,35 | 1 702 | −2,91 | ||||
| 2025-06-24 | NP | EQNAX - MFS Equity Income Fund A | 165 730 | 1 871 | ||||||
| 2025-06-27 | NP | MPEMX - MONDRIAN EMERGING MARKETS VALUE EQUITY FUND | 33 258 | −4,17 | 375 | −23,94 | ||||
| 2025-04-22 | 13F | E Six Thirteen, Llc | 0 | −100,00 | 0 | |||||
| 2025-08-12 | 13F | Eisler Capital Management Ltd. | 1 338 | 17 | ||||||
| 2025-08-07 | 13F | Payden & Rygel | 10 210 | 0,00 | 0 | |||||
| 2025-08-12 | 13F | Eisler Capital Management Ltd. | Call | 300 000 | 0,00 | 3 753 | −12,72 | |||
| 2025-08-12 | 13F | Eisler Capital Management Ltd. | Put | 600 000 | 0,00 | 7 506 | −12,73 | |||
| 2025-08-08 | 13F | Horrell Capital Management, Inc. | 500 | 0,00 | 6 | −14,29 | ||||
| 2025-08-14 | 13F | Jane Street Group, Llc | 0 | −100,00 | 0 | |||||
| 2025-06-18 | NP | RMYAX - Multi-Strategy Income Fund Class A | 17 713 | 0,33 | 200 | −20,40 | ||||
| 2025-08-14 | 13F | SWAN Capital LLC | 350 | 0,00 | 4 | −20,00 | ||||
| 2025-07-17 | 13F | Sound Income Strategies, LLC | 1 000 | 440,54 | 13 | 500,00 | ||||
| 2025-05-13 | 13F | Clear Street Markets Llc | Put | 0 | −100,00 | 0 | −100,00 | |||
| 2025-07-16 | 13F | FCG Investment Co | 36 176 | 453 | ||||||
| 2025-07-25 | 13F | Yousif Capital Management, Llc | 24 063 | −3,93 | 301 | −16,16 | ||||
| 2025-07-16 | 13F | Signaturefd, Llc | 30 254 | −23,69 | 378 | −33,45 | ||||
| 2025-04-24 | 13F | Boyd Wealth Management, LLC | 0 | −100,00 | 0 | |||||
| 2025-08-14 | 13F/A | Perritt Capital Management Inc | 226 | 0,00 | 3 | −33,33 | ||||
| 2025-08-13 | 13F | Natixis Advisors, L.p. | 1 240 362 | 34,90 | 16 | 15,38 | ||||
| 2025-07-25 | NP | PRDAX - Diversified Real Asset Fund Class A | 35 176 | 43,18 | 406 | 23,85 | ||||
| 2025-08-13 | 13F | Robotti Robert | 50 000 | 0,00 | 626 | −12,83 | ||||
| 2025-08-08 | 13F | Hartland & Co., LLC | 615 | 1,15 | 8 | −12,50 | ||||
| 2025-07-08 | 13F | Nbc Securities, Inc. | 1 021 | 2,10 | 0 | |||||
| 2025-08-13 | 13F | Capital Markets Trading UK LLP | 152 196 | −69,26 | 2 | −85,71 | ||||
| 2025-08-08 | 13F | Financial Gravity Companies, Inc. | 2 041 | −0,63 | 26 | −3,85 | ||||
| 2025-07-17 | 13F | Janney Montgomery Scott LLC | 31 441 | −7,70 | 0 | |||||
| 2025-08-28 | NP | GQRRX - GQG PARTNERS GLOBAL QUALITY EQUITY FUND R6 Shares | 1 442 684 | −43,26 | 18 048 | −50,50 | ||||
| 2025-07-07 | 13F | Investors Research Corp | 1 109 | 0,00 | 14 | −13,33 | ||||
| 2025-08-11 | 13F | Dorsey & Whitney Trust CO LLC | 0 | −100,00 | 0 | |||||
| 2025-08-13 | 13F | Qtron Investments LLC | 114 020 | 12,52 | 1 426 | −1,86 | ||||
| 2025-07-29 | 13F | Regions Financial Corp | 20 913 | 43,49 | 262 | 24,88 | ||||
| 2025-05-05 | 13F | Transce3nd, LLC | 0 | −100,00 | 0 | |||||
| 2025-08-14 | 13F | Vident Advisory, LLC | 106 770 | 38,54 | 1 336 | 20,81 | ||||
| 2025-08-19 | 13F | Marex Group plc | 48 151 | 602 | ||||||
| 2025-08-28 | NP | QEMM - SPDR MSCI Emerging Markets StrategicFactors ETF | 4 423 | −3,95 | 55 | −16,67 | ||||
| 2025-08-01 | 13F | Envestnet Asset Management Inc | 1 023 858 | −33,47 | 12 808 | −41,96 | ||||
| 2025-05-29 | NP | VICTORY VARIABLE INSURANCE FUNDS - Victory Sophus Emerging Markets VIP Series Class I | 18 035 | −10,43 | 259 | 0,00 | ||||
| 2025-07-10 | 13F | Oliver Lagore Vanvalin Investment Group | 1 001 | 0,00 | 14 | 16,67 | ||||
| 2025-07-24 | 13F | Ramirez Asset Management, Inc. | 87 | −99,97 | 1 | −99,98 | ||||
| 2025-08-14 | 13F | Integrated Wealth Concepts LLC | 56 486 | −6,16 | 707 | −18,19 | ||||
| 2025-03-31 | NP | FEMYX - Fidelity Series Sustainable Emerging Markets Fund | 1 464 | −24,18 | 21 | −20,00 | ||||
| 2025-07-16 | 13F | Eagle Global Advisors Llc | 82 100 | −10,86 | 1 027 | −22,20 | ||||
| 2025-08-11 | 13F | Artemis Investment Management LLP | 2 518 451 | −35,57 | 31 506 | −43,79 | ||||
| 2025-05-15 | 13F | CAPROCK Group, Inc. | 141 712 | 15,26 | 2 032 | 19,67 | ||||
| 2025-07-28 | 13F | Rosenberg Matthew Hamilton | 1 447 | −24,16 | 18 | −33,33 | ||||
| 2025-07-28 | 13F | Naviter Wealth, LLC | 23 231 | 291 | ||||||
| 2025-08-13 | 13F | Thornburg Investment Management Inc | 7 713 498 | −0,48 | 96 496 | −91,32 | ||||
| 2025-04-01 | NP | PRMSX - T. Rowe Price Emerging Markets Stock Fund This fund is a listed as child fund of Price T Rowe Associates Inc /md/ and if that institution has disclosed ownership in this security, then these positions will not be double counted when calculating total shares and total value | 3 513 636 | 27,56 | 49 929 | 34,77 | ||||
| 2025-08-12 | 13F | Dimensional Fund Advisors Lp | 3 053 286 | 4,08 | 38 177 | −9,26 | ||||
| 2025-08-13 | 13F | Townsquare Capital Llc | 0 | −100,00 | 0 | |||||
| 2025-08-14 | 13F | Sunbelt Securities, Inc. | 10 031 | 167 083,33 | 129 | |||||
| 2025-08-12 | 13F | XTX Topco Ltd | 159 382 | 1 994 | ||||||
| 2025-08-27 | NP | RYDEX VARIABLE TRUST - Energy Fund Variable Annuity | 10 167 | −7,97 | 127 | −19,62 | ||||
| 2025-04-01 | NP | RPGAX - T. Rowe Price Global Allocation Fund, Inc. This fund is a listed as child fund of Price T Rowe Associates Inc /md/ and if that institution has disclosed ownership in this security, then these positions will not be double counted when calculating total shares and total value | 23 100 | 30,51 | 328 | 37,82 | ||||
| 2025-07-24 | 13F | IFP Advisors, Inc | 978 | 10,38 | 12 | 0,00 | ||||
| 2025-05-15 | 13F | Cullen Capital Management, LLC | 2 506 251 | 50,10 | 35 940 | 67,37 | ||||
| 2025-07-22 | 13F | Diligent Investors, LLC | 0 | −100,00 | 0 | |||||
| 2025-08-06 | 13F | Commonwealth Equity Services, Llc | 253 816 | −7,87 | 3 | 0,00 | ||||
| 2025-07-22 | 13F | IMC-Chicago, LLC | Put | 82 300 | 155,59 | 1 030 | 123,21 | |||
| 2025-07-22 | 13F | IMC-Chicago, LLC | Call | 133 500 | 1,29 | 1 670 | −11,64 | |||
| 2025-08-11 | 13F | TD Waterhouse Canada Inc. | 30 | 0,00 | 0 | |||||
| 2025-07-15 | 13F | Colonial River Wealth Management, LLC | 19 240 | −6,05 | 247 | −16,04 | ||||
| 2025-07-30 | 13F | Bogart Wealth, LLC | 350 | 0,00 | 4 | −20,00 | ||||
| 2025-08-14 | 13F | Smartleaf Asset Management LLC | 86 | −64,02 | 1 | −66,67 | ||||
| 2025-06-26 | NP | NEWFX - NEW WORLD FUND INC Class A | 5 799 400 | 1 582,18 | 65 475 | 1 236,77 | ||||
| 2025-07-17 | 13F | Nelson, Van Denburg & Campbell Wealth Management Group, LLC | 13 434 | −66,84 | 168 | −71,03 | ||||
| 2025-07-28 | 13F | Ritholtz Wealth Management | 185 765 | −2,95 | 2 324 | −15,34 | ||||
| 2025-08-14 | 13F | Point72 Asset Management, L.P. | Put | 158 100 | 0,00 | 1 978 | −12,79 | |||
| 2025-08-14 | 13F | Point72 Asset Management, L.P. | 3 410 815 | −1,81 | 42 669 | −14,34 | ||||
| 2025-08-14 | 13F | Point72 Asset Management, L.P. | Call | 254 900 | −17,13 | 3 189 | −27,71 | |||
| 2025-08-21 | NP | LZOEX - Lazard Emerging Markets Equity Portfolio Open Shares | 3 884 396 | −10,32 | 48 594 | −21,76 | ||||
| 2025-08-26 | NP | BGEZX - Baillie Gifford Emerging Markets ex China Fund Class K | 1 958 | 0,00 | 24 | −14,29 | ||||
| 2025-08-12 | 13F | Centric Wealth Management | 31 699 | 384 | ||||||
| 2025-05-15 | 13F | Royal Bank Of Canada | Call | 0 | −100,00 | 0 | −100,00 | |||
| 2025-05-15 | 13F | Royal Bank Of Canada | Put | 0 | −100,00 | 0 | −100,00 | |||
| 2025-08-13 | 13F | Virtus Investment Advisers, Inc. | 13 126 | 14,19 | 164 | 0,00 | ||||
| 2025-08-14 | 13F | Millennium Management Llc | Call | 11 500 | −81,02 | 144 | −83,54 | |||
| 2025-08-14 | 13F | Millennium Management Llc | 1 396 748 | −71,97 | 17 473 | −75,55 | ||||
| 2025-08-13 | 13F | Channing Global Advisors, Llc | 140 | −36,65 | 2 | −66,67 | ||||
| 2025-08-14 | 13F | Millennium Management Llc | Put | 75 100 | −76,08 | 940 | −79,14 | |||
| 2025-06-26 | NP | MFWTX - MFS Global Total Return Fund A | 153 373 | 78,65 | 1 732 | 42,00 | ||||
| 2025-06-26 | NP | Dfa Investment Trust Co - The Emerging Markets Series This fund is a listed as child fund of Dimensional Fund Advisors Lp and if that institution has disclosed ownership in this security, then these positions will not be double counted when calculating total shares and total value | 142 561 | 0,00 | 1 610 | −20,54 | ||||
| 2025-08-14 | 13F | BI Asset Management Fondsmaeglerselskab A/S | 92 668 | 87,70 | 1 | |||||
| 2025-08-05 | 13F | Bank of New York Mellon Corp | 75 294 | −7,17 | 942 | −19,09 | ||||
| 2025-08-13 | 13F | Cresset Asset Management, LLC | 15 683 | 55,91 | 201 | 39,58 | ||||
| 2025-07-08 | 13F/A | Salem Investment Counselors Inc | 564 661 | 8,40 | 7 065 | −5,42 | ||||
| 2025-08-14 | 13F | Goldman Sachs Group Inc | Call | 1 720 000 | 9,55 | 21 517 | −4,42 | |||
| 2025-05-15 | 13F | Parallax Volatility Advisers, L.P. | Put | 0 | −100,00 | 0 | −100,00 | |||
| 2025-08-14 | 13F | Goldman Sachs Group Inc | 8 082 780 | 30,80 | 101 116 | 14,10 | ||||
| 2025-05-15 | 13F | Parallax Volatility Advisers, L.P. | Call | 0 | −100,00 | 0 | −100,00 | |||
| 2025-07-08 | 13F | Atwood & Palmer Inc | 327 | 0,00 | 4 | 0,00 | ||||
| 2025-08-13 | 13F | Continuum Advisory, LLC | 0 | −100,00 | 0 | |||||
| 2025-07-25 | NP | DWGAX - AMERICAN FUNDS DEVELOPING WORLD GROWTH & INCOME FUND Class A This fund is a listed as child fund of Capital World Investors and if that institution has disclosed ownership in this security, then these positions will not be double counted when calculating total shares and total value | 837 825 | −82,21 | 9 668 | −73,10 | ||||
| 2025-08-07 | 13F | Altman Advisors, Inc. | 130 928 | 3,18 | 1 648 | 15,08 | ||||
| 2025-08-14 | 13F | Ancora Advisors, LLC | 472 | 6 | ||||||
| 2025-08-25 | NP | MEMX - Matthews Emerging Markets ex China Active ETF | 22 258 | −15,62 | 278 | −26,46 | ||||
| 2025-08-07 | 13F | HighPoint Advisor Group LLC | 0 | −100,00 | 0 | |||||
| 2025-03-26 | NP | FTLS - First Trust Long/Short Equity ETF This fund is a listed as child fund of First Trust Advisors Lp and if that institution has disclosed ownership in this security, then these positions will not be double counted when calculating total shares and total value | 506 190 | −36,19 | 7 193 | −32,59 | ||||
| 2025-08-13 | 13F | Arrowstreet Capital, Limited Partnership | 0 | −100,00 | 0 | |||||
| 2025-08-11 | 13F | Truffle Hound Capital, LLC | 0 | −100,00 | 0 | |||||
| 2025-08-14 | 13F | Goldman Sachs Group Inc | Put | 995 200 | −63,41 | 12 450 | −68,08 | |||
| 2025-08-14 | 13F | Atomi Financial Group, Inc. | 41 305 | −17,91 | 517 | −28,43 | ||||
| 2025-07-25 | 13F | Sequoia Financial Advisors, LLC | 19 560 | 245 | ||||||
| 2025-05-15 | 13F/A | Orion Portfolio Solutions, LLC | 79 655 | −13,51 | 1 142 | −3,55 | ||||
| 2025-07-31 | 13F | Oppenheimer Asset Management Inc. | 341 296 | 0,25 | 4 270 | −12,54 | ||||
| 2025-08-13 | 13F | Capital Fund Management S.a. | 307 194 | 3 843 | ||||||
| 2025-08-14 | 13F | Cohen & Steers, Inc. | 194 712 | −2,50 | 2 | 0,00 | ||||
| 2025-08-06 | 13F | Fox Run Management, L.l.c. | 0 | −100,00 | 0 | |||||
| 2025-08-13 | 13F | CMT Capital Markets Trading GmbH | Put | 593 500 | −30,08 | 7 | −41,67 | |||
| 2025-06-26 | NP | DFAE - Dimensional Emerging Core Equity Market ETF | 103 050 | 0,00 | 1 163 | −20,56 | ||||
| 2025-08-14 | 13F | Camden Capital, LLC | 250 000 | 66,67 | 3 128 | 45,37 | ||||
| 2025-08-13 | 13F | CMT Capital Markets Trading GmbH | Call | 413 700 | −16,78 | 5 | −28,57 | |||
| 2025-07-22 | 13F | Sava Infond d.o.o. | 23 000 | 0,00 | 288 | −12,77 | ||||
| 2025-05-29 | NP | GBEMX - Victory Sophus Emerging Markets Fund Class A | 230 145 | −23,26 | 3 300 | −14,42 | ||||
| 2025-07-25 | NP | USAWX - World Growth Fund Shares | 70 435 | −5,62 | 813 | −18,47 | ||||
| 2025-08-07 | 13F | Campbell & CO Investment Adviser LLC | 118 230 | 31,68 | 1 479 | 14,92 | ||||
| 2025-08-01 | 13F | Y-Intercept (Hong Kong) Ltd | 1 494 991 | 341,75 | 18 702 | 285,37 | ||||
| 2025-08-11 | 13F | Brown Brothers Harriman & Co | 129 | −99,50 | 2 | −99,72 | ||||
| 2025-08-14 | 13F | Jane Street Group, Llc | Put | 594 100 | −12,88 | 7 432 | −23,99 | |||
| 2025-07-22 | 13F | Simplicity Wealth,LLC | 52 000 | 651 | ||||||
| 2025-07-14 | 13F | Abound Wealth Management | 24 | −7,69 | 0 | |||||
| 2025-08-14 | 13F | Jane Street Group, Llc | Call | 1 437 300 | 264,89 | 17 981 | 218,34 | |||
| 2025-07-29 | 13F | Stratos Wealth Advisors, LLC | 10 352 | 130 | ||||||
| 2025-08-14 | 13F | Two Sigma Securities, Llc | 53 829 | 324,32 | 673 | 271,82 | ||||
| 2025-05-05 | 13F | Eagle Bay Advisors LLC | 0 | −100,00 | 0 | −100,00 | ||||
| 2025-08-06 | 13F | Csenge Advisory Group | 0 | −100,00 | 0 | |||||
| 2025-08-14 | 13F | Bank Of America Corp /de/ | 5 209 806 | −8,03 | 65 175 | −19,76 | ||||
| 2025-08-14 | 13F | Axa S.a. | 116 562 | 0,00 | 1 458 | −12,75 | ||||
| 2025-07-31 | 13F | Briaud Financial Planning, Inc | 50 | 0,00 | 0 | |||||
| 2025-08-12 | 13F | Inscription Capital, LLC | 0 | −100,00 | 0 | |||||
| 2025-08-14 | 13F | Sompo Japan Nipponkoa Asset Management Co.,ltd. | 0 | −100,00 | 0 | |||||
| 2025-08-14 | 13F | Wells Fargo & Company/mn | 992 048 | −15,09 | 12 411 | −25,93 | ||||
| 2025-08-18 | 13F | N.E.W. Advisory Services LLC | 0 | −100,00 | 0 | |||||
| 2025-07-16 | 13F | Brave Asset Management Inc | 15 793 | 198 | ||||||
| 2025-07-22 | 13F | Checchi Capital Advisers, LLC | 24 866 | −6,04 | 311 | −17,94 | ||||
| 2025-08-12 | 13F | Global Retirement Partners, LLC | 91 093 | 651,47 | 1 140 | 634,84 | ||||
| 2025-08-14 | 13F | Gotham Asset Management, LLC | 50 719 | 126,23 | 634 | 97,51 | ||||
| 2025-08-14 | 13F | Stifel Financial Corp | 183 385 | −2,77 | 2 294 | −15,16 | ||||
| 2025-08-26 | NP | SBHEX - Segall Bryant & Hamill Emerging Markets Fund Retail Class | 24 700 | 0,00 | 309 | −12,99 | ||||
| 2025-07-17 | 13F | Wolff Wiese Magana Llc | 5 000 | 0,00 | 63 | −12,68 | ||||
| 2025-06-26 | NP | MSTFX - Morningstar International Equity Fund | 205 024 | 186,29 | 2 315 | 186,39 | ||||
| 2025-08-12 | 13F | J.w. Cole Advisors, Inc. | 11 515 | 144 | ||||||
| 2025-08-04 | 13F | Strs Ohio | 37 465 | 0,00 | 469 | −12,85 | ||||
| 2025-08-12 | 13F | Ameraudi Asset Management, Inc. | 13 850 | 0,00 | 173 | −12,63 | ||||
| 2025-08-14 | 13F | Wealth Preservation Advisors, LLC | 0 | −100,00 | 0 | |||||
| 2025-07-09 | 13F | Radnor Capital Management, LLC | 50 300 | 0,00 | 1 | |||||
| 2025-08-14 | 13F | Royal Bank Of Canada | 558 142 | 46,05 | 6 982 | 27,41 | ||||
| 2025-08-13 | 13F | Capital Markets Trading UK LLP | Put | 1 227 300 | 3,20 | 15 | −11,76 | |||
| 2025-07-15 | 13F | SJS Investment Consulting Inc. | 653 | 0,00 | 8 | −11,11 | ||||
| 2025-08-13 | 13F | Capital Markets Trading UK LLP | Call | 546 800 | −28,53 | 7 | −40,00 | |||
| 2025-07-25 | 13F | Cwm, Llc | 4 802 | −20,07 | 0 | |||||
| 2025-05-06 | 13F | Venturi Wealth Management, LLC | 0 | −100,00 | 0 | |||||
| 2025-08-13 | 13F | Contrarian Capital Management, L.l.c. | 1 928 173 | −50,64 | 24 121 | −56,94 | ||||
| 2025-08-25 | NP | MFS VARIABLE INSURANCE TRUST II - MFS Emerging Markets Equity Portfolio Initial Class | 38 139 | 34,84 | 477 | 17,78 | ||||
| 2025-07-11 | 13F | Kingstone Capital Partners Texas, LLC | 11 556 690 | 148 | ||||||
| 2025-05-14 | 13F | Legacy Financial Advisors, Inc. | 0 | −100,00 | 0 | |||||
| 2025-07-24 | 13F | Comprehensive Money Management Services LLC | 20 455 | 0,00 | 256 | −12,97 | ||||
| 2025-08-11 | 13F | NewEdge Wealth, LLC | 0 | −100,00 | 0 | |||||
| 2025-08-11 | 13F | Frank, Rimerman Advisors LLC | 35 055 | 439 | ||||||
| 2025-07-21 | 13F | Matthews International Capital Management Llc | 23 829 | −14,74 | 298 | −25,50 | ||||
| 2025-08-29 | NP | JAVAX - James Aggressive Allocation Fund | 20 000 | 0,00 | 250 | −12,59 | ||||
| 2025-08-04 | 13F | Migdal Insurance & Financial Holdings Ltd. | 2 180 | 0,00 | 0 | |||||
| 2025-08-18 | 13F | Geneos Wealth Management Inc. | 2 438 | 74,89 | 30 | 57,89 | ||||
| 2025-08-13 | 13F | Northwestern Mutual Wealth Management Co | 98 683 | 12,95 | 1 235 | −1,44 | ||||
| 2025-07-22 | 13F | Gsa Capital Partners Llp | 0 | −100,00 | 0 | |||||
| 2025-05-13 | 13F | Geode Capital Management, Llc | 0 | −100,00 | 0 | −100,00 | ||||
| 2025-08-14 | 13F | Mercer Global Advisors Inc /adv | 16 206 | −24,08 | 203 | −33,99 | ||||
| 2025-04-09 | 13F | American National Bank | 0 | −100,00 | 0 | |||||
| 2025-08-27 | NP | JNL SERIES TRUST - JNL/GQG Emerging Markets Equity Fund (A) | 2 105 491 | −2,22 | 26 340 | −14,70 | ||||
| 2025-07-30 | 13F | DekaBank Deutsche Girozentrale | 30 000 | 0,00 | 0 | |||||
| 2025-08-13 | 13F | Oaktree Capital Management Lp | 0 | −100,00 | 0 | −100,00 | ||||
| 2025-07-24 | 13F | Jfs Wealth Advisors, Llc | 466 | −54,98 | 6 | −64,29 | ||||
| 2025-05-05 | 13F | Lindbrook Capital, Llc | 16 587 | 2,52 | 238 | 13,94 | ||||
| 2025-07-15 | 13F | Public Employees Retirement System Of Ohio | 1 597 885 | −33,13 | 19 990 | −41,66 | ||||
| 2025-08-27 | 13F/A | Squarepoint Ops LLC | Put | 706 400 | −3,39 | 8 837 | −15,72 | |||
| 2025-08-27 | 13F/A | Squarepoint Ops LLC | 1 094 963 | 137,92 | 13 698 | 107,56 | ||||
| 2025-05-12 | 13F | Peapack Gladstone Financial Corp | 0 | −100,00 | 0 | |||||
| 2025-08-14 | 13F | Wiley Bros.-aintree Capital, Llc | 20 070 | −17,01 | 251 | −27,67 | ||||
| 2025-07-28 | 13F | J.Safra Asset Management Corp | 13 997 | 0,00 | 173 | −13,50 | ||||
| 2025-08-14 | 13F | Quantinno Capital Management LP | 53 897 | 35,05 | 674 | 17,83 | ||||
| 2025-07-28 | 13F | Ckw Financial Group | 59 | −74,79 | 0 | |||||
| 2025-08-26 | NP | Profunds - Profund Vp Emerging Markets | 31 777 | 11,17 | 398 | −2,93 | ||||
| 2025-07-08 | 13F | Northwest & Ethical Investments L.P. | 0 | −100,00 | 0 | −100,00 | ||||
| 2025-07-28 | 13F | Kiker Wealth Management, LLC | 5 718 | 158,27 | 72 | 129,03 | ||||
| 2025-07-24 | 13F | Financial Security Advisor, Inc. | 17 800 | 0,00 | 223 | −12,94 | ||||
| 2025-08-05 | 13F | Obermeyer Wood Investment Counsel, Lllp | 44 650 | −5,87 | 559 | −17,94 | ||||
| 2025-06-26 | NP | Elevation Series Trust - The Opal International Dividend Income ETF | 197 936 | 53,73 | 2 235 | 22,14 | ||||
| 2025-08-01 | 13F | Alexander Labrunerie & Co., Inc. | 10 050 | 0,00 | 126 | −13,19 | ||||
| 2025-08-01 | 13F | Rossby Financial, LCC | 10 705 | −0,09 | 134 | 8,13 | ||||
| 2025-06-26 | NP | FEMSX - Fidelity Series Emerging Markets Opportunities Fund This fund is a listed as child fund of Fmr Llc and if that institution has disclosed ownership in this security, then these positions will not be double counted when calculating total shares and total value | 3 710 035 | −1,11 | 41 886 | −21,43 | ||||
| 2025-07-16 | 13F | Highline Wealth Partners Llc | 717 | −13,51 | 9 | −27,27 | ||||
| 2025-08-07 | 13F | Midwest Trust Co | 23 454 | 293 | ||||||
| 2025-08-13 | 13F | Amundi | 144 763 | 0,00 | 1 875 | −7,59 | ||||
| 2025-08-13 | 13F | Cloverfields Capital Group, Lp | 282 151 | 29,22 | 3 530 | 12,71 | ||||
| 2025-08-08 | 13F | Pnc Financial Services Group, Inc. | 32 919 | 29,67 | 412 | 12,91 | ||||
| 2025-04-21 | 13F | Envestnet Portfolio Solutions, Inc. | 0 | −100,00 | 0 | |||||
| 2025-08-13 | 13F | Ted Buchan & Co | 244 299 | 10,08 | 3 056 | −3,96 | ||||
| 2025-07-11 | 13F | Seacrest Wealth Management, Llc | 56 660 | −2,52 | 709 | −15,01 | ||||
| 2025-08-14 | 13F | Masters Capital Management Llc | 1 000 000 | 0,00 | 12 510 | −12,76 | ||||
| 2025-08-22 | NP | Columbia Funds Variable Series Trust II - Columbia Variable Portfolio - Emerging Markets Fund Class 3 | 386 360 | 93,87 | 4 833 | 69,16 | ||||
| 2025-08-08 | 13F | Creative Planning | 134 527 | −6,15 | 1 683 | −18,15 | ||||
| 2025-07-23 | 13F | High Note Wealth, LLC | 41 | 1 | ||||||
| 2025-08-28 | NP | IDVO - Amplify International Enhanced Dividend Income ETF | 254 540 | −17,92 | 3 184 | −28,40 | ||||
| 2025-08-11 | 13F | Anfield Capital Management, LLC | 7 322 | 0,00 | 92 | −12,50 | ||||
| 2025-06-26 | NP | TWAAX - Thrivent International Allocation Fund Class A | 7 420 | 0,00 | 84 | −20,95 | ||||
| 2025-08-26 | NP | NMMEX - Active M Emerging Markets Equity Fund | 74 700 | 6,56 | 934 | −7,06 | ||||
| 2025-08-07 | 13F | Profund Advisors Llc | 78 328 | −5,78 | 980 | −17,87 | ||||
| 2025-07-17 | 13F | Venture Visionary Partners LLC | 229 786 | 13,79 | 2 875 | −0,73 | ||||
| 2025-07-16 | 13F | ORG Partners LLC | 2 318 | 10,75 | 29 | −3,33 | ||||
| 2025-08-13 | 13F | Fisher Asset Management, LLC | 14 587 174 | −2,55 | 182 486 | −14,99 | ||||
| 2025-06-20 | NP | ABLD - Donoghue Forlines Yield Enhanced Real Asset ETF | 97 512 | 695,56 | 1 101 | 532,18 | ||||
| 2025-08-14 | 13F | Moneda S.A. Administradora General de Fondos | 510 578 | −21,41 | 6 387 | −31,43 | ||||
| 2025-08-15 | 13F | CI Private Wealth, LLC | 37 872 | −33,03 | 474 | −41,39 | ||||
| 2025-08-19 | 13F | Newbridge Financial Services Group, Inc. | 1 625 | 0,00 | 20 | −13,04 | ||||
| 2025-08-06 | 13F | Savant Capital, LLC | 11 199 | 140 | ||||||
| 2025-06-25 | NP | IMRFX - Columbia Global Opportunities Fund Class A | 24 416 | 95,77 | 276 | 55,37 | ||||
| 2025-08-12 | 13F | Pathstone Holdings, LLC | 30 828 | −22,02 | 386 | −32,10 | ||||
| 2025-05-14 | 13F | First Trust Advisors Lp | 0 | −100,00 | 0 | |||||
| 2025-07-15 | 13F | Ballentine Partners, LLC | 11 593 | −12,41 | 145 | −23,28 | ||||
| 2025-08-12 | 13F | Retirement Planning Co of New England, Inc. | 38 775 | 12,28 | 485 | −2,02 | ||||
| 2025-08-14 | 13F | Riggs Asset Managment Co. Inc. | 145 | 2 | ||||||
| 2025-08-27 | NP | VHGEX - Vanguard Global Equity Fund Investor Shares | 1 777 083 | 0,00 | 22 231 | −12,76 | ||||
| 2025-07-28 | NP | AVXC - Avantis Emerging Markets ex-China Equity ETF | 37 399 | 71,01 | 432 | 48,11 | ||||
| 2025-04-28 | NP | GBFFX - GMO Benchmark-Free Fund Class III | 27 | −99,11 | 0 | −100,00 | ||||
| 2025-08-28 | NP | ARMIX - ARGA EMERGING MARKETS VALUE FUND Institutional Shares | 1 267 747 | 0,00 | 15 860 | −12,76 | ||||
| 2025-05-15 | 13F | Tudor Investment Corp Et Al | Call | 0 | −100,00 | 0 | ||||
| 2025-08-14 | 13F | Toroso Investments, LLC | 49 067 | 5,79 | 614 | −7,82 | ||||
| 2025-04-30 | 13F | Sofos Investments, Inc. | 2 054 | 29 | ||||||
| 2025-08-13 | 13F | Flow Traders U.s. Llc | 23 964 | 17,30 | 0 | |||||
| 2025-08-13 | 13F | Walleye Trading LLC | Call | 12 400 | −94,94 | 155 | −95,59 | |||
| 2025-08-13 | 13F | Walleye Trading LLC | Put | 72 200 | −81,87 | 903 | −84,19 | |||
| 2025-08-11 | 13F | United Advisor Group, LLC | 16 429 | 59,47 | 206 | 39,46 | ||||
| 2025-08-13 | 13F | Walleye Trading LLC | 114 336 | 239,03 | 1 430 | 196,07 | ||||
| 2025-08-14 | 13F | Lazard Asset Management Llc | 19 139 752 | −12,51 | 239 | −23,64 | ||||
| 2025-08-07 | 13F | Sierra Ocean, Llc | 1 232 | 17,45 | 15 | 0,00 | ||||
| 2025-08-13 | 13F | Quadrature Capital Ltd | 325 492 | 4 074 | ||||||
| 2025-06-30 | NP | AIM INVESTMENT FUNDS (INVESCO INVESTMENT FUNDS) - Invesco Oppenheimer Global Allocation Fund Class R | 23 131 | 261 | ||||||
| 2025-08-14 | 13F | MIRAE ASSET GLOBAL ETFS HOLDINGS Ltd. | 48 238 | 46,83 | 603 | 28,03 | ||||
| 2025-08-14 | 13F | Hilltop Holdings Inc. | 13 265 | −12,10 | 166 | −23,61 | ||||
| 2025-08-14 | 13F | Horizon Investments, LLC | 0 | −100,00 | 0 | |||||
| 2025-07-30 | NP | APIE - ActivePassive International Equity ETF | 90 780 | −46,43 | 1 048 | −53,71 | ||||
| 2025-08-13 | 13F | Consultiva Wealth Management, Corp. | 1 000 | 0,00 | 13 | −14,29 | ||||
| 2025-04-01 | NP | IEMFX - T. Rowe Price Institutional Emerging Markets Equity Fund This fund is a listed as child fund of Price T Rowe Associates Inc /md/ and if that institution has disclosed ownership in this security, then these positions will not be double counted when calculating total shares and total value | 353 473 | 20,69 | 5 023 | 27,49 | ||||
| 2025-08-12 | 13F | SPX Equities Gestao de Recursos Ltda | 4 990 500 | 228,24 | 62 431 | 186,35 | ||||
| 2025-08-27 | NP | THRIVENT SERIES FUND INC - Thrivent Partner Emerging Markets Equity Portfolio Class A | 11 186 | 74,64 | 140 | 52,75 | ||||
| 2025-07-29 | 13F | Activest Wealth Management | 3 846 | 0,42 | 48 | −11,11 | ||||
| 2025-08-14 | 13F | D. E. Shaw & Co., Inc. | 3 147 889 | 363,47 | 39 380 | 304,35 | ||||
| 2025-08-14 | 13F | D. E. Shaw & Co., Inc. | Put | 86 000 | −33,02 | 1 076 | −41,61 | |||
| 2025-08-14 | 13F | D. E. Shaw & Co., Inc. | Call | 23 700 | 296 | |||||
| 2025-06-30 | NP | AIM INVESTMENT FUNDS (INVESCO INVESTMENT FUNDS) - Invesco Oppenheimer Developing Markets Fund Class R6 | 7 200 842 | 81 298 | ||||||
| 2025-08-11 | 13F | Poehling Capital Management, LLC | 236 251 | 3,43 | 2 956 | −9,77 | ||||
| 2025-07-14 | 13F | U.S. Capital Wealth Advisors, LLC | 15 200 | −1,52 | 190 | −14,03 | ||||
| 2025-08-14 | 13F | Bluefin Capital Management, Llc | 16 200 | 203 | ||||||
| 2025-08-14 | 13F | Bluefin Capital Management, Llc | Put | 10 900 | 0 | |||||
| 2025-08-27 | NP | RYEIX - Energy Fund Investor Class | 16 309 | 1,35 | 204 | −11,30 | ||||
| 2025-08-14 | 13F | Kovitz Investment Group Partners, LLC | 301 240 | 0,01 | 3 769 | −12,76 | ||||
| 2025-08-13 | 13F | Provida Pension Fund Administrator | 0 | −100,00 | 0 | −100,00 | ||||
| 2025-04-10 | 13F | Retireful, LLC | 0 | −100,00 | 0 | |||||
| 2025-07-10 | 13F | Sumitomo Mitsui DS Asset Management Company, Ltd | 16 000 | 0,00 | 200 | −12,66 | ||||
| 2025-08-05 | 13F | Sigma Planning Corp | 33 453 | −60,43 | 422 | −65,26 | ||||
| 2025-08-07 | 13F | Kestra Private Wealth Services, Llc | 16 184 | −26,40 | 202 | −35,87 | ||||
| 2025-08-12 | 13F | LPL Financial LLC | 339 767 | −13,38 | 4 250 | −24,43 | ||||
| 2025-07-30 | 13F | D.a. Davidson & Co. | 12 921 | 162 | ||||||
| 2025-08-27 | NP | TPIAX - Timothy Plan International Fund Class A | 81 500 | 0,00 | 1 020 | −12,76 | ||||
| 2025-07-25 | 13F | Allspring Global Investments Holdings, LLC | 1 187 462 | 6,91 | 14 950 | −6,91 | ||||
| 2025-08-05 | 13F | Bank Of Montreal /can/ | 60 163 | −1,50 | 753 | −14,06 | ||||
| 2025-08-07 | 13F | Zurcher Kantonalbank (Zurich Cantonalbank) | 59 346 | 12,03 | 742 | −2,24 | ||||
| 2025-08-13 | 13F | Russell Investments Group, Ltd. | 3 179 796 | −26,17 | 39 695 | −35,73 | ||||
| 2025-07-25 | 13F | Richardson Financial Services Inc. | 0 | −100,00 | 0 | |||||
| 2025-08-08 | 13F | Itau Unibanco Holding S.A. | Put | 0 | −100,00 | 0 | −100,00 | |||
| 2025-08-15 | 13F | Strategic Investment Advisors / MI | 17 296 | −5,38 | 216 | −17,56 | ||||
| 2025-07-21 | 13F | Ameritas Advisory Services, LLC | 304 | 4 | ||||||
| 2025-08-27 | NP | Brighthouse Funds Trust I - SSGA Emerging Markets Enhanced Index Portfolio Class B | 55 000 | 198,91 | 688 | 161,60 | ||||
| 2025-08-12 | 13F | Jpmorgan Chase & Co | Call | 1 100 000 | −39,59 | 13 761 | −47,30 | |||
| 2025-08-14 | 13F | CoreCommodity Management, LLC | 12 064 | 0,00 | 151 | −12,79 | ||||
| 2025-07-17 | 13F | Sonora Investment Management Group, LLC | 17 070 | 0,00 | 214 | −12,70 | ||||
| 2025-08-12 | 13F | Jpmorgan Chase & Co | Put | 1 177 500 | 6,80 | 14 731 | −6,83 | |||
| 2025-05-23 | NP | BGALX - Baillie Gifford Global Alpha Equities Fund Class 4 | 351 380 | 0,00 | 5 039 | 11,51 | ||||
| 2025-08-07 | 13F | Fidelis Capital Partners, LLC | 12 306 | 0,00 | 160 | 13,48 | ||||
| 2025-08-13 | 13F | Dodge & Cox | 30 400 | 7,04 | 380 | −6,63 | ||||
| 2025-08-12 | 13F | Jpmorgan Chase & Co | 9 333 230 | 20,33 | 116 759 | 4,98 | ||||
| 2025-08-25 | NP | AEPGX - EUROPACIFIC GROWTH FUND Class A | 7 277 197 | 75,95 | 91 038 | 112,88 | ||||
| 2025-08-25 | NP | AMERICAN FUNDS INSURANCE SERIES - International Growth and Income Fund Class 1 This fund is a listed as child fund of Capital World Investors and if that institution has disclosed ownership in this security, then these positions will not be double counted when calculating total shares and total value | 30 053 | 376 | ||||||
| 2025-08-07 | 13F | Nwam Llc | 26 688 | 345 | ||||||
| 2025-07-23 | 13F | Heck Capital Advisors, LLC | 0 | −100,00 | 0 | |||||
| 2025-08-06 | 13F | Stokes Family Office, LLC | 10 000 | 0,00 | 125 | −12,59 | ||||
| 2025-08-08 | 13F | Itau Unibanco Holding S.A. | Call | 0 | −100,00 | 0 | −100,00 | |||
| 2025-07-28 | NP | NSI - National Security Emerging Markets Index ETF | 7 098 | 38,42 | 82 | 19,12 | ||||
| 2025-06-26 | NP | FSGEX - Fidelity Series Global ex U.S. Index Fund This fund is a listed as child fund of Fmr Llc and if that institution has disclosed ownership in this security, then these positions will not be double counted when calculating total shares and total value | 9 | −99,99 | 0 | −100,00 | ||||
| 2025-08-25 | NP | IGAAX - International Growth and Income Fund Class A | 1 283 857 | 538,49 | 16 061 | 1 353,48 | ||||
| 2025-07-28 | 13F | Harbour Investments, Inc. | 2 379 | 0,63 | 30 | −12,12 | ||||
| 2025-08-13 | 13F | RWC Asset Management LLP | 1 959 567 | 6,79 | 24 514 | −6,84 | ||||
| 2025-05-09 | 13F | GeoWealth Management, LLC | 0 | −100,00 | 0 | |||||
| 2025-08-11 | 13F | FSA Wealth Management LLC | 68 | 1 | ||||||
| 2025-08-05 | 13F | Cherry Tree Wealth Management, LLC | 0 | −100,00 | 0 | |||||
| 2025-08-21 | NP | TIBAX - Thornburg Investment Income Builder Fund - Class A | 7 310 155 | 0,00 | 91 450 | −12,76 | ||||
| 2025-06-26 | NP | MSTSX - Morningstar Unconstrained Allocation Fund | 60 127 | −2,16 | 679 | −22,34 | ||||
| 2025-07-31 | 13F | ARGA Investment Management, LP | 11 036 110 | 0,00 | 138 062 | −12,76 | ||||
| 2025-08-13 | 13F | Capital International Inc /ca/ | 887 626 | 11 104 | ||||||
| 2025-08-13 | 13F | OMERS ADMINISTRATION Corp | 0 | −100,00 | 0 | |||||
| 2025-08-08 | 13F | JBF Capital, Inc. | 50 000 | 7,53 | 577 | −4,79 | ||||
| 2025-08-13 | 13F | Everstar Asset Management, LLC | 13 752 | 172 | ||||||
| 2025-07-28 | NP | TEMUX - Emerging Markets Equity Fund | 88 012 | −20,24 | 1 016 | −31,09 | ||||
| 2025-04-22 | 13F | Synergy Financial Management, LLC | 0 | −100,00 | 0 | |||||
| 2025-08-12 | 13F | SRS Capital Advisors, Inc. | 498 | 6 | ||||||
| 2025-08-14 | 13F | First Manhattan Co | 144 509 | −0,91 | 1 854 | −11,33 | ||||
| 2025-08-12 | 13F | Insigneo Advisory Services, Llc | 199 384 | 9,85 | 2 494 | −4,15 | ||||
| 2025-08-12 | 13F | Deutsche Bank Ag\ | 1 582 608 | −4,61 | 19 798 | −16,78 | ||||
| 2025-08-13 | 13F | West Family Investments, Inc. | 21 892 | 1,02 | 274 | −11,94 | ||||
| 2025-08-14 | 13F | Citadel Advisors Llc | Put | 1 034 800 | −8,26 | 12 945 | −19,97 | |||
| 2025-08-14 | 13F | Citadel Advisors Llc | 68 013 | −90,06 | 851 | −91,34 | ||||
| 2025-07-25 | NP | EEMAX - Columbia Emerging Markets Fund Class A | 534 812 | 116,85 | 6 172 | 87,45 | ||||
| 2025-08-13 | 13F | Capital International Sarl | 39 177 | 490 | ||||||
| 2025-08-07 | 13F | Hennion & Walsh Asset Management, Inc. | 36 653 | −23,97 | 459 | −33,72 | ||||
| 2025-08-14 | 13F | Citadel Advisors Llc | Call | 657 000 | −92,63 | 8 219 | −93,57 | |||
| 2025-05-15 | 13F | Platinum Investment Management Ltd | 0 | −100,00 | 0 | −100,00 | ||||
| 2025-08-13 | 13F | M&t Bank Corp | 30 012 | 138,34 | 375 | 108,33 | ||||
| 2025-08-14 | 13F | VPR Management LLC | 132 846 | 0,00 | 1 662 | −12,81 | ||||
| 2025-06-25 | NP | EMGAX - Wells Fargo Emerging Markets Equity Fund Class A | 522 079 | −7,12 | 5 894 | −26,21 | ||||
| 2025-07-11 | 13F | Annex Advisory Services, LLC | 1 856 898 | 2,11 | 23 230 | −10,92 | ||||
| 2025-07-31 | 13F | State of New Jersey Common Pension Fund D | 825 006 | −2,30 | 10 321 | −14,77 | ||||
| 2025-08-12 | 13F | Tocqueville Asset Management L.p. | 23 025 | −3,31 | 288 | −15,54 | ||||
| 2025-08-15 | 13F/A | Rakuten Securities, Inc. | 136 570 | 95,82 | 1 708 | 70,80 | ||||
| 2025-08-14 | 13F | CIBC World Markets Inc. | 55 551 | 16,50 | 695 | 1,61 | ||||
| 2025-08-07 | 13F | Rathbone Brothers plc | 11 110 | 139 | ||||||
| 2025-08-14 | 13F | IPG Investment Advisors LLC | 661 855 | 53,35 | 8 461 | 36,71 | ||||
| 2025-08-13 | 13F | Edgestream Partners, L.P. | 29 602 | 41,05 | 370 | 23,33 | ||||
| 2025-08-12 | 13F | MAI Capital Management | 4 947 | 164,83 | 62 | 134,62 | ||||
| 2025-08-19 | 13F | Advisory Services Network, LLC | 40 829 | 20,95 | 520 | 7,44 | ||||
| 2025-06-18 | NP | RTNAX - Tax-Managed International Equity Fund Class A | 572 426 | −35,05 | 6 463 | −48,40 | ||||
| 2025-07-14 | 13F | Ridgewood Investments LLC | Call | 16 000 | 12 | |||||
| 2025-07-09 | 13F | St. Louis Financial Planners Asset Management, LLC | 11 992 | −3,97 | 150 | −16,20 | ||||
| 2025-08-13 | 13F | Fairtree Asset Management (Pty) Ltd | 0 | −100,00 | 0 | |||||
| 2025-08-22 | NP | Fidelity Central Investment Portfolios LLC - Fidelity Emerging Markets Equity Central Fund This fund is a listed as child fund of Fmr Llc and if that institution has disclosed ownership in this security, then these positions will not be double counted when calculating total shares and total value | 425 800 | 1,70 | 5 327 | −11,29 | ||||
| 2025-08-21 | NP | MEMSX - Mercer Emerging Markets Equity Fund Class I | 298 861 | −34,51 | 3 739 | −42,87 | ||||
| 2025-08-14 | 13F | Ameriprise Financial Inc | 3 298 091 | 55,09 | 41 265 | 35,32 | ||||
| 2025-04-29 | NP | TAX - Cambria Tax Aware ETF | 876 | 12 | ||||||
| 2025-08-13 | 13F | Jump Financial, LLC | 1 813 746 | 22 690 | ||||||
| 2025-07-30 | NP | FGOMX - Strategic Advisers Fidelity Emerging Markets Fund This fund is a listed as child fund of Fmr Llc and if that institution has disclosed ownership in this security, then these positions will not be double counted when calculating total shares and total value | 5 542 396 | 54,52 | 63 959 | 33,57 | ||||
| 2025-07-28 | 13F | Moran Wealth Management, LLC | 438 047 | 8,01 | 5 480 | −5,78 | ||||
| 2025-08-14 | 13F | Ubs Asset Management Americas Inc | 7 636 325 | 11 246,69 | 95 530 | 9 799,48 | ||||
| 2025-06-26 | NP | HRLIX - The Hartford Global Real Asset Fund Class I | 35 708 | −32,89 | 403 | −46,69 | ||||
| 2025-08-14 | 13F | Quantitative Investment Management, LLC | 70 775 | 1 | ||||||
| 2025-08-04 | 13F | Arkadios Wealth Advisors | 16 711 | 46,32 | 209 | 28,22 | ||||
| 2025-08-11 | 13F | Citigroup Inc | Call | 280 000 | 0,00 | 3 503 | −12,78 | |||
| 2025-07-28 | NP | AVES - Avantis Emerging Markets Value ETF This fund is a listed as child fund of American Century Companies Inc and if that institution has disclosed ownership in this security, then these positions will not be double counted when calculating total shares and total value | 47 544 | 0,00 | 549 | −13,56 | ||||
| 2025-08-11 | 13F | Citigroup Inc | 685 339 | 109,84 | 8 574 | 83,07 | ||||
| 2025-08-11 | 13F | Citigroup Inc | Put | 620 000 | 0,00 | 7 756 | −12,76 | |||
| 2025-08-08 | 13F | Mitsubishi UFJ Trust & Banking Corp | 666 966 | −7,31 | 8 344 | −19,14 | ||||
| 2025-08-14 | 13F | CoreCap Advisors, LLC | 1 534 | 0,00 | 19 | −9,52 | ||||
| 2025-08-14 | 13F | RBF Capital, LLC | 120 000 | 0,00 | 1 501 | −12,73 | ||||
| 2025-08-05 | 13F | Fourth Dimension Wealth, LLC | 600 | 0,00 | 8 | −12,50 | ||||
| 2025-08-27 | NP | TPDAX - Timothy Plan Defensive Strategies Fund Class A | 12 064 | 0,00 | 151 | −12,79 | ||||
| 2025-08-28 | NP | GQJPX - GQG PARTNERS INTERNATIONAL QUALITY DIVIDEND INCOME FUND Investor Shares | 964 156 | 16,13 | 12 062 | 1,30 | ||||
| 2025-08-12 | 13F | Proequities, Inc. | 0 | 0 | ||||||
| 2025-08-07 | 13F | Acadian Asset Management Llc | 1 356 687 | 11 321,85 | 17 | |||||
| 2025-08-12 | 13F | Proequities, Inc. | Call | 0 | 0 | |||||
| 2025-08-14 | 13F | Bnp Paribas Arbitrage, Sa | Call | 11 797 | −46,51 | 14 758 | −53,34 | |||
| 2025-08-14 | 13F | Bnp Paribas Arbitrage, Sa | 1 043 445 | −39,86 | 13 053 | −47,54 | ||||
| 2025-08-14 | 13F | Bnp Paribas Arbitrage, Sa | Put | 9 971 | −63,40 | 12 474 | −68,07 | |||
| 2025-06-18 | NP | REMSX - Emerging Markets Fund Class S | 74 820 | 0,00 | 845 | −20,60 | ||||
| 2025-08-28 | NP | RWCIX - RWC Global Emerging Equity Fund Class I Shares | 399 399 | 31,80 | 4 996 | 14,98 | ||||
| 2025-08-14 | 13F | Peak6 Llc | Call | 1 038 700 | 27,92 | 12 994 | 11,59 | |||
| 2025-08-27 | 13F/A | Squarepoint Ops LLC | Call | 0 | −100,00 | 0 | −100,00 | |||
| 2025-08-06 | 13F | Vestmark Advisory Solutions, Inc. | 0 | −100,00 | 0 | |||||
| 2025-06-25 | NP | VRAI - Virtus Real Asset Income ETF | 10 995 | −3,31 | 124 | −22,98 | ||||
| 2025-08-04 | 13F | Atria Investments Llc | 27 814 | −16,73 | 348 | −27,41 | ||||
| 2025-08-11 | 13F | Covestor Ltd | 0 | −100,00 | 0 | |||||
| 2025-06-18 | NP | RTXAX - Tax-Managed Real Assets Fund Class A | 24 208 | 0,00 | 273 | −20,41 | ||||
| 2025-07-29 | NP | SEPIX - Energy & Basic Materials Portfolio Energy & Basic Materials Class I | 2 908 | −7,65 | 34 | −21,43 | ||||
| 2025-07-14 | 13F | Park Avenue Securities Llc | 16 919 | 0 | ||||||
| 2025-06-26 | NP | DFCEX - Emerging Markets Core Equity Portfolio - Institutional Class This fund is a listed as child fund of Dimensional Fund Advisors Lp and if that institution has disclosed ownership in this security, then these positions will not be double counted when calculating total shares and total value | 297 124 | −61,04 | 3 355 | −69,05 | ||||
| 2025-07-29 | NP | GIMFX - GMO Implementation Fund | 62 | −99,84 | 1 | −100,00 | ||||
| 2025-06-26 | NP | HFCVX - Hennessy Cornerstone Value Fund Investor Class | 398 900 | 0,00 | 4 504 | −20,55 | ||||
| 2025-08-18 | 13F | Wolverine Trading, Llc | Put | 85 000 | −44,95 | 1 052 | −52,61 | |||
| 2025-08-14 | 13F | State Street Corp | 5 330 598 | 3,25 | 68 377 | −7,64 | ||||
| 2025-08-18 | 13F | Wolverine Trading, Llc | 69 663 | 54,56 | 862 | 33,02 | ||||
| 2025-07-23 | 13F | Ameliora Wealth Management Ltd. | 4 000 | 0,00 | 50 | −12,28 | ||||
| 2025-07-25 | 13F | Atria Wealth Solutions, Inc. | 11 051 | 0,00 | 144 | −8,86 | ||||
| 2025-08-18 | 13F | Wolverine Trading, Llc | Call | 273 500 | 48,64 | 3 386 | 27,98 | |||
| 2025-05-16 | 13F/A | Kestra Investment Management, LLC | 0 | −100,00 | 0 | −100,00 | ||||
| 2025-08-14 | 13F | Banque Transatlantique SA | 0 | −100,00 | 0 | |||||
| 2025-07-29 | 13F | Private Trust Co Na | 0 | −100,00 | 0 | |||||
| 2025-08-12 | 13F | Longfellow Investment Management Co Llc | 210 216 | 0,00 | 2 630 | −12,77 | ||||
| 2025-07-15 | 13F | Fifth Third Bancorp | 49 554 | 0,72 | 620 | −12,20 | ||||
| 2025-08-11 | 13F | WPG Advisers, LLC | 144 | 0,00 | 2 | −50,00 | ||||
| 2025-08-13 | 13F | GQG Partners LLC | 221 361 832 | −13,56 | 2 769 237 | −24,59 | ||||
| 2025-08-14 | 13F | Raymond James Financial Inc | 447 104 | 21,64 | 5 593 | 6,13 | ||||
| 2025-08-26 | NP | EQ ADVISORS TRUST - EQ/Emerging Markets Equity PLUS Portfolio Class IB | 27 229 | −1,73 | 341 | −14,36 | ||||
| 2025-07-31 | 13F | Whipplewood Advisors, LLC | 2 875 | 45,72 | 36 | 2,94 | ||||
| 2025-06-26 | NP | HFIGX - Hartford Schroders Diversified Growth Fund Class I | 4 063 | 30,81 | 46 | 2,27 | ||||
| 2025-08-12 | 13F | Trexquant Investment LP | 655 875 | 8 205 | ||||||
| 2025-08-14 | 13F | Mml Investors Services, Llc | 52 422 | −24,15 | 1 | |||||
| 2025-08-15 | 13F | WealthCollab, LLC | 1 324 | 0,00 | 17 | −11,11 | ||||
| 2025-05-13 | 13F | Mondrian Investment Partners LTD | 9 255 391 | −0,97 | 132 722 | −0,07 | ||||
| 2025-07-31 | 13F | Nisa Investment Advisors, Llc | 2 200 | −12,00 | 28 | −22,86 | ||||
| 2025-07-25 | 13F | Hazlett, Burt & Watson, Inc. | 974 | 0 | ||||||
| 2025-08-14 | 13F | Parkwood LLC | 1 485 340 | 220,22 | 19 | 200,00 | ||||
| 2025-08-13 | 13F | Mackenzie Financial Corp | 122 000 | −90,19 | 1 526 | −91,44 | ||||
| 2025-08-14 | 13F | Ieq Capital, Llc | 32 098 | 77,68 | 402 | 54,83 | ||||
| 2025-08-19 | 13F | Cape Investment Advisory, Inc. | 100 | 0,00 | 1 | 0,00 | ||||
| 2025-05-05 | 13F | Creekmur Asset Management LLC | 0 | −100,00 | 0 | |||||
| 2025-06-27 | NP | DAINX - Dunham International Stock Fund Class A | 84 063 | −27,23 | 949 | −42,17 | ||||
| 2025-08-13 | 13F | EverSource Wealth Advisors, LLC | 2 704 | 108,48 | 34 | 83,33 | ||||
| 2025-05-15 | 13F | DZ BANK AG Deutsche Zentral Genossenschafts Bank, Frankfurt am Main | 0 | −100,00 | 0 | |||||
| 2025-08-13 | 13F | New York State Common Retirement Fund | 2 234 730 | 6,88 | 28 | −6,90 | ||||
| 2025-08-07 | 13F | Parkside Financial Bank & Trust | 1 169 | −32,00 | 15 | −41,67 | ||||
| 2025-06-30 | NP | CVY - Invesco Zacks Multi-Asset Income ETF This fund is a listed as child fund of Invesco Ltd. and if that institution has disclosed ownership in this security, then these positions will not be double counted when calculating total shares and total value | 78 708 | 889 | ||||||
| 2025-08-25 | NP | EMRGX - EMERGING MARKETS GROWTH FUND INC Class M | 95 534 | −19,53 | 1 195 | 18,79 | ||||
| 2025-08-12 | 13F | Proequities, Inc. | Put | 0 | 0 | |||||
| 2025-06-25 | NP | IEMGX - Voya Multi-Manager Emerging Markets Equity Fund Class I | 138 536 | 0,00 | 1 564 | −20,53 | ||||
| 2025-05-14 | 13F | Virtus ETF Advisers LLC | 0 | −100,00 | 0 | |||||
| 2025-07-30 | NP | BRAZ - Global X Brazil Active ETF | 50 488 | 103,15 | 583 | 75,83 | ||||
| 2025-08-14 | 13F | Driehaus Capital Management Llc | 0 | −100,00 | 0 | |||||
| 2025-06-30 | NP | VEU - Vanguard FTSE All-World ex-US Index Fund ETF Shares | 995 895 | 0,00 | 11 244 | −20,55 | ||||
| 2025-08-14 | 13F | Colony Group, LLC | 18 325 | −11,18 | 229 | −22,37 | ||||
| 2025-08-14 | 13F | UBS Group AG | 4 598 810 | 46,76 | 57 531 | 28,03 | ||||
| 2025-08-08 | 13F | Crossmark Global Holdings, Inc. | 84 156 | 3,61 | 1 053 | −9,62 | ||||
| 2025-06-26 | NP | DFEM - Dimensional Emerging Markets Core Equity 2 ETF | 77 872 | 0,00 | 879 | −20,52 | ||||
| 2025-08-15 | 13F | Binnacle Investments Inc | 672 | 4,84 | 8 | −11,11 | ||||
| 2025-08-29 | NP | Gabelli Dividend & Income Trust | 25 000 | 0,00 | 313 | −12,85 | ||||
| 2025-08-14 | 13F | UBS Group AG | Call | 7 445 940 | 19,82 | 93 149 | 4,53 | |||
| 2025-08-14 | 13F | UBS Group AG | Put | 2 590 900 | −19,94 | 32 412 | −30,15 | |||
| 2025-08-13 | 13F | Quantbot Technologies LP | 45 578 | −78,80 | 570 | −81,51 | ||||
| 2025-08-28 | NP | CSNR - Cohen & Steers Natural Resources Active ETF | 13 840 | 103,74 | 173 | 78,35 | ||||
| 2025-06-25 | NP | VVIFX - Voya VACS Series EME Fund | 172 150 | 0,00 | 1 944 | −20,56 | ||||
| 2025-06-26 | NP | SEMVX - Hartford Schroders Emerging Markets Equity Fund Class A | 4 342 982 | −26,89 | 49 032 | −41,92 | ||||
| 2025-08-12 | 13F | Ci Investments Inc. | 1 743 362 | 7,66 | 22 | −8,70 | ||||
| 2025-07-22 | 13F | Chung Wu Investment Group, LLC | 2 500 | 31 | ||||||
| 2025-07-18 | 13F | Bartlett & Co. Wealth Management Llc | 62 | 1 | ||||||
| 2025-08-15 | 13F | Tower Research Capital LLC (TRC) | 8 581 | 1 900,23 | 107 | 1 683,33 | ||||
| 2025-07-09 | 13F | Sapient Capital Llc | 14 743 | 1,29 | 189 | −9,13 | ||||
| 2025-08-05 | 13F | GHP Investment Advisors, Inc. | 0 | −100,00 | 0 | |||||
| 2025-07-29 | 13F | International Assets Investment Management, Llc | 11 534 | −11,71 | 144 | −22,99 | ||||
| 2025-08-14 | 13F | Aprio Wealth Management, LLC | 16 512 | 0,71 | 207 | −12,34 | ||||
| 2025-05-27 | NP | DREGX - DRIEHAUS EMERGING MARKETS GROWTH FUND Investor Share Class | 1 698 859 | −16,73 | 24 362 | −7,14 | ||||
| 2025-07-18 | 13F | Generali Investments CEE, investicni spolecnost, a.s. | 92 900 | 60,45 | 1 162 | 40,00 | ||||
| 2025-08-12 | 13F | Barings Llc | 73 545 | 0,00 | 920 | −12,71 | ||||
| 2025-06-26 | NP | DAADX - Emerging Markets ex China Core Equity Portfolio Institutional Class | 37 001 | 0,00 | 418 | −20,57 | ||||
| 2025-08-13 | 13F | Rsm Us Wealth Management Llc | 13 571 | 1,92 | 170 | −11,05 | ||||
| 2025-08-07 | 13F | Samalin Investment Counsel, LLC | 0 | −100,00 | 0 | |||||
| 2025-07-11 | 13F | Farther Finance Advisors, LLC | 25 491 | −25,71 | 319 | −35,89 | ||||
| 2025-08-14 | 13F | Breakout Capital Partners, LP | 1 172 682 | 0,00 | 14 670 | −12,76 | ||||
| 2025-08-13 | 13F | Renaissance Technologies Llc | 10 002 800 | 54,44 | 125 135 | 34,73 | ||||
| 2025-05-16 | 13F | Coppell Advisory Solutions LLC | 0 | −100,00 | 0 | |||||
| 2025-08-14 | 13F | Jain Global LLC | 55 655 | 696 | ||||||
| 2025-08-14 | 13F/A | Bank Julius Baer & Co. Ltd, Zurich | 170 000 | 13,02 | 2 127 | −12,76 | ||||
| 2025-08-14 | 13F | Wellington Management Group Llp | 696 155 | 4,41 | 8 709 | −8,92 | ||||
| 2025-07-21 | 13F | Ascent Group, LLC | 15 492 | −2,23 | 194 | −14,98 | ||||
| 2025-08-14 | 13F | GWM Advisors LLC | 18 792 | 797,85 | 235 | 683,33 | ||||
| 2025-08-12 | 13F | Coldstream Capital Management Inc | 0 | −100,00 | 0 | |||||
| 2025-04-09 | 13F | JTC Employer Solutions Trusteee Ltd | 0 | −100,00 | 0 | |||||
| 2025-08-14 | 13F | Evergreen Capital Management Llc | 71 248 | 565,25 | 895 | 484,97 | ||||
| 2025-07-18 | 13F | Union Bancaire Privee, UBP SA | 34 813 | 0,00 | 431 | −13,80 | ||||
| 2025-08-13 | 13F | Quadrant Capital Group Llc | 38 774 | 93,61 | 485 | 68,99 | ||||
| 2025-05-14 | 13F | Credit Agricole S A | 2 003 659 | 6,02 | 28 732 | 18,22 | ||||
| 2025-08-08 | 13F | D'Orazio & Associates, Inc. | 14 461 | 20,14 | 181 | 4,65 | ||||
| 2025-07-30 | 13F | Whittier Trust Co Of Nevada Inc | 50 345 | 44,76 | 630 | 26,31 | ||||
| 2025-08-15 | 13F | Kestra Advisory Services, LLC | 29 453 | 33,52 | 368 | 16,46 | ||||
| 2025-08-28 | NP | GQFPX - GQG PARTNERS GLOBAL QUALITY DIVIDEND INCOME FUND Investor Shares | 440 928 | 15,17 | 5 516 | 0,49 | ||||
| 2025-08-08 | 13F | Gts Securities Llc | 0 | −100,00 | 0 | |||||
| 2025-08-13 | 13F | Capital International Investors | 17 619 209 | 220 416 | ||||||
| 2025-08-12 | 13F | Zacks Investment Management | 10 323 | 0,00 | 129 | −12,84 | ||||
| 2025-08-13 | 13F | Level Four Advisory Services, Llc | 38 411 | 16,18 | 481 | 1,27 | ||||
| 2025-08-11 | 13F | United Capital Financial Advisers, Llc | 19 866 | −32,24 | 249 | −40,95 | ||||
| 2025-08-14 | 13F | Aspen Grove Capital, LLC | 13 212 | −15,77 | 170 | −24,55 | ||||
| 2025-07-11 | 13F | Perpetual Ltd | 3 261 657 | 1,51 | 40 803 | −11,45 | ||||
| 2025-07-31 | 13F | University Of Texas/texas Am Investment Managment Co | 0 | −100,00 | 0 | |||||
| 2025-08-11 | 13F | HHM Wealth Advisors, LLC | 500 | 0,00 | 6 | −14,29 | ||||
| 2025-08-04 | 13F | Hantz Financial Services, Inc. | 12 581 | 688,78 | 0 | |||||
| 2025-08-14 | 13F | Nfj Investment Group, Llc | 130 | −99,45 | 2 | −99,71 | ||||
| 2025-08-25 | NP | MMIUX - MassMutual Select T. Rowe Price International Equity Fund Class I | 15 426 | −32,71 | 193 | −41,46 | ||||
| 2025-07-08 | 13F | Parallel Advisors, LLC | 31 510 | −3,30 | 394 | −15,63 | ||||
| 2025-07-21 | 13F | Qrg Capital Management, Inc. | 43 258 | −15,69 | 541 | −26,39 | ||||
| 2025-08-12 | 13F | Aigen Investment Management, Lp | 0 | −100,00 | 0 | |||||
| 2025-08-11 | 13F | Vanguard Group Inc | 1 184 605 | 0,75 | 14 819 | −12,11 | ||||
| 2025-05-27 | NP | Brighthouse Funds Trust I - Brighthouse/Aberdeen Emerging Markets Equity Portfolio Class A | 36 600 | 0,00 | 525 | 11,49 | ||||
| 2025-08-13 | 13F | Victory Financial Group, Llc | 18 045 | 6,15 | 226 | −7,41 | ||||
| 2025-08-14 | 13F | Optiver Holding B.V. | Call | 87 300 | −98,95 | 1 007 | −99,07 | |||
| 2025-08-14 | 13F | Optiver Holding B.V. | Put | 141 300 | 42,15 | 1 631 | 25,77 | |||
| 2025-08-15 | 13F | Earnest Partners Llc | 3 206 568 | −1,12 | 40 114 | −13,74 | ||||
| 2025-08-14 | 13F | Optiver Holding B.V. | 5 814 209 | 19,75 | 72 736 | 4,47 | ||||
| 2025-05-09 | 13F | Vision Financial Markets Llc | 0 | −100,00 | 0 | |||||
| 2025-08-12 | 13F | one8zero8, LLC | 81 439 | 19,06 | 1 019 | 3,88 | ||||
| 2025-03-17 | NP | ABLG - TrimTabs All Cap International Free-Cash-Flow ETF | 121 361 | 137,78 | 1 725 | 151,31 | ||||
| 2025-07-23 | 13F | Sachetta, LLC | 5 100 | 142,86 | 64 | 110,00 | ||||
| 2025-07-29 | 13F | Foster & Motley Inc | 109 706 | −4,48 | 1 | 0,00 | ||||
| 2025-06-26 | NP | EEMGX - MFS Emerging Markets Equity Research Fund R4 | 784 | −50,00 | 9 | −63,64 | ||||
| 2025-05-15 | 13F | Integrated Quantitative Investments LLC | 0 | −100,00 | 0 | |||||
| 2025-07-25 | NP | MEMAX - MFS Emerging Markets Equity Fund A | 6 755 502 | 1,22 | 77 958 | −12,50 | ||||
| 2025-08-08 | NP | QGBLX - Quantified Global Fund Investor Class | 127 250 | 4 896,07 | 1 592 | 4 871,88 | ||||
| 2025-08-13 | 13F | Congress Wealth Management LLC / DE / | 33 966 | −2,44 | 425 | −14,86 | ||||
| 2025-08-07 | 13F | NS Partners Ltd | 0 | −100,00 | 0 | |||||
| 2025-08-12 | 13F | Wayfinding Financial, LLC | 0 | −100,00 | 0 | |||||
| 2025-08-28 | NP | Principal Diversified Select Real Asset Fund | 3 043 | 1,87 | 38 | −9,52 | ||||
| 2025-07-14 | 13F | UMA Financial Services, Inc. | 63 | 1 | ||||||
| 2025-07-30 | NP | LENS - Sarmaya Thematic ETF | 6 120 | 54,55 | 71 | 34,62 | ||||
| 2025-08-06 | 13F | Baillie Gifford & Co | 40 397 064 | −21,94 | 505 367 | −31,90 | ||||
| 2025-08-11 | 13F | Rwc Asset Advisors (us) Llc | 4 743 523 | 3,39 | 59 341 | −9,81 | ||||
| 2025-07-23 | 13F | Prime Capital Investment Advisors, LLC | 101 155 | 12,03 | 1 265 | −2,24 | ||||
| 2025-08-12 | 13F | Steward Partners Investment Advisory, Llc | 113 360 | 3,77 | 1 418 | −9,45 | ||||
| 2025-08-01 | 13F | Bessemer Group Inc | 14 415 | 0,00 | 0 | |||||
| 2025-08-13 | 13F | Blueshift Asset Management, LLC | 23 470 | 294 | ||||||
| 2025-08-01 | 13F | Financial Counselors Inc | 0 | −100,00 | 0 | |||||
| 2025-07-28 | 13F | BRYN MAWR TRUST Co | 3 672 | −6,56 | 46 | −19,64 | ||||
| 2025-08-01 | 13F | Redwood Park Advisors LLC | 4 248 | 14,72 | 53 | 0,00 | ||||
| 2025-07-15 | 13F | Td Private Client Wealth Llc | 20 086 | 15,31 | 251 | 0,80 | ||||
| 2025-08-12 | 13F | Park Square Financial Group, LLC | 243 | −61,79 | 3 | −66,67 | ||||
| 2025-08-07 | 13F | Capital Wealth Planning, LLC | 255 950 | −17,47 | 3 202 | −28,02 | ||||
| 2025-08-13 | 13F | Hudson Portfolio Management LLC | 18 850 | 0,00 | 236 | −12,96 | ||||
| 2025-08-14 | 13F | Aqr Capital Management Llc | 101 053 | −14,32 | 1 264 | −25,25 | ||||
| 2025-08-07 | 13F | Summit X, LLC | 0 | −100,00 | 0 | |||||
| 2025-07-30 | 13F | Blume Capital Management, Inc. | 50 | 1 | ||||||
| 2025-08-14 | 13F | Engineers Gate Manager LP | 88 617 | −22,26 | 1 109 | −32,19 | ||||
| 2025-08-13 | 13F | HAP Trading, LLC | Put | 10 500 | −16,67 | 4 | −40,00 | |||
| 2025-08-13 | 13F | HAP Trading, LLC | Call | 12 100 | −16,55 | 9 | −68,00 | |||
| 2025-08-08 | 13F | Larson Financial Group LLC | 3 000 | 200,00 | 38 | 164,29 | ||||
| 2025-05-14 | 13F | Capula Management Ltd | 0 | −100,00 | 0 | |||||
| 2025-07-18 | 13F | Deltec Asset Management Llc | 65 000 | 0,00 | 813 | −12,77 | ||||
| 2025-07-23 | 13F | Abel Hall, LLC | 15 500 | 194 | ||||||
| 2025-08-14 | 13F | Susquehanna International Group, Llp | 1 121 430 | −76,65 | 14 029 | −79,63 | ||||
| 2025-06-23 | 13F | RK Capital Management, LLC/FL | Put | 0 | −100,00 | 0 | −100,00 | |||
| 2025-06-23 | 13F | RK Capital Management, LLC/FL | 0 | −100,00 | 0 | −100,00 | ||||
| 2025-08-05 | 13F | Prosperity Consulting Group, LLC | 0 | −100,00 | 0 | |||||
| 2025-05-14 | 13F | Capula Management Ltd | Put | 0 | −100,00 | 0 | ||||
| 2025-03-24 | NP | NABAX - Neuberger Berman Absolute Return Multi-Manager Fund Class A | 4 913 | 16,73 | 70 | 16,95 | ||||
| 2025-08-14 | 13F | Verition Fund Management LLC | 433 881 | 113,80 | 5 428 | 86,49 | ||||
| 2025-08-14 | 13F | Sei Investments Co | 1 829 737 | 9,37 | 22 890 | −4,59 | ||||
| 2025-08-15 | 13F | Morgan Stanley | 8 687 560 | −12,49 | 108 681 | −23,66 | ||||
| 2025-08-14 | 13F | Point72 Hong Kong Ltd | 0 | −100,00 | 0 | |||||
| 2025-08-14 | 13F | Susquehanna International Group, Llp | Call | 4 597 000 | 11,57 | 57 508 | −2,67 | |||
| 2025-08-14 | 13F | Susquehanna International Group, Llp | Put | 7 707 000 | −17,86 | 96 415 | −28,34 | |||
| 2025-08-08 | 13F | Intrua Financial, LLC | 25 494 | 50,41 | 319 | 30,86 | ||||
| 2025-08-08 | 13F | Avantax Advisory Services, Inc. | 186 259 | 29,26 | 2 330 | 12,78 | ||||
| 2025-08-12 | 13F | Archer Investment Corp | 122 | 1,67 | 2 | 0,00 | ||||
| 2025-08-14 | 13F | Graham Capital Management, L.P. | 42 461 | 13,40 | 531 | −0,93 | ||||
| 2025-08-25 | 13F/A | Neuberger Berman Group LLC | 124 471 | 8,20 | 1 557 | −5,58 | ||||
| 2025-06-30 | NP | VMMSX - Vanguard Emerging Markets Select Stock Fund Investor Shares | 547 866 | −2,76 | 6 185 | −22,74 | ||||
| 2025-08-14 | 13F | Wells Fargo & Company/mn | Put | 0 | −100,00 | 0 | −100,00 | |||
| 2025-08-13 | 13F | Kilter Group LLC | 113 | 1 | ||||||
| 2025-07-10 | 13F | Perkins Coie Trust Co | 0 | −100,00 | 0 | |||||
| 2025-08-11 | 13F | Private Advisor Group, LLC | 189 225 | 0,89 | 2 367 | −11,97 | ||||
| 2025-07-28 | 13F | Sagespring Wealth Partners, Llc | 10 818 | −12,67 | 135 | −23,73 | ||||
| 2025-08-14 | 13F | Kerrisdale Advisers, LLC | 111 126 | 0,00 | 1 390 | −12,74 | ||||
| 2025-08-14 | 13F | USS Investment Management Ltd | 894 094 | 0,00 | 11 190 | −12,70 | ||||
| 2025-05-13 | 13F | Ethos Financial Group, LLC | 0 | −100,00 | 0 | |||||
| 2025-07-25 | NP | USEMX - Emerging Markets Fund Shares | 348 204 | −3,27 | 4 018 | −16,38 | ||||
| 2025-08-14 | 13F | Price T Rowe Associates Inc /md/ | 5 759 116 | −28,80 | 72 | −37,39 | ||||
| 2025-08-06 | 13F | Metis Global Partners, LLC | 91 717 | 26,77 | 1 147 | 10,61 | ||||
| 2025-08-05 | 13F | Simplex Trading, Llc | Put | 931 900 | −39,47 | 12 | −50,00 | |||
| 2025-08-05 | 13F | Simplex Trading, Llc | 15 660 | −96,76 | 0 | −100,00 | ||||
| 2025-08-05 | 13F | Simplex Trading, Llc | Call | 811 300 | −19,47 | 10 | −28,57 | |||
| 2025-08-18 | 13F | Hollencrest Capital Management | 28 | 0,00 | 0 | |||||
| 2025-06-26 | NP | FTCEX - Fidelity Total International Equity Fund Fidelity Advisor Total International Equity Fund: Class C This fund is a listed as child fund of Fmr Llc and if that institution has disclosed ownership in this security, then these positions will not be double counted when calculating total shares and total value | 190 282 | 101,61 | 2 148 | 60,18 | ||||
| 2025-05-14 | 13F | Van Hulzen Asset Management, LLC | 0 | −100,00 | 0 | |||||
| 2025-08-11 | 13F | Hexagon Capital Partners LLC | 0 | −100,00 | 0 | |||||
| 2025-08-14 | 13F | Transamerica Financial Advisors, Inc. | 0 | −100,00 | 0 | |||||
| 2025-07-22 | 13F | Cullinan Associates Inc | 33 200 | 0,00 | 415 | −12,82 | ||||
| 2025-07-17 | 13F | Archford Capital Strategies, LLC | 46 806 | 586 | ||||||
| 2025-08-04 | 13F | Spire Wealth Management | 6 062 | 1,75 | 76 | −11,76 | ||||
| 2025-08-05 | 13F | Wellington Shields & Co., LLC | 130 | 0,00 | 2 | 0,00 | ||||
| 2025-08-14 | 13F | Glenorchy Capital Ltd | 43 979 | 0,78 | 550 | −12,00 | ||||
| 2025-08-14 | 13F | Point72 Europe (London) LLP | 1 281 159 | 95,94 | 16 027 | 70,94 | ||||
| 2025-08-14 | 13F | Two Sigma Advisers, Lp | 56 800 | −33,25 | 711 | −41,80 | ||||
| 2025-08-13 | 13F | Gabelli Funds Llc | 35 000 | 0,00 | 438 | −12,77 | ||||
| 2025-07-29 | 13F | Arista Wealth Management, LLC | 13 000 | 163 | ||||||
| 2025-08-25 | NP | EMEQ - Macquarie Focused Emerging Markets Equity ETF | 29 166 | 0,00 | 365 | −12,92 | ||||
| 2025-08-13 | 13F | Natixis | 177 706 | 2 223 | ||||||
| 2025-08-14 | 13F/A | Barclays Plc | 657 962 | 8,88 | 8 | 0,00 | ||||
| 2025-08-08 | 13F | Cetera Investment Advisers | 214 258 | −24,18 | 2 680 | −33,86 | ||||
| 2025-06-26 | NP | SNTKX - Steward International Enhanced Index Fund Class A | 25 860 | 0,00 | 292 | −20,71 | ||||
| 2025-07-24 | 13F | Ronald Blue Trust, Inc. | 31 834 | 7,19 | 398 | −6,35 | ||||
| 2025-07-24 | 13F | Standard Life Aberdeen plc | 288 571 | −0,64 | 3 610 | −13,30 | ||||
| 2025-08-14 | 13F | Hrt Financial Lp | 314 827 | 4 | ||||||
| 2025-07-21 | 13F | Hennessy Advisors Inc | 398 900 | 0,00 | 4 990 | −12,76 | ||||
| 2025-08-13 | 13F | Lumbard & Kellner, LLC | 507 838 | −1,60 | 6 353 | −14,15 | ||||
| 2025-05-15 | 13F | Barclays Plc | Put | 0 | −100,00 | 0 | −100,00 | |||
| 2025-08-08 | 13F | Massachusetts Financial Services Co /ma/ | 13 003 735 | 33,85 | 162 677 | 16,77 | ||||
| 2025-08-27 | NP | FAIEX - PFM Multi-Manager International Equity Fund Institutional Class | 77 359 | 1,17 | 968 | −11,77 | ||||
| 2025-07-11 | 13F/A | Umb Bank N A/mo | 1 200 | −11,57 | 15 | −21,05 | ||||
| 2025-08-07 | 13F | Connor, Clark & Lunn Investment Management Ltd. | 402 967 | 5 041 | ||||||
| 2025-08-07 | 13F | Traynor Capital Management, Inc. | 0 | −100,00 | 0 | |||||
| 2025-05-06 | 13F | Advisors Preferred, LLC | 0 | −100,00 | 0 | |||||
| 2025-07-30 | NP | FSAMX - Strategic Advisers Emerging Markets Fund This fund is a listed as child fund of Fmr Llc and if that institution has disclosed ownership in this security, then these positions will not be double counted when calculating total shares and total value | 2 804 900 | 0,11 | 32 369 | −13,46 | ||||
| 2025-08-08 | 13F | Wealth Alliance | 22 943 | −4,27 | 287 | −16,33 | ||||
| 2025-08-11 | 13F | HighTower Advisors, LLC | 90 550 | −73,69 | 1 133 | −77,06 | ||||
| 2025-07-18 | 13F | Robeco Institutional Asset Management B.V. | 5 843 804 | 6,79 | 73 106 | −6,84 | ||||
| 2025-08-13 | 13F | Pictet Asset Management Holding SA | 847 208 | 34,75 | 10 599 | 17,56 | ||||
| 2025-07-21 | 13F | Mirae Asset Global Investments Co., Ltd. | 97 988 | 3,83 | 1 226 | −9,66 | ||||
| 2025-06-23 | NP | UUPIX - Ultraemerging Markets Profund Investor Class | 7 665 | 9,23 | 87 | −13,13 | ||||
| 2025-08-13 | 13F | Victory Capital Management Inc | 147 871 | −90,53 | 1 850 | −91,74 | ||||
| 2025-07-22 | 13F | Net Worth Advisory Group | 13 700 | −1,04 | 171 | −13,64 | ||||
| 2025-07-31 | 13F | Caitong International Asset Management Co., Ltd | 36 592 | 64 096,49 | 458 | |||||
| 2025-08-08 | 13F | Itau Unibanco Holding S.A. | 5 664 002 | −7,86 | 70 857 | 82 290,70 | ||||
| 2025-08-13 | 13F | Invesco Ltd. | 11 034 592 | 401,28 | 138 043 | 337,31 | ||||
| 2025-04-30 | 13F | Stratos Wealth Partners, LTD. | 0 | −100,00 | 0 |