Grundläggande statistik
| Portföljvärde | $ 10 451 422 |
| Aktuella positioner | 88 |
Senaste innehav, resultat, förvaltat kapital (från 13F, 13D)
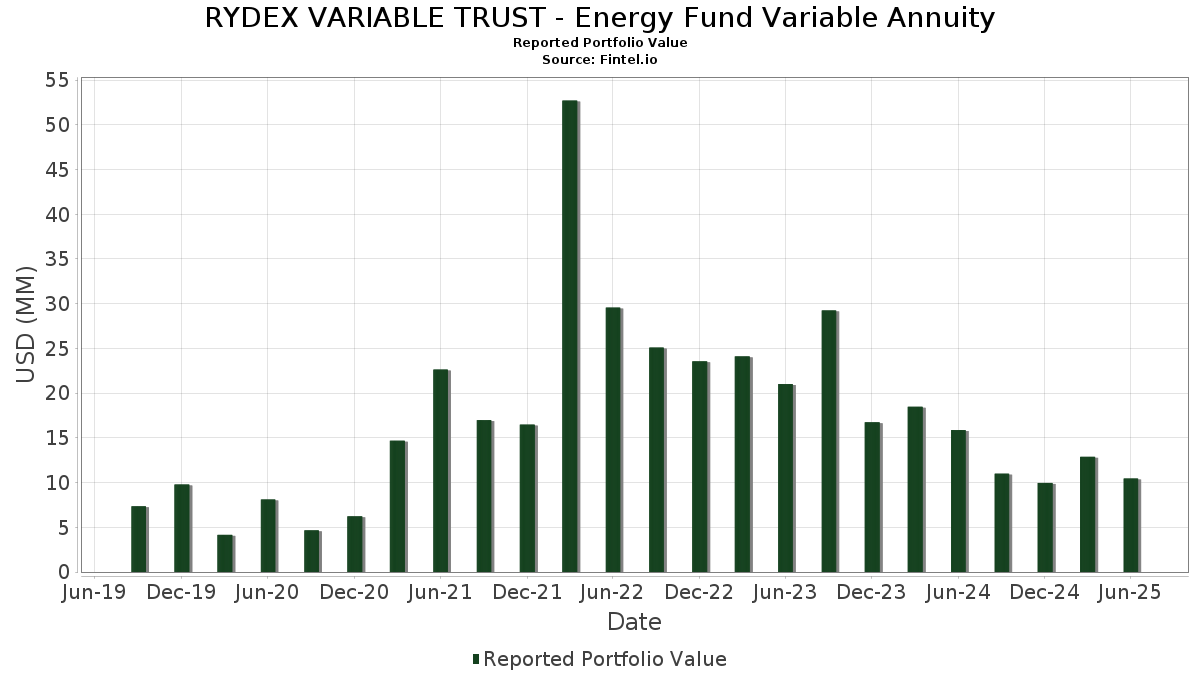
RYDEX VARIABLE TRUST - Energy Fund Variable Annuity har redovisat 88 totala innehav i sina senaste SEC-arkiveringar. Det senaste portföljvärdet beräknas vara $ 10 451 422 USD. Faktiskt förvaltade tillgångar (AUM) är detta värde plus likvida medel (som inte redovisas). RYDEX VARIABLE TRUST - Energy Fund Variable Annuitys största innehav är Exxon Mobil Corporation (US:XOM) , Chevron Corporation (US:CVX) , ConocoPhillips (US:COP) , The Williams Companies, Inc. (US:WMB) , and EOG Resources, Inc. (US:EOG) .
Största ökningarna detta kvartal
Vi använder förändringen i portföljallokeringen eftersom det är det mest meningsfulla måttet. Förändringar kan bero på transaktioner eller förändringar i aktiekurser.
| Värdepapper | Aktier (MM) |
Värde (MM$) |
Portfölj % av | ΔPortfölj % av |
|---|---|---|---|---|
| 0,23 | 0,23 | 2,2210 | 2,2210 | |
| 0,00 | 0,14 | 1,3210 | 0,3046 | |
| 0,00 | 0,04 | 0,4337 | 0,2874 | |
| 0,00 | 0,30 | 2,8910 | 0,2835 | |
| 0,00 | 0,24 | 2,3063 | 0,2745 | |
| 0,01 | 0,26 | 2,5200 | 0,2486 | |
| 0,00 | 0,14 | 1,3322 | 0,2405 | |
| 0,00 | 0,24 | 2,3703 | 0,2243 | |
| 0,02 | 0,2031 | 0,2031 | ||
| 0,00 | 0,07 | 0,6484 | 0,1794 |
Största minskningarna detta kvartal
Vi använder förändringen i portföljallokeringen eftersom det är det mest meningsfulla måttet. Förändringar kan bero på transaktioner eller förändringar i aktiepriser.
| Värdepapper | Aktier (MM) |
Värde (MM$) |
Portfölj % av | ΔPortfölj % av |
|---|---|---|---|---|
| 0,00 | 0,20 | 1,9496 | −1,1071 | |
| 0,02 | 0,06 | 0,5660 | −0,2391 | |
| 0,00 | 0,07 | 0,7016 | −0,1891 | |
| 0,00 | 0,50 | 4,8928 | −0,1866 | |
| 0,00 | 0,07 | 0,6892 | −0,1708 | |
| 0,00 | 0,34 | 3,3287 | −0,1673 | |
| 0,01 | 0,03 | 0,2475 | −0,1428 | |
| 0,00 | 0,14 | 1,4043 | −0,1328 | |
| 0,00 | 0,16 | 1,5770 | −0,1220 | |
| 0,00 | 0,04 | 0,3875 | −0,1202 |
13F- och fond arkiveringar
Denna blankett lämnades in den 2025-08-27 för rapporteringsperioden 2025-06-30. Klicka på länksymbolen för att se hela transaktionshistoriken.
Uppgradera för att låsa upp premiumdata och exportera till Excel![]() .
.
| Värdepapper | Typ | Genomsnittligt aktiepris | Aktier (MM) |
ΔAktier (%) |
ΔAktier (%) |
Värde ($MM) |
Portfölj (%) |
ΔPortfölj (%) |
|
|---|---|---|---|---|---|---|---|---|---|
| XOM / Exxon Mobil Corporation | 0,01 | −11,81 | 0,70 | −20,09 | 6,8640 | −0,0682 | |||
| CVX / Chevron Corporation | 0,00 | −9,15 | 0,50 | −22,17 | 4,8928 | −0,1866 | |||
| COP / ConocoPhillips | 0,00 | −10,04 | 0,34 | −23,20 | 3,3287 | −0,1673 | |||
| WMB / The Williams Companies, Inc. | 0,00 | −14,84 | 0,30 | −10,57 | 2,8910 | 0,2835 | |||
| EOG / EOG Resources, Inc. | 0,00 | −12,25 | 0,27 | −18,21 | 2,5884 | 0,0352 | |||
| KMI / Kinder Morgan, Inc. | 0,01 | −13,08 | 0,26 | −10,42 | 2,5200 | 0,2486 | |||
| LNG / Cheniere Energy, Inc. | 0,00 | −15,27 | 0,24 | −10,66 | 2,3703 | 0,2243 | |||
| MPC / Marathon Petroleum Corporation | 0,00 | −19,63 | 0,24 | −8,53 | 2,3063 | 0,2745 | |||
| OKE / ONEOK, Inc. | 0,00 | −5,02 | 0,23 | −22,00 | 2,2874 | −0,0758 | |||
| First American Government Obligations Fund - Class X / STIV (N/A) | 0,23 | 0,23 | 2,2210 | 2,2210 | |||||
| PSX / Phillips 66 | 0,00 | −11,23 | 0,23 | −14,02 | 2,2144 | 0,1299 | |||
| SLB / Schlumberger Limited | 0,01 | −5,12 | 0,22 | −23,43 | 2,1406 | −0,1120 | |||
| VLO / Valero Energy Corporation | 0,00 | −14,11 | 0,22 | −12,55 | 2,1047 | 0,1610 | |||
| TRGP / Targa Resources Corp. | 0,00 | −7,28 | 0,21 | −19,53 | 2,0099 | −0,0054 | |||
| HES / Hess Corporation | 0,00 | −10,41 | 0,21 | −22,05 | 1,9978 | −0,0779 | |||
| BKR / Baker Hughes Company | 0,01 | −7,09 | 0,20 | −19,05 | 1,9915 | 0,0078 | |||
| EQT / EQT Corporation | 0,00 | −52,83 | 0,20 | −48,45 | 1,9496 | −1,1071 | |||
| OXY / Occidental Petroleum Corporation | 0,00 | −7,35 | 0,18 | −21,08 | 1,7187 | −0,0409 | |||
| EXE / Expand Energy Corporation | 0,00 | −16,41 | 0,17 | −12,18 | 1,6886 | 0,1361 | |||
| FANG / Diamondback Energy, Inc. | 0,00 | −12,81 | 0,16 | −25,12 | 1,5770 | −0,1220 | |||
| BP / BP p.l.c. - Depositary Receipt (Common Stock) | 0,01 | −8,48 | 0,16 | −19,17 | 1,5272 | 0,0063 | |||
| SHEL / Shell plc - Depositary Receipt (Common Stock) | 0,00 | −14,17 | 0,15 | −17,61 | 1,4215 | 0,0300 | |||
| DVN / Devon Energy Corporation | 0,00 | −13,28 | 0,14 | −26,15 | 1,4043 | −0,1328 | |||
| CTRA / Coterra Energy Inc. | 0,01 | −10,97 | 0,14 | −21,67 | 1,3742 | −0,0448 | |||
| CCJ / Cameco Corporation | 0,00 | −45,37 | 0,14 | −1,45 | 1,3322 | 0,2405 | |||
| ENB / Enbridge Inc. | 0,00 | −16,92 | 0,14 | −15,09 | 1,3229 | 0,0661 | |||
| FSLR / First Solar, Inc. | 0,00 | −19,86 | 0,14 | 4,65 | 1,3210 | 0,3046 | |||
| CNQ / Canadian Natural Resources Limited | 0,00 | −20,19 | 0,13 | −18,75 | 1,2749 | 0,0099 | |||
| HAL / Halliburton Company | 0,01 | −6,56 | 0,13 | −24,85 | 1,2421 | −0,0938 | |||
| PBR / Petróleo Brasileiro S.A. - Petrobras - Depositary Receipt (Common Stock) | 0,01 | −7,97 | 0,13 | −19,62 | 1,2393 | −0,0070 | |||
| SU / Suncor Energy Inc. | 0,00 | −18,98 | 0,12 | −21,71 | 1,1618 | −0,0352 | |||
| AR / Antero Resources Corporation | 0,00 | −15,41 | 0,11 | −16,30 | 1,1095 | 0,0464 | |||
| DTM / DT Midstream, Inc. | 0,00 | −16,79 | 0,11 | −5,04 | 1,1041 | 0,1638 | |||
| VNOM / Viper Energy, Inc. | 0,00 | 2,25 | 0,11 | −13,93 | 1,0310 | 0,0671 | |||
| CVE / Cenovus Energy Inc. | 0,01 | −22,44 | 0,10 | −24,64 | 1,0228 | −0,0661 | |||
| FTI / TechnipFMC plc | 0,00 | −31,61 | 0,10 | −25,71 | 1,0141 | −0,0875 | |||
| RRC / Range Resources Corporation | 0,00 | −14,33 | 0,10 | −12,71 | 1,0041 | 0,0750 | |||
| GLNG / Golar LNG Limited | 0,00 | −22,83 | 0,10 | −16,53 | 0,9905 | 0,0348 | |||
| TRP / TC Energy Corporation | 0,00 | −20,75 | 0,10 | −17,89 | 0,9878 | 0,0141 | |||
| PR / Permian Resources Corporation | 0,01 | −17,27 | 0,10 | −18,55 | 0,9864 | 0,0075 | |||
| OVV / Ovintiv Inc. | 0,00 | −13,06 | 0,10 | −22,48 | 0,9769 | −0,0435 | |||
| DINO / HF Sinclair Corporation | 0,00 | −21,47 | 0,09 | −2,25 | 0,8550 | 0,1515 | |||
| EQNR / Equinor ASA - Depositary Receipt (Common Stock) | 0,00 | −22,07 | 0,09 | −25,86 | 0,8380 | −0,0754 | |||
| AM / Antero Midstream Corporation | 0,00 | −14,15 | 0,09 | −9,57 | 0,8298 | 0,0885 | |||
| SEDG / SolarEdge Technologies, Inc. | 0,00 | −41,39 | 0,08 | −26,55 | 0,8171 | −0,0756 | |||
| TS / Tenaris S.A. - Depositary Receipt (Common Stock) | 0,00 | −11,40 | 0,08 | −15,62 | 0,7929 | 0,0374 | |||
| APA / APA Corporation | 0,00 | −14,48 | 0,08 | −25,00 | 0,7895 | −0,0670 | |||
| MTDR / Matador Resources Company | 0,00 | −12,65 | 0,08 | −18,28 | 0,7449 | 0,0078 | |||
| CHRD / Chord Energy Corporation | 0,00 | −12,65 | 0,08 | −25,00 | 0,7360 | −0,0557 | |||
| PBA / Pembina Pipeline Corporation | 0,00 | −10,56 | 0,07 | −16,09 | 0,7178 | 0,0263 | |||
| CNX / CNX Resources Corporation | 0,00 | −13,58 | 0,07 | −7,59 | 0,7121 | 0,0903 | |||
| MUSA / Murphy USA Inc. | 0,00 | −26,56 | 0,07 | −36,28 | 0,7016 | −0,1891 | |||
| ENPH / Enphase Energy, Inc. | 0,00 | 1,25 | 0,07 | −35,78 | 0,6892 | −0,1708 | |||
| CHX / ChampionX Corporation | 0,00 | −7,57 | 0,07 | −23,33 | 0,6799 | −0,0325 | |||
| NOV / NOV Inc. | 0,01 | −10,33 | 0,07 | −26,88 | 0,6654 | −0,0682 | |||
| TPL / Texas Pacific Land Corporation | 0,00 | 40,00 | 0,07 | 11,86 | 0,6484 | 0,1794 | |||
| MGY / Magnolia Oil & Gas Corporation | 0,00 | −14,82 | 0,07 | −24,14 | 0,6470 | −0,0421 | |||
| STNG / Scorpio Tankers Inc. | 0,00 | −22,87 | 0,07 | −19,75 | 0,6363 | −0,0034 | |||
| FRO / Frontline plc | 0,00 | −25,64 | 0,06 | −17,95 | 0,6316 | 0,0111 | |||
| CRC / California Resources Corporation | 0,00 | −16,39 | 0,06 | −13,89 | 0,6127 | 0,0431 | |||
| WFRD / Weatherford International plc | 0,00 | −12,19 | 0,06 | −17,57 | 0,5966 | 0,0127 | |||
| CNR / Core Natural Resources, Inc. | 0,00 | −11,48 | 0,06 | −20,00 | 0,5918 | −0,0049 | |||
| WHD / Cactus, Inc. | 0,00 | −14,03 | 0,06 | −17,81 | 0,5849 | 0,0092 | |||
| UEC / Uranium Energy Corp. | 0,01 | −18,67 | 0,06 | 15,69 | 0,5770 | 0,1744 | |||
| RIG / Transocean Ltd. | 0,02 | −30,53 | 0,06 | −43,14 | 0,5660 | −0,2391 | |||
| NE / Noble Corporation plc | 0,00 | −22,58 | 0,06 | −13,64 | 0,5624 | 0,0389 | |||
| MUR / Murphy Oil Corporation | 0,00 | −11,24 | 0,06 | −29,49 | 0,5367 | −0,0795 | |||
| SM / SM Energy Company | 0,00 | −8,89 | 0,05 | −25,71 | 0,5157 | −0,0382 | |||
| NOG / Northern Oil and Gas, Inc. | 0,00 | −15,40 | 0,05 | −20,00 | 0,5099 | −0,0089 | |||
| CRK / Comstock Resources, Inc. | 0,00 | −26,07 | 0,05 | 0,00 | 0,4909 | 0,0969 | |||
| CIVI / Civitas Resources, Inc. | 0,00 | −11,05 | 0,05 | −30,99 | 0,4856 | −0,0732 | |||
| VAL / Valaris Limited | 0,00 | −20,90 | 0,05 | −15,52 | 0,4829 | 0,0234 | |||
| PTEN / Patterson-UTI Energy, Inc. | 0,01 | −3,30 | 0,05 | −30,88 | 0,4671 | −0,0735 | |||
| PBF / PBF Energy Inc. | 0,00 | −12,72 | 0,05 | 0,00 | 0,4434 | 0,0821 | |||
| TDW / Tidewater Inc. | 0,00 | −22,88 | 0,05 | −15,09 | 0,4423 | 0,0180 | |||
| LEU / Centrus Energy Corp. | 0,00 | −18,73 | 0,04 | 144,44 | 0,4337 | 0,2874 | |||
| RUN / Sunrun Inc. | 0,01 | −27,41 | 0,04 | 2,38 | 0,4230 | 0,0860 | |||
| BTU / Peabody Energy Corporation | 0,00 | −11,02 | 0,04 | −10,64 | 0,4107 | 0,0345 | |||
| LBRT / Liberty Energy Inc. | 0,00 | −8,41 | 0,04 | −34,92 | 0,4079 | −0,0879 | |||
| CRGY / Crescent Energy Company | 0,00 | −19,47 | 0,04 | −39,06 | 0,3875 | −0,1202 | |||
| HP / Helmerich & Payne, Inc. | 0,00 | 3,94 | 0,03 | −40,35 | 0,3387 | −0,1145 | |||
| PLUG / Plug Power Inc. | 0,02 | −0,62 | 0,03 | 12,00 | 0,2730 | 0,0721 | |||
| NFE / New Fortress Energy Inc. | 0,01 | 28,15 | 0,03 | −48,98 | 0,2475 | −0,1428 | |||
| GPRE / Green Plains Inc. | 0,00 | −8,97 | 0,02 | 15,00 | 0,2241 | 0,0643 | |||
| DE000C4SA6R6 / EURO STOXX 50 Index | 0,02 | 0,2031 | 0,2031 | ||||||
| VTLE / Vital Energy, Inc. | 0,00 | −9,94 | 0,02 | −33,33 | 0,2018 | −0,0368 | |||
| Barclays Capital, Inc. / RA (N/A) | 0,01 | 0,0877 | 0,0877 | ||||||
| BofA Securities, Inc. / RA (N/A) | 0,01 | 0,0846 | 0,0846 |