Grundläggande statistik
| Portföljvärde | $ 727 980 634 |
| Aktuella positioner | 143 |
Senaste innehav, resultat, förvaltat kapital (från 13F, 13D)
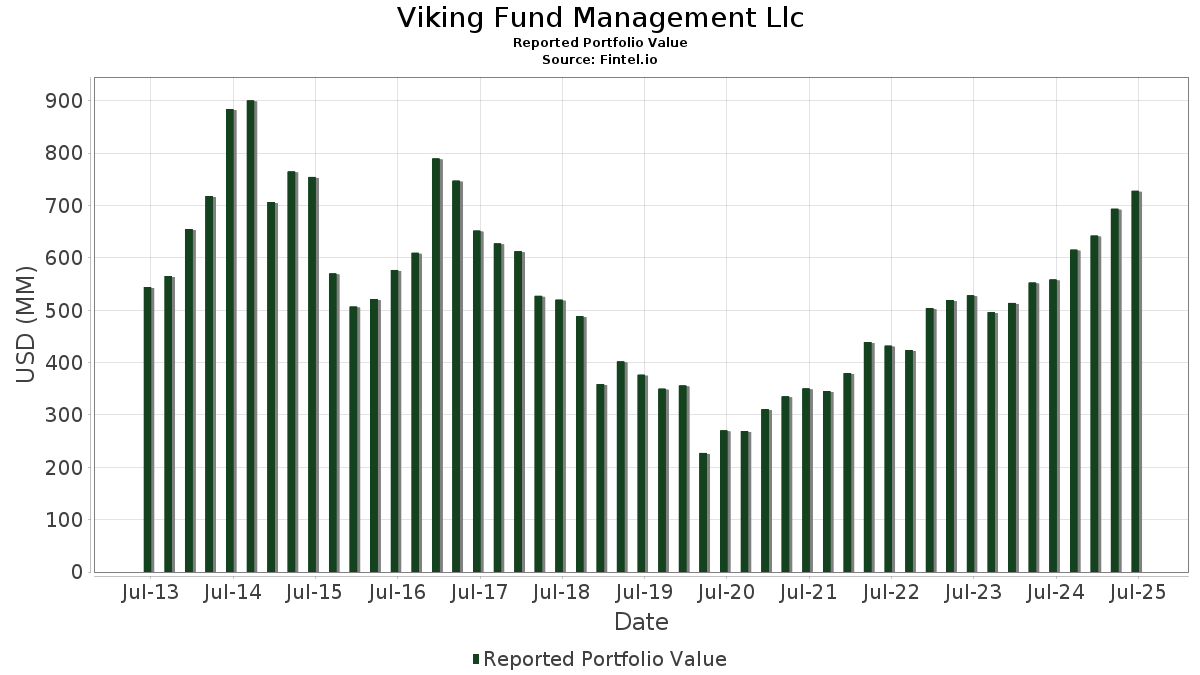
Viking Fund Management Llc har redovisat 143 totala innehav i sina senaste SEC-arkiveringar. Det senaste portföljvärdet beräknas vara $ 727 980 634 USD. Faktiskt förvaltade tillgångar (AUM) är detta värde plus likvida medel (som inte redovisas). Viking Fund Management Llcs största innehav är Broadcom Inc. (US:AVGO) , NextEra Energy, Inc. (US:NEE) , TC Energy Corporation (US:TRP) , Chevron Corporation (US:CVX) , and PepsiCo, Inc. (US:PEP) . Viking Fund Management Llcs nya positioner inkluderar Cameco Corporation (US:CCJ) , Chesapeake Energy Corporation (US:CHK) , Noble Corporation plc (US:NE) , ING Groep N.V. - Depositary Receipt (Common Stock) (US:ING) , and .
Största ökningarna detta kvartal
Vi använder förändringen i portföljallokeringen eftersom det är det mest meningsfulla måttet. Förändringar kan bero på transaktioner eller förändringar i aktiekurser.
| Värdepapper | Aktier (MM) |
Värde (MM$) |
Portfölj % av | ΔPortfölj % av |
|---|---|---|---|---|
| 0,11 | 29,77 | 4,0894 | 1,1205 | |
| 0,12 | 13,47 | 1,8510 | 0,9937 | |
| 0,50 | 24,49 | 3,3645 | 0,7645 | |
| 0,02 | 3,62 | 0,4978 | 0,4978 | |
| 0,07 | 10,27 | 1,4107 | 0,3951 | |
| 0,10 | 14,37 | 1,9736 | 0,3758 | |
| 0,06 | 6,99 | 0,9599 | 0,3686 | |
| 0,16 | 7,46 | 1,0241 | 0,3565 | |
| 0,21 | 14,30 | 1,9645 | 0,3316 | |
| 0,14 | 12,34 | 1,6954 | 0,3138 |
Största minskningarna detta kvartal
Vi använder förändringen i portföljallokeringen eftersom det är det mest meningsfulla måttet. Förändringar kan bero på transaktioner eller förändringar i aktiepriser.
| Värdepapper | Aktier (MM) |
Värde (MM$) |
Portfölj % av | ΔPortfölj % av |
|---|---|---|---|---|
| 0,42 | 29,50 | 4,0528 | −1,0060 | |
| 0,11 | 2,79 | 0,3835 | −0,9081 | |
| 0,32 | 14,75 | 2,0265 | −0,7757 | |
| 0,08 | 14,29 | 1,9633 | −0,7552 | |
| 0,28 | 2,95 | 0,4046 | −0,7234 | |
| 0,08 | 6,41 | 0,8808 | −0,4132 | |
| 0,30 | 7,37 | 1,0122 | −0,3906 | |
| 0,15 | 5,77 | 0,7921 | −0,3388 | |
| 0,03 | 7,06 | 0,9701 | −0,3309 | |
| 0,04 | 2,33 | 0,3204 | −0,2958 |
13F- och fond arkiveringar
Denna blankett lämnades in den 2025-07-11 för rapporteringsperioden 2025-06-30. Klicka på länksymbolen för att se hela transaktionshistoriken.
Uppgradera för att låsa upp premiumdata och exportera till Excel![]() .
.
| Värdepapper | Typ | Genomsnittligt aktiepris | Aktier (MM) |
ΔAktier (%) |
ΔAktier (%) |
Värde ($MM) |
Portfölj (%) |
ΔPortfölj (%) |
|
|---|---|---|---|---|---|---|---|---|---|
| AVGO / Broadcom Inc. | 0,11 | −12,20 | 29,77 | 44,56 | 4,0894 | 1,1205 | |||
| NEE / NextEra Energy, Inc. | 0,42 | −14,14 | 29,50 | −15,92 | 4,0528 | −1,0060 | |||
| TRP / TC Energy Corporation | 0,50 | 31,41 | 24,49 | 35,81 | 3,3645 | 0,7645 | |||
| CVX / Chevron Corporation | 0,15 | 29,06 | 21,62 | 10,47 | 2,9701 | 0,1484 | |||
| PEP / PepsiCo, Inc. | 0,12 | 12,61 | 16,50 | −0,83 | 2,2672 | −0,1322 | |||
| BMY / Bristol-Myers Squibb Company | 0,32 | 0,00 | 14,75 | −24,10 | 2,0265 | −0,7757 | |||
| MS / Morgan Stanley | 0,10 | 7,37 | 14,37 | 29,63 | 1,9736 | 0,3758 | |||
| XEL / Xcel Energy Inc. | 0,21 | 31,25 | 14,30 | 26,27 | 1,9645 | 0,3316 | |||
| ABBV / AbbVie Inc. | 0,08 | −14,44 | 14,29 | −24,20 | 1,9633 | −0,7552 | |||
| GLW / Corning Incorporated | 0,26 | 4,00 | 13,67 | 19,47 | 1,8783 | 0,2283 | |||
| XOM / Exxon Mobil Corporation | 0,12 | 150,00 | 13,47 | 126,62 | 1,8510 | 0,9937 | |||
| C / Citigroup Inc. | 0,14 | 7,41 | 12,34 | 28,79 | 1,6954 | 0,3138 | |||
| JPM / JPMorgan Chase & Co. | 0,04 | 0,00 | 12,18 | 18,19 | 1,6726 | 0,1873 | |||
| QCOM / QUALCOMM Incorporated | 0,07 | 4,17 | 11,94 | 8,00 | 1,6408 | 0,0463 | |||
| PR / Permian Resources Corporation | 0,84 | 2,44 | 11,45 | 0,74 | 1,5735 | −0,0658 | |||
| AEP / American Electric Power Company, Inc. | 0,11 | 0,00 | 11,41 | −5,04 | 1,5678 | −0,1650 | |||
| T / AT&T Inc. | 0,39 | 0,00 | 11,20 | 2,33 | 1,5385 | −0,0393 | |||
| PSX / Phillips 66 | 0,09 | 5,75 | 10,98 | 2,17 | 1,5077 | −0,0411 | |||
| ETR / Entergy Corporation | 0,13 | 16,07 | 10,81 | 12,86 | 1,4843 | 0,1040 | |||
| LRCX / Lam Research Corporation | 0,11 | 0,00 | 10,42 | 33,90 | 1,4307 | 0,3093 | |||
| MO / Altria Group, Inc. | 0,18 | 0,00 | 10,27 | −2,32 | 1,4114 | −0,1050 | |||
| NVDA / NVIDIA Corporation | 0,07 | 0,00 | 10,27 | 45,78 | 1,4107 | 0,3951 | |||
| VZ / Verizon Communications Inc. | 0,24 | 9,26 | 10,21 | 4,23 | 1,4027 | −0,0097 | |||
| HD / The Home Depot, Inc. | 0,03 | 0,00 | 9,53 | 0,04 | 1,3095 | −0,0642 | |||
| PRU / Prudential Financial, Inc. | 0,09 | 4,82 | 9,35 | 0,84 | 1,2840 | −0,0523 | |||
| KVUE / Kenvue Inc. | 0,45 | 11,25 | 9,31 | −2,91 | 1,2794 | −0,1034 | |||
| KMB / Kimberly-Clark Corporation | 0,07 | 0,00 | 9,15 | −9,35 | 1,2574 | −0,1984 | |||
| TGT / Target Corporation | 0,09 | 46,67 | 8,68 | 38,65 | 1,1925 | 0,2898 | |||
| BAC / Bank of America Corporation | 0,18 | 0,00 | 8,52 | 13,39 | 1,1700 | 0,0871 | |||
| EBGEF / Enbridge Inc. - Preferred Stock | 0,16 | 57,42 | 7,46 | 61,02 | 1,0241 | 0,3565 | |||
| BTI / British American Tobacco p.l.c. - Depositary Receipt (Common Stock) | 0,16 | 0,00 | 7,45 | 14,41 | 1,0240 | 0,0846 | |||
| PFE / Pfizer Inc. | 0,30 | −20,83 | 7,37 | −24,28 | 1,0122 | −0,3906 | |||
| BLK / BlackRock, Inc. | 0,01 | −22,22 | 7,34 | −13,78 | 1,0089 | −0,2191 | |||
| APD / Air Products and Chemicals, Inc. | 0,03 | 0,00 | 7,33 | −4,36 | 1,0074 | −0,0981 | |||
| KO / The Coca-Cola Company | 0,10 | 25,00 | 7,08 | 23,49 | 0,9719 | 0,1459 | |||
| LNG / Cheniere Energy, Inc. | 0,03 | −25,64 | 7,06 | −21,74 | 0,9701 | −0,3309 | |||
| DELL / Dell Technologies Inc. | 0,06 | 26,67 | 6,99 | 70,40 | 0,9599 | 0,3686 | |||
| LMT / Lockheed Martin Corporation | 0,01 | 0,00 | 6,95 | 3,69 | 0,9543 | −0,0117 | |||
| EVRG / Evergy, Inc. | 0,10 | 25,00 | 6,89 | 24,96 | 0,9469 | 0,1517 | |||
| CME / CME Group Inc. | 0,03 | 0,00 | 6,89 | 3,89 | 0,9465 | −0,0096 | |||
| GPC / Genuine Parts Company | 0,06 | 0,00 | 6,67 | 1,83 | 0,9165 | −0,0282 | |||
| TXN / Texas Instruments Incorporated | 0,03 | −21,95 | 6,64 | −9,83 | 0,9126 | −0,1495 | |||
| IBM / International Business Machines Corporation | 0,02 | 0,00 | 6,49 | 18,56 | 0,8908 | 0,1022 | |||
| MRK / Merck & Co., Inc. | 0,08 | −19,00 | 6,41 | −28,58 | 0,8808 | −0,4132 | |||
| PM / Philip Morris International Inc. | 0,04 | −25,53 | 6,37 | −14,56 | 0,8756 | −0,1999 | |||
| PAYX / Paychex, Inc. | 0,04 | 0,00 | 6,25 | −5,73 | 0,8592 | −0,0972 | |||
| UPS / United Parcel Service, Inc. | 0,06 | 1,75 | 5,85 | −6,62 | 0,8042 | −0,0996 | |||
| MCD / McDonald's Corporation | 0,02 | 0,00 | 5,84 | −6,47 | 0,8027 | −0,0980 | |||
| ORI / Old Republic International Corporation | 0,15 | −25,00 | 5,77 | −26,49 | 0,7921 | −0,3388 | |||
| UNM / Unum Group | 0,07 | 0,00 | 5,65 | −0,86 | 0,7766 | −0,0455 | |||
| VST / Vistra Corp. | 0,03 | −3,45 | 5,43 | 59,35 | 0,7454 | 0,2545 | |||
| KLAC / KLA Corporation | 0,01 | 0,00 | 5,37 | 31,78 | 0,7383 | 0,1502 | |||
| V / Visa Inc. | 0,01 | 0,00 | 5,33 | 1,31 | 0,7316 | −0,0263 | |||
| AFG / American Financial Group, Inc. | 0,04 | 0,00 | 5,17 | −3,90 | 0,7108 | −0,0655 | |||
| BKR / Baker Hughes Company | 0,13 | 0,00 | 5,06 | −12,77 | 0,6952 | −0,1412 | |||
| LYB / LyondellBasell Industries N.V. | 0,08 | 20,00 | 4,86 | −1,38 | 0,6676 | −0,0428 | |||
| AR / Antero Resources Corporation | 0,12 | −14,29 | 4,83 | −14,63 | 0,6640 | −0,1522 | |||
| GPOR / Gulfport Energy Corporation | 0,02 | 0,00 | 4,83 | 9,26 | 0,6632 | 0,0261 | |||
| TT / Trane Technologies plc | 0,01 | 0,00 | 4,81 | 29,82 | 0,6609 | 0,1266 | |||
| NRG / NRG Energy, Inc. | 0,03 | −12,50 | 4,50 | 47,22 | 0,6176 | 0,1772 | |||
| VRT / Vertiv Holdings Co | 0,04 | −7,89 | 4,49 | 63,84 | 0,6174 | 0,2218 | |||
| TRGP / Targa Resources Corp. | 0,03 | −3,85 | 4,35 | −16,50 | 0,5978 | −0,1536 | |||
| AAPL / Apple Inc. | 0,02 | 0,00 | 4,31 | −7,63 | 0,5919 | −0,0806 | |||
| VLO / Valero Energy Corporation | 0,03 | 0,00 | 4,30 | 1,77 | 0,5909 | −0,0184 | |||
| ITW / Illinois Tool Works Inc. | 0,02 | 0,00 | 4,20 | −0,31 | 0,5774 | −0,0304 | |||
| NET / Cloudflare, Inc. | 0,02 | 0,00 | 4,11 | 73,80 | 0,5649 | 0,2237 | |||
| INTU / Intuit Inc. | 0,01 | 0,00 | 3,94 | 28,32 | 0,5410 | 0,0984 | |||
| MA / Mastercard Incorporated | 0,01 | 0,00 | 3,93 | 2,53 | 0,5403 | −0,0128 | |||
| FSLR / First Solar, Inc. | 0,02 | 9,52 | 3,81 | 43,39 | 0,5230 | 0,1402 | |||
| SBUX / Starbucks Corporation | 0,04 | 0,00 | 3,67 | −6,58 | 0,5035 | −0,0622 | |||
| ALL / The Allstate Corporation | 0,02 | 3,62 | 0,4978 | 0,4978 | |||||
| AROC / Archrock, Inc. | 0,14 | 180,00 | 3,48 | 164,94 | 0,4775 | 0,2884 | |||
| KGS / Kodiak Gas Services, Inc. | 0,09 | 20,27 | 3,05 | 10,51 | 0,4190 | 0,0210 | |||
| MSFT / Microsoft Corporation | 0,01 | 0,00 | 2,98 | 32,50 | 0,4100 | 0,0853 | |||
| WM / Waste Management, Inc. | 0,01 | 0,00 | 2,97 | −1,16 | 0,4086 | −0,0253 | |||
| AES / The AES Corporation | 0,28 | −55,56 | 2,95 | −62,36 | 0,4046 | −0,7234 | |||
| GJR / Strats Trust For Procter & Gambel Security - Preferred Security | 0,02 | 0,00 | 2,87 | −6,52 | 0,3939 | −0,0483 | |||
| CTRA / Coterra Energy Inc. | 0,11 | −64,52 | 2,79 | −68,85 | 0,3835 | −0,9081 | |||
| SLB / Schlumberger Limited | 0,08 | 0,00 | 2,70 | −19,14 | 0,3714 | −0,1106 | |||
| EXC / Exelon Corporation | 0,06 | 0,00 | 2,69 | −5,74 | 0,3698 | −0,0421 | |||
| EE / Excelerate Energy, Inc. | 0,09 | 0,00 | 2,64 | 2,21 | 0,3625 | −0,0096 | |||
| SPGI / S&P Global Inc. | 0,01 | 0,00 | 2,64 | 3,78 | 0,3622 | −0,0041 | |||
| PBA / Pembina Pipeline Corporation | 0,07 | −22,22 | 2,63 | −27,12 | 0,3607 | −0,1587 | |||
| DE / Deere & Company | 0,01 | 0,00 | 2,54 | 8,35 | 0,3492 | 0,0109 | |||
| CYBR / CyberArk Software Ltd. | 0,01 | 100,00 | 2,44 | 140,73 | 0,3353 | 0,1892 | |||
| COP / ConocoPhillips | 0,03 | 12,50 | 2,42 | −3,89 | 0,3328 | −0,0305 | |||
| AMD / Advanced Micro Devices, Inc. | 0,02 | 0,00 | 2,41 | 38,14 | 0,3314 | 0,0796 | |||
| FANG / Diamondback Energy, Inc. | 0,02 | −15,00 | 2,34 | −26,96 | 0,3209 | −0,1401 | |||
| EQT / EQT Corporation | 0,04 | −50,00 | 2,33 | −45,44 | 0,3204 | −0,2958 | |||
| PPC / Pilgrim's Pride Corporation | 0,05 | 1 370,59 | 2,25 | 1 115,68 | 0,3089 | 0,2822 | |||
| LOW / Lowe's Companies, Inc. | 0,01 | 0,00 | 2,22 | −4,89 | 0,3048 | −0,0315 | |||
| KMI / Kinder Morgan, Inc. | 0,07 | 0,00 | 2,21 | 3,09 | 0,3029 | −0,0056 | |||
| MNDY / monday.com Ltd. | 0,01 | 40,00 | 2,20 | 81,15 | 0,3024 | 0,1271 | |||
| DOCN / DigitalOcean Holdings, Inc. | 0,07 | 15,38 | 2,14 | −1,29 | 0,2942 | −0,0187 | |||
| TMO / Thermo Fisher Scientific Inc. | 0,01 | 0,00 | 2,03 | −18,53 | 0,2785 | −0,0802 | |||
| GEV / GE Vernova Inc. | 0,00 | −24,00 | 2,01 | 31,72 | 0,2762 | 0,0562 | |||
| GTLS / Chart Industries, Inc. | 0,01 | 9,09 | 1,98 | 24,45 | 0,2714 | 0,0425 | |||
| UNH / UnitedHealth Group Incorporated | 0,01 | 50,00 | 1,87 | −10,69 | 0,2571 | −0,0449 | |||
| PRIM / Primoris Services Corporation | 0,02 | 100,00 | 1,87 | 171,80 | 0,2570 | 0,1576 | |||
| PNC / The PNC Financial Services Group, Inc. | 0,01 | 0,00 | 1,86 | 6,09 | 0,2561 | 0,0027 | |||
| FDX / FedEx Corporation | 0,01 | 0,00 | 1,59 | −6,74 | 0,2186 | −0,0274 | |||
| EW / Edwards Lifesciences Corporation | 0,02 | 0,00 | 1,56 | 7,94 | 0,2149 | 0,0059 | |||
| CAT / Caterpillar Inc. | 0,00 | 0,00 | 1,55 | 17,66 | 0,2133 | 0,0231 | |||
| FTI / TechnipFMC plc | 0,04 | 0,00 | 1,38 | 8,68 | 0,1892 | 0,0065 | |||
| MOD / Modine Manufacturing Company | 0,01 | 0,00 | 1,28 | 28,39 | 0,1759 | 0,0321 | |||
| TSLA / Tesla, Inc. | 0,00 | 0,00 | 1,27 | 22,59 | 0,1745 | 0,0251 | |||
| CCJ / Cameco Corporation | 0,02 | 1,26 | 0,1733 | 0,1733 | |||||
| CHK / Chesapeake Energy Corporation | 0,01 | 1,17 | 0,1606 | 0,1606 | |||||
| TPL / Texas Pacific Land Corporation | 0,00 | 37,50 | 1,16 | 9,73 | 0,1596 | 0,0068 | |||
| TS / Tenaris S.A. - Depositary Receipt (Common Stock) | 0,03 | 12,00 | 1,05 | 7,16 | 0,1438 | 0,0029 | |||
| CSCO / Cisco Systems, Inc. | 0,01 | −66,67 | 1,04 | −62,54 | 0,1430 | −0,2574 | |||
| NXT / Nextracker Inc. | 0,02 | −40,62 | 1,03 | −23,37 | 0,1419 | −0,0525 | |||
| DINO / HF Sinclair Corporation | 0,03 | −37,50 | 1,03 | −21,90 | 0,1411 | −0,0485 | |||
| CEG / Constellation Energy Corporation | 0,00 | 0,97 | 0,1330 | 0,1330 | |||||
| PWR / Quanta Services, Inc. | 0,00 | −16,67 | 0,95 | 24,02 | 0,1298 | 0,0199 | |||
| NE / Noble Corporation plc | 0,04 | 0,93 | 0,1276 | 0,1276 | |||||
| SHLS / Shoals Technologies Group, Inc. | 0,20 | −9,30 | 0,83 | 16,13 | 0,1138 | 0,0109 | |||
| GNRC / Generac Holdings Inc. | 0,01 | 0,00 | 0,72 | 13,11 | 0,0984 | 0,0071 | |||
| HAL / Halliburton Company | 0,03 | 0,00 | 0,61 | −19,71 | 0,0840 | −0,0257 | |||
| PTEN / Patterson-UTI Energy, Inc. | 0,10 | 0,00 | 0,59 | −27,86 | 0,0815 | −0,0370 | |||
| ARRY / Array Technologies, Inc. | 0,07 | −22,22 | 0,41 | −5,71 | 0,0567 | −0,0065 | |||
| PBR / Petróleo Brasileiro S.A. - Petrobras - Depositary Receipt (Common Stock) | 0,02 | 0,00 | 0,29 | −12,77 | 0,0395 | −0,0080 | |||
| BBY / Best Buy Co., Inc. | 0,00 | 60,00 | 0,27 | 45,65 | 0,0369 | 0,0104 | |||
| XPRO / Expro Group Holdings N.V. | 0,03 | −70,00 | 0,26 | −74,14 | 0,0354 | −0,1079 | |||
| ES / Eversource Energy | 0,00 | 0,00 | 0,25 | 2,42 | 0,0350 | −0,0009 | |||
| USB / U.S. Bancorp | 0,01 | 0,00 | 0,24 | 7,11 | 0,0332 | 0,0007 | |||
| DOW / Dow Inc. | 0,01 | 0,00 | 0,24 | −24,20 | 0,0327 | −0,0126 | |||
| LPG / Dorian LPG Ltd. | 0,01 | 0,00 | 0,22 | 8,96 | 0,0301 | 0,0012 | |||
| D / Dominion Energy, Inc. | 0,00 | 0,00 | 0,20 | 0,51 | 0,0272 | −0,0011 | |||
| RIO / Rio Tinto Group - Depositary Receipt (Common Stock) | 0,00 | −33,33 | 0,17 | −35,56 | 0,0240 | −0,0149 | |||
| POR / Portland General Electric Company | 0,00 | 0,00 | 0,16 | −8,99 | 0,0223 | −0,0034 | |||
| STX / Seagate Technology Holdings plc | 0,00 | −50,00 | 0,14 | −14,79 | 0,0198 | −0,0047 | |||
| RF / Regions Financial Corporation | 0,01 | 0,00 | 0,14 | 8,46 | 0,0194 | 0,0006 | |||
| BKE / The Buckle, Inc. | 0,00 | 0,00 | 0,14 | 19,30 | 0,0187 | 0,0021 | |||
| BCE / BCE Inc. | 0,01 | 0,00 | 0,13 | −2,92 | 0,0183 | −0,0016 | |||
| TFC / Truist Financial Corporation | 0,00 | 0,00 | 0,13 | 4,07 | 0,0177 | −0,0001 | |||
| ING / ING Groep N.V. - Depositary Receipt (Common Stock) | 0,01 | 0,11 | 0,0150 | 0,0150 | |||||
| WHR / Whirlpool Corporation | 0,00 | 0,00 | 0,10 | 12,22 | 0,0139 | 0,0009 | |||
| BHP / BHP Group Limited - Depositary Receipt (Common Stock) | 0,00 | −33,33 | 0,10 | −33,79 | 0,0132 | −0,0078 | |||
| UMC / United Microelectronics Corporation - Depositary Receipt (Common Stock) | 0,01 | 0,09 | 0,0126 | 0,0126 | |||||
| WEN / The Wendy's Company | 0,01 | 0,00 | 0,09 | −22,22 | 0,0125 | −0,0043 | |||
| SOBO / South Bow Corporation | 0,00 | −92,36 | 0,06 | −92,26 | 0,0085 | −0,1070 | |||
| TROW / T. Rowe Price Group, Inc. | 0,00 | 0,00 | 0,06 | 3,64 | 0,0080 | 0,0000 | |||
| PARR / Par Pacific Holdings, Inc. | 0,00 | −100,00 | 0,00 | 0,0000 | |||||
| SNY / Sanofi - Depositary Receipt (Common Stock) | 0,00 | −100,00 | 0,00 | 0,0000 | |||||
| NVS / Novartis AG - Depositary Receipt (Common Stock) | 0,00 | −100,00 | 0,00 | 0,0000 | |||||
| SWKS / Skyworks Solutions, Inc. | 0,00 | −100,00 | 0,00 | 0,0000 |