Grundläggande statistik
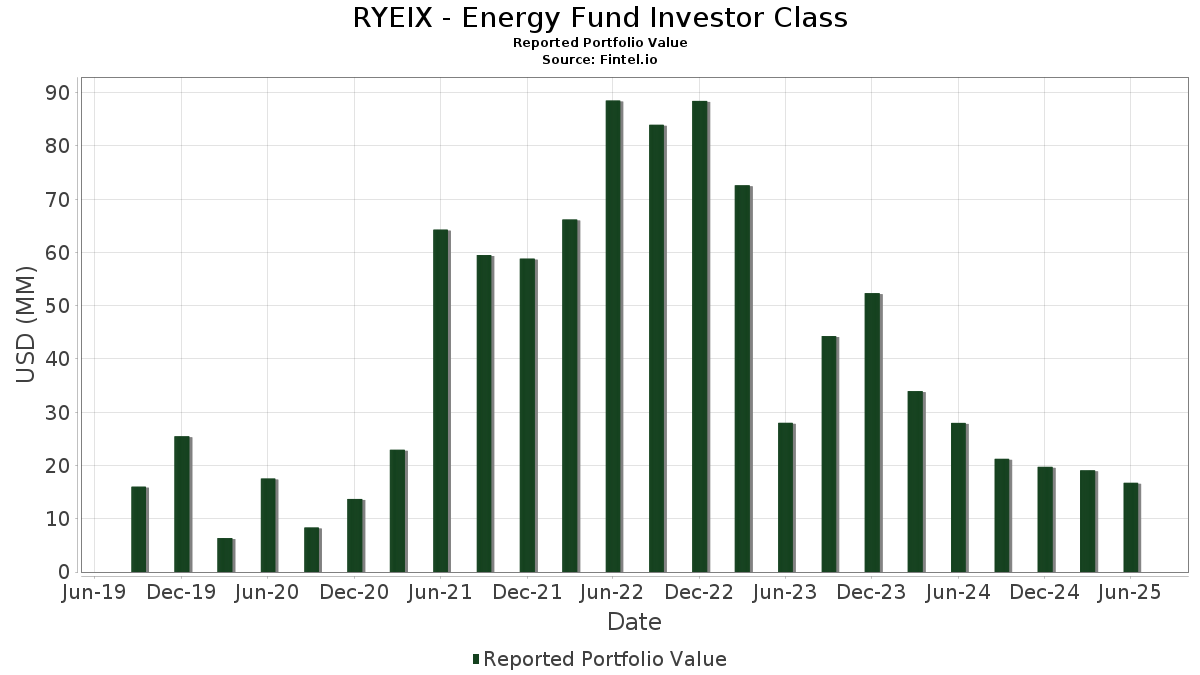
| Portföljvärde | $ 16 745 578 |
| Aktuella positioner | 88 |
Senaste innehav, resultat, förvaltat kapital (från 13F, 13D)
RYEIX - Energy Fund Investor Class har redovisat 88 totala innehav i sina senaste SEC-arkiveringar. Det senaste portföljvärdet beräknas vara $ 16 745 578 USD. Faktiskt förvaltade tillgångar (AUM) är detta värde plus likvida medel (som inte redovisas). RYEIX - Energy Fund Investor Classs största innehav är Exxon Mobil Corporation (US:XOM) , Chevron Corporation (US:CVX) , ConocoPhillips (US:COP) , The Williams Companies, Inc. (US:WMB) , and EOG Resources, Inc. (US:EOG) .
Största ökningarna detta kvartal
Vi använder förändringen i portföljallokeringen eftersom det är det mest meningsfulla måttet. Förändringar kan bero på transaktioner eller förändringar i aktiekurser.
| Värdepapper | Aktier (MM) |
Värde (MM$) |
Portfölj % av | ΔPortfölj % av |
|---|---|---|---|---|
| 0,35 | 0,35 | 1,8176 | 1,8176 | |
| 0,01 | 0,48 | 2,4443 | 0,3063 | |
| 0,00 | 0,22 | 1,1172 | 0,2820 | |
| 0,00 | 0,38 | 1,9503 | 0,2804 | |
| 0,01 | 0,41 | 2,1308 | 0,2671 | |
| 0,00 | 0,07 | 0,3669 | 0,2465 | |
| 0,00 | 0,39 | 2,0037 | 0,2423 | |
| 0,00 | 0,22 | 1,1262 | 0,2297 | |
| 0,00 | 0,35 | 1,7791 | 0,1875 | |
| 0,00 | 0,36 | 1,8725 | 0,1634 |
Största minskningarna detta kvartal
Vi använder förändringen i portföljallokeringen eftersom det är det mest meningsfulla måttet. Förändringar kan bero på transaktioner eller förändringar i aktiepriser.
| Värdepapper | Aktier (MM) |
Värde (MM$) |
Portfölj % av | ΔPortfölj % av |
|---|---|---|---|---|
| 0,01 | 0,32 | 1,6483 | −1,0385 | |
| 0,04 | 0,09 | 0,4786 | −0,1819 | |
| 0,00 | 0,12 | 0,5934 | −0,1289 | |
| 0,00 | 0,11 | 0,5826 | −0,1223 | |
| 0,01 | 0,04 | 0,2093 | −0,1110 | |
| 0,01 | 0,06 | 0,3276 | −0,0888 | |
| 0,00 | 0,06 | 0,2865 | −0,0860 | |
| 0,01 | 0,23 | 1,1874 | −0,0737 | |
| 0,01 | 0,07 | 0,3449 | −0,0625 | |
| 0,00 | 0,26 | 1,3331 | −0,0596 |
13F- och fond arkiveringar
Denna blankett lämnades in den 2025-08-27 för rapporteringsperioden 2025-06-30. Klicka på länksymbolen för att se hela transaktionshistoriken.
Uppgradera för att låsa upp premiumdata och exportera till Excel![]() .
.
| Värdepapper | Typ | Genomsnittligt aktiepris | Aktier (MM) |
ΔAktier (%) |
ΔAktier (%) |
Värde ($MM) |
Portfölj (%) |
ΔPortfölj (%) |
|
|---|---|---|---|---|---|---|---|---|---|
| XOM / Exxon Mobil Corporation | 0,01 | −2,91 | 1,13 | −11,99 | 5,8046 | 0,1149 | |||
| CVX / Chevron Corporation | 0,01 | 0,00 | 0,81 | −14,45 | 4,1375 | −0,0324 | |||
| COP / ConocoPhillips | 0,01 | −1,02 | 0,55 | −15,46 | 2,8143 | −0,0561 | |||
| WMB / The Williams Companies, Inc. | 0,01 | −6,17 | 0,48 | −1,45 | 2,4443 | 0,3063 | |||
| EOG / EOG Resources, Inc. | 0,00 | −3,34 | 0,43 | −9,75 | 2,1882 | 0,0945 | |||
| KMI / Kinder Morgan, Inc. | 0,01 | −4,29 | 0,41 | −1,43 | 2,1308 | 0,2671 | |||
| LNG / Cheniere Energy, Inc. | 0,00 | −6,75 | 0,39 | −1,76 | 2,0037 | 0,2423 | |||
| MPC / Marathon Petroleum Corporation | 0,00 | −11,64 | 0,38 | 0,80 | 1,9503 | 0,2804 | |||
| OKE / ONEOK, Inc. | 0,00 | 4,51 | 0,38 | −13,96 | 1,9336 | −0,0064 | |||
| PSX / Phillips 66 | 0,00 | −2,18 | 0,36 | −5,45 | 1,8725 | 0,1634 | |||
| First American Government Obligations Fund - Class X / STIV (N/A) | 0,35 | 0,35 | 1,8176 | 1,8176 | |||||
| SLB / Schlumberger Limited | 0,01 | 4,55 | 0,35 | −15,38 | 1,8101 | −0,0369 | |||
| VLO / Valero Energy Corporation | 0,00 | −5,26 | 0,35 | −3,62 | 1,7791 | 0,1875 | |||
| TRGP / Targa Resources Corp. | 0,00 | 2,15 | 0,33 | −11,53 | 1,6997 | 0,0467 | |||
| HES / Hess Corporation | 0,00 | −1,29 | 0,33 | −14,58 | 1,6892 | −0,0128 | |||
| BKR / Baker Hughes Company | 0,01 | 2,31 | 0,33 | −10,90 | 1,6836 | 0,0563 | |||
| EQT / EQT Corporation | 0,01 | −51,52 | 0,32 | −47,19 | 1,6483 | −1,0385 | |||
| OXY / Occidental Petroleum Corporation | 0,01 | 1,92 | 0,28 | −13,50 | 1,4534 | 0,0081 | |||
| EXE / Expand Energy Corporation | 0,00 | −8,08 | 0,28 | −3,14 | 1,4282 | 0,1523 | |||
| FANG / Diamondback Energy, Inc. | 0,00 | −3,92 | 0,26 | −17,52 | 1,3331 | −0,0596 | |||
| BP / BP p.l.c. - Depositary Receipt (Common Stock) | 0,01 | 0,90 | 0,25 | −10,68 | 1,2914 | 0,0449 | |||
| SHEL / Shell plc - Depositary Receipt (Common Stock) | 0,00 | −5,70 | 0,23 | −9,69 | 1,2017 | 0,0575 | |||
| DVN / Devon Energy Corporation | 0,01 | −4,51 | 0,23 | −18,66 | 1,1874 | −0,0737 | |||
| CTRA / Coterra Energy Inc. | 0,01 | −1,93 | 0,23 | −13,74 | 1,1620 | −0,0018 | |||
| CCJ / Cameco Corporation | 0,00 | −39,91 | 0,22 | 8,42 | 1,1262 | 0,2297 | |||
| ENB / Enbridge Inc. | 0,00 | −8,51 | 0,22 | −6,47 | 1,1184 | 0,0874 | |||
| FSLR / First Solar, Inc. | 0,00 | −11,87 | 0,22 | 15,43 | 1,1172 | 0,2820 | |||
| CNQ / Canadian Natural Resources Limited | 0,01 | −12,12 | 0,21 | −10,68 | 1,0779 | 0,0400 | |||
| HAL / Halliburton Company | 0,01 | 2,93 | 0,20 | −17,41 | 1,0502 | −0,0454 | |||
| PBR / Petróleo Brasileiro S.A. - Petrobras - Depositary Receipt (Common Stock) | 0,02 | 1,35 | 0,20 | −11,30 | 1,0479 | 0,0255 | |||
| SU / Suncor Energy Inc. | 0,01 | −10,70 | 0,19 | −13,57 | 0,9825 | 0,0012 | |||
| AR / Antero Resources Corporation | 0,00 | −6,96 | 0,18 | −7,61 | 0,9380 | 0,0649 | |||
| DTM / DT Midstream, Inc. | 0,00 | −8,37 | 0,18 | 4,02 | 0,9331 | 0,1620 | |||
| VNOM / Viper Energy, Inc. | 0,00 | 12,71 | 0,17 | −5,06 | 0,8717 | 0,0817 | |||
| CVE / Cenovus Energy Inc. | 0,01 | −14,60 | 0,17 | −16,42 | 0,8650 | −0,0287 | |||
| FTI / TechnipFMC plc | 0,00 | −24,70 | 0,17 | −18,23 | 0,8574 | −0,0464 | |||
| RRC / Range Resources Corporation | 0,00 | −5,64 | 0,17 | −3,51 | 0,8489 | 0,0869 | |||
| GLNG / Golar LNG Limited | 0,00 | −15,00 | 0,16 | −7,39 | 0,8378 | 0,0536 | |||
| TRP / TC Energy Corporation | 0,00 | −12,66 | 0,16 | −10,00 | 0,8352 | 0,0370 | |||
| PR / Permian Resources Corporation | 0,01 | −8,89 | 0,16 | −10,50 | 0,8341 | 0,0310 | |||
| OVV / Ovintiv Inc. | 0,00 | −4,32 | 0,16 | −15,34 | 0,8261 | −0,0117 | |||
| DINO / HF Sinclair Corporation | 0,00 | −13,42 | 0,14 | 7,69 | 0,7228 | 0,1464 | |||
| EQNR / Equinor ASA - Depositary Receipt (Common Stock) | 0,01 | −14,20 | 0,14 | −18,93 | 0,7086 | −0,0409 | |||
| AM / Antero Midstream Corporation | 0,01 | −5,58 | 0,14 | −0,73 | 0,7015 | 0,0927 | |||
| SEDG / SolarEdge Technologies, Inc. | 0,01 | −34,68 | 0,13 | −17,79 | 0,6910 | −0,0328 | |||
| TS / Tenaris S.A. - Depositary Receipt (Common Stock) | 0,00 | −2,46 | 0,13 | −6,47 | 0,6706 | 0,0504 | |||
| APA / APA Corporation | 0,01 | −5,93 | 0,13 | −18,35 | 0,6675 | −0,0360 | |||
| MTDR / Matador Resources Company | 0,00 | −3,96 | 0,12 | −10,29 | 0,6299 | 0,0242 | |||
| CHRD / Chord Energy Corporation | 0,00 | −4,14 | 0,12 | −17,69 | 0,6223 | −0,0295 | |||
| PBA / Pembina Pipeline Corporation | 0,00 | −1,44 | 0,12 | −7,09 | 0,6069 | 0,0400 | |||
| CNX / CNX Resources Corporation | 0,00 | −4,99 | 0,12 | 1,74 | 0,6022 | 0,0911 | |||
| MUSA / Murphy USA Inc. | 0,00 | −18,16 | 0,12 | −29,45 | 0,5934 | −0,1289 | |||
| ENPH / Enphase Energy, Inc. | 0,00 | 11,58 | 0,11 | −28,93 | 0,5826 | −0,1223 | |||
| CHX / ChampionX Corporation | 0,00 | 1,74 | 0,11 | −15,27 | 0,5749 | −0,0099 | |||
| NOV / NOV Inc. | 0,01 | −1,23 | 0,11 | −19,26 | 0,5626 | −0,0391 | |||
| TPL / Texas Pacific Land Corporation | 0,00 | 18,82 | 0,11 | −5,36 | 0,5480 | 0,0490 | |||
| MGY / Magnolia Oil & Gas Corporation | 0,00 | −6,23 | 0,11 | −16,54 | 0,5472 | −0,0185 | |||
| STNG / Scorpio Tankers Inc. | 0,00 | −14,99 | 0,10 | −11,86 | 0,5380 | 0,0137 | |||
| FRO / Frontline plc | 0,01 | −18,11 | 0,10 | −9,65 | 0,5340 | 0,0250 | |||
| CRC / California Resources Corporation | 0,00 | −7,92 | 0,10 | −4,76 | 0,5179 | 0,0508 | |||
| WFRD / Weatherford International plc | 0,00 | −3,46 | 0,10 | −9,26 | 0,5044 | 0,0247 | |||
| CNR / Core Natural Resources, Inc. | 0,00 | −2,72 | 0,10 | −11,82 | 0,5004 | 0,0099 | |||
| WHD / Cactus, Inc. | 0,00 | −5,00 | 0,10 | −9,43 | 0,4945 | 0,0238 | |||
| UEC / Uranium Energy Corp. | 0,01 | −10,46 | 0,10 | 28,38 | 0,4879 | 0,1575 | |||
| RIG / Transocean Ltd. | 0,04 | −23,50 | 0,09 | −37,58 | 0,4786 | −0,1819 | |||
| NE / Noble Corporation plc | 0,00 | −14,74 | 0,09 | −4,17 | 0,4756 | 0,0461 | |||
| MUR / Murphy Oil Corporation | 0,00 | −2,31 | 0,09 | −22,81 | 0,4537 | −0,0520 | |||
| SM / SM Energy Company | 0,00 | 0,26 | 0,08 | −17,65 | 0,4361 | −0,0187 | |||
| NOG / Northern Oil and Gas, Inc. | 0,00 | −7,00 | 0,08 | −13,54 | 0,4311 | 0,0047 | |||
| CRK / Comstock Resources, Inc. | 0,00 | −18,41 | 0,08 | 11,11 | 0,4151 | 0,0925 | |||
| CIVI / Civitas Resources, Inc. | 0,00 | −1,83 | 0,08 | −23,30 | 0,4105 | −0,0468 | |||
| VAL / Valaris Limited | 0,00 | −12,96 | 0,08 | −7,06 | 0,4083 | 0,0311 | |||
| PTEN / Patterson-UTI Energy, Inc. | 0,01 | 6,47 | 0,08 | −24,00 | 0,3950 | −0,0486 | |||
| PBF / PBF Energy Inc. | 0,00 | −3,94 | 0,07 | 9,09 | 0,3749 | 0,0783 | |||
| TDW / Tidewater Inc. | 0,00 | −15,02 | 0,07 | −7,69 | 0,3739 | 0,0261 | |||
| LEU / Centrus Energy Corp. | 0,00 | −10,76 | 0,07 | 162,96 | 0,3669 | 0,2465 | |||
| RUN / Sunrun Inc. | 0,01 | −20,06 | 0,07 | 11,29 | 0,3576 | 0,0812 | |||
| BTU / Peabody Energy Corporation | 0,01 | −2,06 | 0,07 | −2,90 | 0,3472 | 0,0384 | |||
| LBRT / Liberty Energy Inc. | 0,01 | 0,71 | 0,07 | −26,37 | 0,3449 | −0,0625 | |||
| CRGY / Crescent Energy Company | 0,01 | −11,30 | 0,06 | −32,26 | 0,3276 | −0,0888 | |||
| HP / Helmerich & Payne, Inc. | 0,00 | 14,33 | 0,06 | −34,52 | 0,2865 | −0,0860 | |||
| PLUG / Plug Power Inc. | 0,03 | 9,41 | 0,04 | 18,92 | 0,2308 | 0,0659 | |||
| NFE / New Fortress Energy Inc. | 0,01 | 41,09 | 0,04 | −44,44 | 0,2093 | −0,1110 | |||
| GPRE / Green Plains Inc. | 0,01 | 0,29 | 0,04 | 24,14 | 0,1895 | 0,0584 | |||
| VTLE / Vital Energy, Inc. | 0,00 | −0,63 | 0,03 | −25,00 | 0,1706 | −0,0247 | |||
| DE000C4SA6R6 / EURO STOXX 50 Index | 0,03 | 0,1522 | 0,1522 | ||||||
| Barclays Capital, Inc. / RA (N/A) | 0,01 | 0,0657 | 0,0657 | ||||||
| BofA Securities, Inc. / RA (N/A) | 0,01 | 0,0634 | 0,0634 |