Grundläggande statistik
| Institutionella ägare | 451 total, 446 long only, 0 short only, 5 long/short - change of 0,00% MRQ |
| Genomsnittlig portföljallokering | 0.2719 % - change of −11,80% MRQ |
| Institutionella aktier (lång) | 1 591 508 161 (ex 13D/G) - change of −102,68MM shares −6,06% MRQ |
| Institutionellt värde (lång) | $ 3 816 095 USD ($1000) |
Institutionellt ägande och aktieägare
Ambev S.A. - Depositary Receipt (Common Stock) (US:ABEV) har 451 Institutionella ägare och aktieägare som har lämnat in 13D/G- eller 13F-formulär till Securities Exchange Commission (SEC). Dessa institut innehar totalt 1,591,508,161 aktier. Största aktieägare inkluderar First Eagle Investment Management, LLC, SGENX - First Eagle Global Fund Class A, GQG Partners LLC, GQGPX - GQG PARTNERS EMERGING MARKETS EQUITY FUND Investor Shares, SGOVX - First Eagle Overseas Fund Class A, Renaissance Technologies Llc, Arrowstreet Capital, Limited Partnership, Massachusetts Financial Services Co /ma/, Seafarer Capital Partners, LLC, and Morgan Stanley .
Ambev S.A. - Depositary Receipt (Common Stock) (NYSE:ABEV) Institutionell ägarstruktur visar institutioners och fonders nuvarande positioner i företaget, samt de senaste förändringarna i positionernas storlek. Större aktieägare kan vara enskilda investerare, fonder, hedgefonder eller institutioner. Bilaga 13D visar att investeraren äger (eller ägde) mer än 5% av företaget och avser (eller avsåg) att aktivt eftersträva en förändring av affärsstrategin. Schedule 13G indikerar en passiv investering på över 5%.
The share price as of September 8, 2025 is 2,20 / share. Previously, on September 9, 2024, the share price was 2,37 / share. This represents a decline of 7,17% over that period.

Fondsentimentets poäng
Fondsentimentet poängen(fka Ägarackumulation-poäng) visar vilka aktier som är mest köpta av fonder. Det är resultatet av en sofistikerad kvantitativ flerfaktormodell som identifierar företag med de högsta nivåerna av institutionell ackumulering. Poängsättningsmodellen använder en kombination av den totala ökningen av redovisade ägare, förändringarna i portföljallokeringarna för dessa ägare och andra mått. Siffran sträcker sig från 0 till 100, där högre siffror indikerar en högre nivå av ackumulering i förhållande till sina konkurrenter, och 50 är genomsnittet.
Uppdateringsfrekvens: Dagligen
Se Ownership Explorer, som innehåller en lista över de högst rankade företagen.
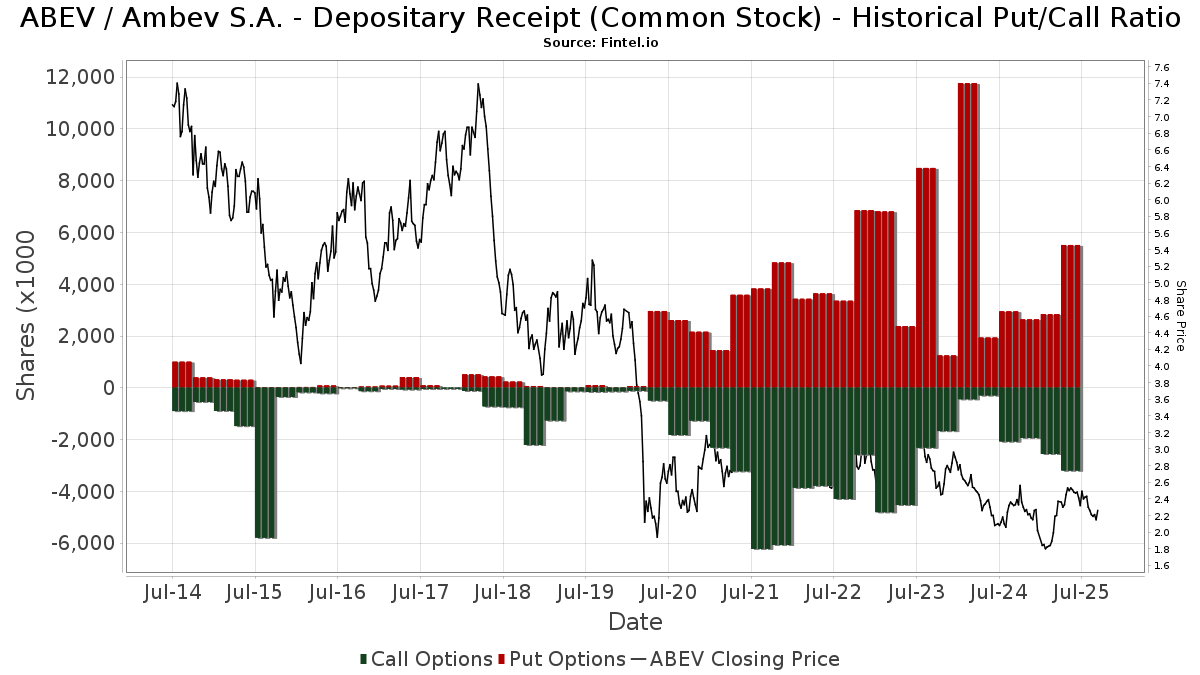
Institutionell sälj/köp-kvot
Förutom att rapportera vanliga eget kapital- och skuldemissioner måste institutioner med mer än 100MM tillgångar under förvaltning också avslöja sina innehav av sälj- och köpoptioner. Eftersom säljoptioner i allmänhet indikerar ett negativt sentiment och köpoptioner indikerar ett positivt sentiment, kan vi få en uppfattning om det övergripande institutionella sentimentet genom att plotta förhållandet mellan säljoptioner och köpoptioner. Diagrammet till höger visar det historiska förhållandet mellan sälj- och köpoptioner för detta instrument.
Genom att använda sälj/köp-kvoten som en indikator på aktieägarnas sentiment undviker man en av de största bristerna med att använda det totala institutionella ägandet, nämligen att en betydande del av de förvaltade tillgångarna investeras passivt för att följa index. Passivt förvaltade fonder köper vanligtvis inte optioner, så indikatorn för sälj/köp-kvoten ger en bättre bild av stämningen i aktivt förvaltade fonder.
13F- och NPORT-arkiveringar
Detaljer om 13F-arkiveringar är gratis. Detaljer om NP-arkiveringar kräver ett premiummedlemskap. Gröna rader indikerar nya positioner. Röda rader indikerar stängda positioner. Klicka på länk symbolen för att se hela transaktionshistoriken.
Uppgradera
för att låsa upp premiumdata och exportera till Excel ![]() .
.
| Fil Datum | Källa | Investerare | Typ | Genomsnittligt pris (beräknat) |
Aktier | Δ Aktier (%) |
Rapporterat värde (1000 USD) |
Δ Värde (%) |
Portföljallokering (%) |
|
|---|---|---|---|---|---|---|---|---|---|---|
| 2025-08-26 | NP | Profunds - Profund Vp Emerging Markets | 75 297 | 15,27 | 181 | 19,08 | ||||
| 2025-08-15 | 13F | Morgan Stanley | 28 022 484 | 32,77 | 67 534 | 37,33 | ||||
| 2025-05-07 | 13F | Pin Oak Investment Advisors Inc | 0 | −100,00 | 0 | |||||
| 2025-06-30 | NP | VEU - Vanguard FTSE All-World ex-US Index Fund ETF Shares | 3 139 140 | −1,53 | 7 942 | 34,68 | ||||
| 2025-05-13 | 13F | Arrowpoint Investment Partners (Singapore) Pte. Ltd. | 0 | −100,00 | 0 | |||||
| 2025-05-16 | 13F/A | Kestra Investment Management, LLC | 0 | −100,00 | 0 | −100,00 | ||||
| 2025-08-05 | 13F | Simplex Trading, Llc | 19 969 | −87,69 | 0 | |||||
| 2025-08-05 | 13F | Simplex Trading, Llc | Call | 67 800 | 0,00 | 0 | ||||
| 2025-08-19 | 13F | State of Wyoming | 78 437 | 98,04 | 189 | 105,43 | ||||
| 2025-08-04 | 13F | GAM Holding AG | 48 000 | 116 | ||||||
| 2025-07-08 | 13F | Baker Ellis Asset Management LLC | 42 000 | 0,00 | 101 | 4,12 | ||||
| 2025-05-12 | 13F | Peapack Gladstone Financial Corp | 0 | −100,00 | 0 | |||||
| 2025-08-14 | 13F | Atomi Financial Group, Inc. | 154 903 | 32,47 | 373 | 37,13 | ||||
| 2025-08-18 | 13F | Wolverine Trading, Llc | Put | 0 | −100,00 | 0 | −100,00 | |||
| 2025-08-14 | 13F | Henry James International Management Inc. | 15 173 | 1,28 | 37 | 5,88 | ||||
| 2025-07-10 | 13F | Exchange Traded Concepts, Llc | 2 326 308 | 177,31 | 5 606 | 186,90 | ||||
| 2025-07-15 | 13F | North Star Investment Management Corp. | 3 800 | 0,00 | 9 | 12,50 | ||||
| 2025-08-14 | 13F | GWM Advisors LLC | 19 420 | 21,75 | 47 | 24,32 | ||||
| 2025-07-07 | 13F | Investors Research Corp | 220 775 | 0,00 | 532 | 3,50 | ||||
| 2025-05-15 | 13F | Angeles Investment Advisors, LLC | 0 | −100,00 | 0 | |||||
| 2025-07-11 | 13F | Caldwell Securities, Inc | 111 | 0,00 | 0 | |||||
| 2025-06-27 | NP | DIVD - Altrius Global Dividend ETF | 87 752 | 68,32 | 222 | 131,25 | ||||
| 2025-08-06 | 13F | Paradigm Asset Management Co Llc | 17 935 | 0,00 | 43 | 4,88 | ||||
| 2025-07-21 | 13F | Qrg Capital Management, Inc. | 162 769 | 172,91 | 392 | 184,06 | ||||
| 2025-08-11 | 13F | Regal Investment Advisors LLC | 11 043 | −59,73 | 27 | −58,73 | ||||
| 2025-08-18 | 13F | Wolverine Trading, Llc | 0 | −100,00 | 0 | −100,00 | ||||
| 2025-07-29 | 13F | Aspiriant, Llc | 26 603 | 0,38 | 64 | 4,92 | ||||
| 2025-05-06 | 13F | One Wealth Advisors, LLC | 0 | −100,00 | 0 | |||||
| 2025-08-15 | 13F | CI Private Wealth, LLC | 2 927 709 | 1,71 | 7 056 | 5,20 | ||||
| 2025-08-05 | 13F | Bank Of Montreal /can/ | 551 237 | 0,12 | 1 328 | 3,59 | ||||
| 2025-08-08 | 13F | Geode Capital Management, Llc | 58 937 | −65,96 | 142 | −64,76 | ||||
| 2025-06-23 | NP | UUPIX - Ultraemerging Markets Profund Investor Class | 17 517 | 5,27 | 44 | 46,67 | ||||
| 2025-07-28 | 13F | Harbour Investments, Inc. | 247 | 0,00 | 1 | |||||
| 2025-08-12 | 13F | Brandywine Global Investment Management, LLC | 17 187 221 | −2,32 | 41 421 | 1,03 | ||||
| 2025-04-14 | 13F | Sivia Capital Partners, LLC | 0 | −100,00 | 0 | |||||
| 2025-07-28 | NP | AVSE - Avantis Responsible Emerging Markets Equity ETF | 33 693 | 13,25 | 82 | 34,43 | ||||
| 2025-07-08 | 13F/A | Salem Investment Counselors Inc | 4 000 | −4,76 | 10 | 0,00 | ||||
| 2025-08-06 | 13F | First Horizon Advisors, Inc. | 936 | −50,81 | 2 | −50,00 | ||||
| 2025-08-15 | 13F | Tower Research Capital LLC (TRC) | 27 392 | 66 | ||||||
| 2025-08-14 | 13F | Jane Street Group, Llc | Put | 165 800 | 400 | |||||
| 2025-07-23 | 13F | Bear Mountain Capital, Inc. | 30 | 0,00 | 0 | |||||
| 2025-08-14 | 13F | Jane Street Group, Llc | Call | 54 000 | 23,57 | 130 | 28,71 | |||
| 2025-08-14 | 13F | UBS Group AG | 11 586 720 | −19,81 | 27 924 | −17,06 | ||||
| 2025-08-14 | 13F | CIBC World Markets Inc. | 5 485 106 | 1,27 | 13 219 | 4,75 | ||||
| 2025-07-21 | 13F | Riverview Trust Co | 31 548 | 0,00 | 76 | 4,11 | ||||
| 2025-03-31 | NP | VIHAX - Vanguard International High Dividend Yield Index Fund Admiral Shares | 348 | 0,00 | 1 | |||||
| 2025-07-14 | 13F | Abound Wealth Management | 78 | 0,00 | 0 | |||||
| 2025-08-14 | 13F | Van Eck Associates Corp | 1 193 934 | 72,86 | 3 | 100,00 | ||||
| 2025-06-25 | NP | SFGIX - Seafarer Overseas Growth and Income Fund Investor | 28 000 000 | −3,45 | 70 840 | 32,04 | ||||
| 2025-04-25 | 13F | New Wave Wealth Advisors Llc | 0 | −100,00 | 0 | |||||
| 2025-08-13 | 13F | Loomis Sayles & Co L P | 18 092 234 | −0,98 | 43 602 | 103 714,29 | ||||
| 2025-07-29 | 13F | Stephens Inc /ar/ | 215 041 | 0,68 | 518 | 4,23 | ||||
| 2025-08-29 | NP | LIVR - Intelligent Livermore ETF | 65 040 | 157 | ||||||
| 2025-08-04 | 13F | Assetmark, Inc | 171 943 | 149,74 | 414 | 158,75 | ||||
| 2025-04-10 | 13F | Sugar Maple Asset Management, LLC | 0 | −100,00 | 0 | |||||
| 2025-08-13 | 13F | West Family Investments, Inc. | 46 928 | 113 | ||||||
| 2025-08-19 | NP | RIFAX - U.S. Strategic Equity Fund | 314 182 | 6,18 | 757 | 9,87 | ||||
| 2025-08-14 | 13F | Two Sigma Securities, Llc | 634 330 | 137,07 | 1 529 | 145,26 | ||||
| 2025-08-28 | NP | GQGPX - GQG PARTNERS EMERGING MARKETS EQUITY FUND Investor Shares | 86 666 901 | −15,40 | 208 867 | 10,21 | ||||
| 2025-06-26 | NP | DFAX - Dimensional World ex U.S. Core Equity 2 ETF | 147 706 | 0,00 | 374 | 36,63 | ||||
| 2025-08-18 | 13F/A | National Bank Of Canada /fi/ | 104 032 | 53,75 | 250 | 59,62 | ||||
| 2025-08-13 | 13F | Kiltearn Partners LLP | 10 455 700 | −7,97 | 25 198 | −4,81 | ||||
| 2025-08-05 | 13F | Simplex Trading, Llc | Put | 422 300 | −2,20 | 1 | 0,00 | |||
| 2025-07-31 | 13F | Oppenheimer Asset Management Inc. | 228 538 | −3,59 | 551 | −0,36 | ||||
| 2025-07-21 | 13F | Monticello Wealth Management, Llc | 108 856 | 0,00 | 262 | 3,56 | ||||
| 2025-08-13 | 13F | Twin Peaks Wealth Advisors, LLC | 569 | 1 | ||||||
| 2025-07-15 | 13F | Fortitude Family Office, LLC | 0 | −100,00 | 0 | |||||
| 2025-08-13 | 13F | Flow Traders U.s. Llc | 0 | −100,00 | 0 | |||||
| 2025-08-11 | 13F | Citigroup Inc | 156 655 | 3,92 | 378 | 7,41 | ||||
| 2025-08-05 | 13F | Bank of New York Mellon Corp | 847 888 | −0,22 | 2 043 | 3,23 | ||||
| 2025-08-14 | 13F | Aprio Wealth Management, LLC | 44 670 | 121,13 | 108 | 127,66 | ||||
| 2025-08-14 | 13F | EP Wealth Advisors, Inc. | 50 726 | 122 | ||||||
| 2025-07-30 | 13F | Privium Fund Management B.V. | 795 786 | −1,05 | 1 926 | 2,78 | ||||
| 2025-08-11 | 13F | Principal Securities, Inc. | 12 973 | −62,59 | 31 | −51,56 | ||||
| 2025-07-28 | NP | NSI - National Security Emerging Markets Index ETF | 32 003 | 38,46 | 78 | 65,96 | ||||
| 2025-05-13 | 13F | Vestmark Advisory Solutions, Inc. | 0 | −100,00 | 0 | |||||
| 2025-08-14 | 13F | Jain Global LLC | 44 910 | −56,19 | 108 | −54,62 | ||||
| 2025-07-28 | 13F | Moran Wealth Management, LLC | 1 886 937 | 1,27 | 4 548 | 4,75 | ||||
| 2025-08-12 | 13F | Steward Partners Investment Advisory, Llc | 4 584 | −0,63 | 11 | 10,00 | ||||
| 2025-05-27 | NP | Brighthouse Funds Trust I - Brighthouse/Aberdeen Emerging Markets Equity Portfolio Class A | 755 200 | −8,63 | 1 760 | 15,04 | ||||
| 2025-05-13 | 13F | Summitry Llc | 0 | −100,00 | 0 | −100,00 | ||||
| 2025-07-24 | 13F | Commerzbank Aktiengesellschaft /fi | 73 961 | 0,00 | 0 | |||||
| 2025-08-01 | 13F | Bessemer Group Inc | 54 780 | 435,80 | 0 | |||||
| 2025-07-25 | 13F | Allspring Global Investments Holdings, LLC | 14 615 507 | −14,61 | 35 370 | −11,69 | ||||
| 2025-07-16 | 13F | Traveka Wealth, LLC | 17 324 | 65,68 | 42 | 70,83 | ||||
| 2025-07-29 | 13F | Unison Advisors LLC | 304 963 | 2,18 | 742 | 5,56 | ||||
| 2025-08-14 | 13F | Axa S.a. | 26 156 | 0,00 | 63 | 5,00 | ||||
| 2025-08-14 | 13F | Silvercrest Asset Management Group Llc | 17 750 | 0,00 | 43 | 2,44 | ||||
| 2025-08-14 | 13F | VPR Management LLC | 616 839 | 0,00 | 1 487 | 3,41 | ||||
| 2025-08-14 | 13F | Balyasny Asset Management Llc | 10 229 | 25 | ||||||
| 2025-08-19 | 13F | Marex Group plc | 19 740 | 48 | ||||||
| 2025-06-25 | NP | EPDPX - EuroPac International Dividend Income Fund Class A | 700 000 | 0,00 | 1 771 | 36,76 | ||||
| 2025-08-12 | 13F | Aigen Investment Management, Lp | 40 434 | 97 | ||||||
| 2025-03-24 | NP | SLANX - DWS Latin America Equity Fund Class A | 784 200 | −32,99 | 1 451 | −60,28 | ||||
| 2025-08-07 | 13F | Allworth Financial LP | 25 843 | −8,51 | 62 | −10,14 | ||||
| 2025-07-08 | 13F | Nbc Securities, Inc. | 215 238 | −6,62 | 1 | |||||
| 2025-07-31 | 13F | Oppenheimer & Co Inc | 20 487 | 9,99 | 49 | 13,95 | ||||
| 2025-08-07 | 13F | Acadian Asset Management Llc | 0 | −100,00 | 0 | |||||
| 2025-08-20 | NP | REMG - Emerging Markets Equity Active ETF | 54 285 | 131 | ||||||
| 2025-08-08 | 13F | Avantax Advisory Services, Inc. | 743 873 | 0,63 | 1 793 | 4,07 | ||||
| 2025-08-13 | 13F | Tranquilli Financial Advisor LLC | 29 858 | 42,57 | 72 | 47,92 | ||||
| 2025-08-06 | 13F | First Eagle Investment Management, LLC | 338 661 869 | −0,85 | 816 175 | 2,55 | ||||
| 2025-07-31 | 13F | CVA Family Office, LLC | 80 000 | 0,00 | 193 | 3,23 | ||||
| 2025-04-25 | 13F | Iron Financial, LLC | 0 | −100,00 | 0 | |||||
| 2025-07-14 | 13F | UMA Financial Services, Inc. | 1 422 | 38,06 | 3 | 50,00 | ||||
| 2025-07-25 | 13F | We Are One Seven, LLC | 18 157 | −3,30 | 44 | 0,00 | ||||
| 2025-08-01 | 13F | Banco Santander, S.A. | 18 083 | −97,73 | 44 | −97,68 | ||||
| 2025-07-25 | 13F | Meritage Portfolio Management | 1 701 220 | −2,89 | 4 100 | 0,44 | ||||
| 2025-08-11 | 13F | Hexagon Capital Partners LLC | 0 | −100,00 | 0 | |||||
| 2025-08-14 | 13F | Smartleaf Asset Management LLC | 139 | 0,00 | 0 | |||||
| 2025-07-29 | NP | GMEMX - GMO Emerging Markets Fund Class II | 711 000 | 1 735 | ||||||
| 2025-06-25 | NP | SFVLX - Seafarer Overseas Value Fund Investor Class | 1 069 000 | 0,00 | 2 705 | 36,77 | ||||
| 2025-05-05 | 13F | Morningstar Investment Services LLC | 0 | −100,00 | 0 | |||||
| 2025-08-14 | 13F | Capitolis Liquid Global Markets LLC | 0 | −100,00 | 0 | |||||
| 2025-08-14 | 13F | Mercer Global Advisors Inc /adv | 54 896 | 27,06 | 132 | 32,00 | ||||
| 2025-04-30 | 13F | Genus Capital Management Inc. | Put | 0 | −100,00 | 0 | −100,00 | |||
| 2025-08-18 | 13F | Geneos Wealth Management Inc. | 7 182 | 38,06 | 17 | 41,67 | ||||
| 2025-07-16 | 13F | Perigon Wealth Management, LLC | 10 645 | −9,46 | 26 | −7,41 | ||||
| 2025-08-14 | 13F | Optiver Holding B.V. | 1 642 000 | 3,56 | 3 957 | 7,12 | ||||
| 2025-07-29 | NP | PHSWX - Parvin Hedged Equity Solari World Fund | 85 000 | 13,33 | 207 | 33,55 | ||||
| 2025-08-13 | 13F | RWC Asset Management LLP | 11 829 282 | −5,35 | 28 509 | −2,09 | ||||
| 2025-08-14 | 13F | Optiver Holding B.V. | Call | 2 398 900 | 13,00 | 5 781 | 16,88 | |||
| 2025-04-11 | 13F | First Affirmative Financial Network | 66 993 | 47,71 | 156 | 87,95 | ||||
| 2025-08-14 | 13F | Optiver Holding B.V. | Put | 1 912 600 | 37,23 | 4 609 | 41,95 | |||
| 2025-08-14 | 13F | Sei Investments Co | 3 687 614 | 0,74 | 8 887 | 4,20 | ||||
| 2025-08-14 | 13F | Cubist Systematic Strategies, LLC | 2 126 114 | 5 124 | ||||||
| 2025-08-14 | 13F | Strategic Global Advisors, LLC | 195 549 | 21,44 | 471 | 25,60 | ||||
| 2025-08-14 | 13F | Talaria Asset Management Pty Ltd | 14 094 900 | −32,45 | 33 969 | −30,13 | ||||
| 2025-05-15 | 13F | Laird Norton Trust Company, Llc | 0 | −100,00 | 0 | |||||
| 2025-07-28 | 13F | Rosenberg Matthew Hamilton | 4 442 | 0,00 | 11 | 0,00 | ||||
| 2025-07-25 | 13F | Endowment Wealth Management, Inc. | 15 741 | −1,82 | 38 | 0,00 | ||||
| 2025-08-12 | 13F | SPX Equities Gestao de Recursos Ltda | 1 990 483 | −22,38 | 4 797 | −19,70 | ||||
| 2025-08-14 | 13F | Point72 Asset Management, L.P. | 2 596 700 | 99,46 | 6 258 | 106,33 | ||||
| 2025-08-14 | 13F | Aqr Capital Management Llc | 178 601 | −90,48 | 430 | −90,16 | ||||
| 2025-08-11 | 13F | Private Advisor Group, LLC | 13 856 | 21,54 | 33 | 26,92 | ||||
| 2025-05-22 | NP | QSPIX - AQR Style Premia Alternative Fund Class I | 32 188 | −10,07 | 75 | 12,12 | ||||
| 2025-07-22 | 13F | Global Assets Advisory, LLC | 0 | −100,00 | 0 | |||||
| 2025-05-09 | 13F | Abc Arbitrage Sa | 0 | −100,00 | 0 | −100,00 | ||||
| 2025-05-15 | 13F | WPG Advisers, LLC | 0 | −100,00 | 0 | −100,00 | ||||
| 2025-07-25 | 13F | Cwm, Llc | 6 309 | −8,62 | 0 | |||||
| 2025-05-07 | 13F | Ibex Investors LLC | 0 | −100,00 | 0 | |||||
| 2025-08-14 | 13F | Wells Fargo & Company/mn | 4 373 885 | 4,73 | 10 541 | 8,34 | ||||
| 2025-04-23 | 13F | Mascagni Wealth Management, Inc. | 0 | −100,00 | 0 | −100,00 | ||||
| 2025-05-13 | 13F | Seven Mile Advisory | 0 | −100,00 | 0 | |||||
| 2025-08-28 | NP | TMLCX - Simt Tax-managed Large Cap Fund Class F | 81 301 | −87,51 | 196 | −83,80 | ||||
| 2025-07-15 | 13F | Jeppson Wealth Management, Llc | 75 205 | 7,50 | 181 | 11,73 | ||||
| 2025-07-28 | NP | VCGEX - Emerging Economies Fund | 335 736 | −58,26 | 819 | −55,12 | ||||
| 2025-08-14 | 13F/A | Bank Julius Baer & Co. Ltd, Zurich | 38 490 | 13,02 | 93 | 3,37 | ||||
| 2025-08-13 | 13F | Renaissance Technologies Llc | 43 549 800 | 12,46 | 104 955 | 16,32 | ||||
| 2025-07-14 | 13F | Kapitalo Investimentos Ltda | 564 136 | 1 360 | ||||||
| 2025-07-11 | 13F | Grove Bank & Trust | 19 795 | −0,16 | 48 | 2,17 | ||||
| 2025-08-08 | 13F | Cetera Investment Advisers | 140 830 | 21,51 | 339 | 25,56 | ||||
| 2025-08-12 | 13F | Global Retirement Partners, LLC | 966 | 29,49 | 2 | 100,00 | ||||
| 2025-05-30 | NP | JOEMX - JOHCM Emerging Markets Opportunities Fund Class Z Shares | 0 | −100,00 | 0 | −100,00 | ||||
| 2025-08-14 | 13F | Integrated Wealth Concepts LLC | 10 956 | −0,90 | 26 | 4,00 | ||||
| 2025-07-22 | 13F | Merit Financial Group, LLC | 60 899 | 12,27 | 147 | 15,87 | ||||
| 2025-08-27 | NP | TIFF INVESTMENT PROGRAM - TIFF Multi-Asset Fund | 11 169 | 27 | ||||||
| 2025-08-12 | 13F | Longfellow Investment Management Co Llc | 998 136 | −75,13 | 2 406 | −74,28 | ||||
| 2025-04-25 | 13F | Washington Trust Advisors, Inc. | 0 | −100,00 | 0 | −100,00 | ||||
| 2025-08-07 | 13F | Profund Advisors Llc | 196 577 | 1,60 | 474 | 5,11 | ||||
| 2025-08-28 | NP | FEOVX - First Eagle Overseas Variable Fund | 1 343 830 | −1,87 | 3 239 | 1,50 | ||||
| 2025-08-13 | 13F | Northern Trust Corp | 5 008 062 | −35,44 | 12 069 | −33,22 | ||||
| 2025-05-06 | 13F | Rsm Us Wealth Management Llc | 0 | −100,00 | 0 | |||||
| 2025-08-14 | 13F | Parvin Asset Management, LLC | 351 400 | 4,82 | 847 | 8,32 | ||||
| 2025-08-27 | 13F/A | Squarepoint Ops LLC | 328 262 | 402,54 | 791 | 420,39 | ||||
| 2025-08-06 | 13F | SOUTH STATE Corp | 396 | 1 | ||||||
| 2025-04-17 | 13F | Janney Montgomery Scott LLC | 0 | −100,00 | 0 | |||||
| 2025-08-08 | 13F | Renasant Bank | 21 842 | −11,54 | 53 | −8,77 | ||||
| 2025-08-05 | 13F | Seafarer Capital Partners, LLC | 29 069 000 | 0,00 | 70 056 | 3,43 | ||||
| 2025-04-29 | 13F | Td Private Client Wealth Llc | 0 | −100,00 | 0 | |||||
| 2025-08-04 | 13F | Hantz Financial Services, Inc. | 870 608 | 4,07 | 2 | 100,00 | ||||
| 2025-07-30 | 13F | Ethic Inc. | 650 576 | 8,61 | 1 535 | 9,56 | ||||
| 2025-04-30 | 13F | Investment Management Associates Inc /adv | 0 | −100,00 | 0 | −100,00 | ||||
| 2025-08-14 | 13F | Ieq Capital, Llc | 123 930 | 299 | ||||||
| 2025-08-04 | 13F | Arkadios Wealth Advisors | 92 244 | −18,66 | 222 | −15,91 | ||||
| 2025-05-15 | 13F | Farringdon Capital, Ltd. | 0 | −100,00 | 0 | |||||
| 2025-08-05 | 13F | Tiaa Trust, National Association | 0 | −100,00 | 0 | |||||
| 2025-07-21 | 13F | Credential Securities Inc. | 0 | −100,00 | 0 | −100,00 | ||||
| 2025-07-28 | 13F | Naviter Wealth, LLC | 0 | −100,00 | 0 | |||||
| 2025-08-12 | 13F | Pacer Advisors, Inc. | 0 | −100,00 | 0 | |||||
| 2025-05-13 | 13F | Sprucegrove Investment Management Ltd | 0 | −100,00 | 0 | |||||
| 2025-04-11 | 13F | Foster Group, Inc. | 0 | −100,00 | 0 | |||||
| 2025-05-07 | 13F | Werba Rubin Papier Wealth Management | 0 | −100,00 | 0 | −100,00 | ||||
| 2025-07-14 | 13F | Abacus Wealth Partners, LLC | 10 480 | 25 | ||||||
| 2025-07-31 | 13F | Fielder Capital Group LLC | 88 689 | 0,00 | 214 | 3,40 | ||||
| 2025-07-18 | 13F | Generali Investments CEE, investicni spolecnost, a.s. | 221 750 | 0,00 | 534 | 3,49 | ||||
| 2025-08-12 | 13F | Proequities, Inc. | Put | 0 | 0 | |||||
| 2025-05-13 | 13F | Wealthedge Investment Advisors, Llc | 0 | −100,00 | 0 | |||||
| 2025-08-11 | 13F | Vanguard Group Inc | 5 711 647 | 0,02 | 13 765 | 3,46 | ||||
| 2025-08-12 | 13F | Proequities, Inc. | Call | 0 | 0 | |||||
| 2025-08-12 | 13F | Franklin Resources Inc | 751 208 | 11,64 | 1 810 | 15,51 | ||||
| 2025-08-12 | 13F | Proequities, Inc. | 0 | 0 | ||||||
| 2025-05-14 | 13F | PineBridge Investments, L.P. | 0 | −100,00 | 0 | |||||
| 2025-08-11 | 13F | HighTower Advisors, LLC | 33 829 | −4,98 | 82 | −1,22 | ||||
| 2025-07-29 | NP | JSTC - Adasina Social Justice All Cap Global ETF | 451 192 | 21,42 | 1 101 | 43,04 | ||||
| 2025-07-24 | 13F | Callan Family Office, LLC | 216 501 | 152,82 | 522 | 161,81 | ||||
| 2025-08-14 | 13F | Ruggaard & Associates LLC | 10 000 | 0,00 | 24 | 4,35 | ||||
| 2025-07-11 | 13F | Pinnacle Bancorp, Inc. | 7 028 | −8,38 | 17 | −5,88 | ||||
| 2025-08-14 | 13F | FIL Ltd | 3 000 000 | −97,70 | 7 230 | −97,62 | ||||
| 2025-08-13 | 13F | M&t Bank Corp | 13 000 | 0,00 | 31 | 3,33 | ||||
| 2025-08-15 | 13F | Earnest Partners Llc | 684 577 | −6,80 | 1 650 | −3,62 | ||||
| 2025-06-25 | NP | EPIVX - EuroPac International Value Fund Class A | 750 656 | 0,00 | 1 899 | 36,82 | ||||
| 2025-08-01 | 13F | Envestnet Asset Management Inc | 3 178 860 | 7,20 | 7 661 | 10,88 | ||||
| 2025-08-13 | 13F | Fisher Asset Management, LLC | 805 384 | −14,18 | 1 941 | −11,25 | ||||
| 2025-08-06 | 13F | Metis Global Partners, LLC | 30 437 | 13,95 | 73 | 17,74 | ||||
| 2025-07-24 | 13F | Blair William & Co/il | 136 022 | −0,11 | 328 | 3,15 | ||||
| 2025-08-13 | 13F | Quadrant Capital Group Llc | 240 517 | 1 052,78 | 580 | 1 106,25 | ||||
| 2025-08-15 | 13F/A | Symphony Financial, Ltd. Co. | 13 737 | 34 | ||||||
| 2025-05-14 | 13F | Baron Wealth Management LLC | 0 | −100,00 | 0 | |||||
| 2025-04-29 | 13F | Stage Harbor Financial, Llc | 0 | −100,00 | 0 | |||||
| 2025-07-22 | 13F | Checchi Capital Advisers, LLC | 34 029 | 8,29 | 82 | 12,33 | ||||
| 2025-08-11 | 13F | Aptus Capital Advisors, LLC | 0 | −100,00 | 0 | |||||
| 2025-08-27 | NP | JNL SERIES TRUST - JNL Multi-Manager Alternative Fund (A) | 1 025 427 | 0,00 | 2 471 | 3,43 | ||||
| 2025-08-12 | 13F | Rhumbline Advisers | 411 981 | 2,50 | 993 | 5,98 | ||||
| 2025-08-14 | 13F | Aquatic Capital Management LLC | 2 329 999 | 19,58 | 5 615 | 23,71 | ||||
| 2025-07-30 | 13F | Bogart Wealth, LLC | 2 555 | 0,00 | 6 | 20,00 | ||||
| 2025-04-16 | 13F | Quintet Private Bank (Europe) S.A. | 0 | −100,00 | 0 | |||||
| 2025-05-15 | 13F | Advisors Asset Management, Inc. | 0 | −100,00 | 0 | |||||
| 2025-08-06 | 13F | Genus Capital Management Inc. | 61 608 | −6,65 | 148 | −3,27 | ||||
| 2025-08-13 | 13F | Quantbot Technologies LP | 63 056 | 7,20 | 152 | 10,22 | ||||
| 2025-07-25 | 13F | LRI Investments, LLC | 300 | 0,00 | 1 | |||||
| 2025-08-12 | 13F | CIBC Private Wealth Group, LLC | 7 250 | 0,00 | 17 | 13,33 | ||||
| 2025-08-13 | 13F | Qtron Investments LLC | 277 363 | 18,57 | 668 | 22,57 | ||||
| 2025-06-26 | NP | DFA INVESTMENT DIMENSIONS GROUP INC - World ex U.S. Core Equity Portfolio Institutional Class Shares | 123 103 | 0,00 | 311 | 37,00 | ||||
| 2025-09-09 | 13F | NWF Advisory Services Inc. | 17 902 | −14,56 | 43 | −10,42 | ||||
| 2025-08-13 | 13F | Cerity Partners LLC | 179 642 | 24,42 | 433 | 28,87 | ||||
| 2025-06-30 | NP | VGTSX - Vanguard Total International Stock Index Fund Investor Shares | 383 229 | 0,00 | 970 | 36,86 | ||||
| 2025-07-18 | 13F | Robeco Institutional Asset Management B.V. | 482 048 | 21,43 | 1 162 | 25,65 | ||||
| 2025-04-30 | 13F | Personal Cfo Solutions, Llc | 0 | −100,00 | 0 | |||||
| 2025-08-12 | 13F | OneAscent Financial Services LLC | 18 144 | −43,29 | 0 | |||||
| 2025-08-07 | 13F | Verus Capital Partners, Llc | 70 000 | −12,50 | 169 | −9,68 | ||||
| 2025-08-12 | 13F | Country Trust Bank | 724 | 0,00 | 2 | 0,00 | ||||
| 2025-07-28 | NP | AVEEX - Avantis Emerging Markets Equity Fund Institutional Class This fund is a listed as child fund of American Century Companies Inc and if that institution has disclosed ownership in this security, then these positions will not be double counted when calculating total shares and total value | 162 318 | 0,00 | 396 | 18,21 | ||||
| 2025-05-01 | 13F | Marks Group Wealth Management, Inc | 0 | −100,00 | 0 | −100,00 | ||||
| 2025-08-13 | 13F | Schroder Investment Management Group | 6 095 221 | −11,97 | 14 689 | −6,95 | ||||
| 2025-07-17 | 13F | Sound Income Strategies, LLC | 0 | −100,00 | 0 | |||||
| 2025-05-09 | 13F | GeoWealth Management, LLC | 0 | −100,00 | 0 | |||||
| 2025-07-29 | NP | GIMFX - GMO Implementation Fund | 500 000 | 741,75 | 1 220 | 601,15 | ||||
| 2025-07-31 | 13F | Hartford Financial Management Inc. | 11 283 | −10,06 | 27 | −6,90 | ||||
| 2025-08-13 | 13F | Dodge & Cox | 260 400 | 0,00 | 628 | 3,47 | ||||
| 2025-08-01 | 13F | Motco | 252 708 | −0,68 | 551 | −7,09 | ||||
| 2025-07-29 | 13F | Burford Brothers, Inc. | 533 934 | 577,54 | 1 287 | 602,73 | ||||
| 2025-08-14 | 13F | Hara Capital LLC | 28 788 | −66,51 | 69 | −65,50 | ||||
| 2025-08-13 | 13F | GQG Partners LLC | 150 859 260 | 363 571 | ||||||
| 2025-07-11 | 13F | Perpetual Ltd | 1 315 091 | −55,89 | 3 169 | −54,37 | ||||
| 2025-08-14 | 13F | Macquarie Group Ltd | 4 687 076 | 19,19 | 11 296 | 23,28 | ||||
| 2025-06-25 | NP | EMGAX - Wells Fargo Emerging Markets Equity Fund Class A | 7 522 792 | −12,34 | 19 033 | 19,88 | ||||
| 2025-08-18 | 13F | Wolverine Trading, Llc | Call | 17 800 | −5,32 | 42 | 0,00 | |||
| 2025-07-30 | 13F | Cullen/frost Bankers, Inc. | 32 075 | 0,00 | 77 | 4,05 | ||||
| 2025-08-11 | 13F | TD Waterhouse Canada Inc. | 89 250 | 0,00 | 215 | 3,37 | ||||
| 2025-06-25 | NP | IEMGX - Voya Multi-Manager Emerging Markets Equity Fund Class I | 213 200 | 0,00 | 539 | 36,80 | ||||
| 2025-07-15 | 13F | Mather Group, Llc. | 0 | −100,00 | 0 | |||||
| 2025-07-25 | 13F | Yousif Capital Management, Llc | 59 597 | −15,68 | 144 | −12,80 | ||||
| 2025-06-27 | NP | SGENX - First Eagle Global Fund Class A | 166 791 911 | 0,00 | 421 984 | 36,76 | ||||
| 2025-08-14 | 13F | Ancora Advisors, LLC | 0 | −100,00 | 0 | |||||
| 2025-08-15 | 13F | Great West Life Assurance Co /can/ | 13 409 316 | 74,85 | 33 | 77,78 | ||||
| 2025-08-13 | 13F | Foresight Global Investors, Inc. | 3 077 365 | −12,77 | 7 416 | −9,78 | ||||
| 2025-08-11 | 13F | Great Lakes Advisors, Llc | 7 684 611 | 55,11 | 18 520 | 60,43 | ||||
| 2025-08-07 | 13F | Sierra Ocean, Llc | 974 | 81,38 | 2 | 100,00 | ||||
| 2025-06-25 | NP | VVIFX - Voya VACS Series EME Fund | 453 583 | 0,00 | 1 148 | 36,71 | ||||
| 2025-08-11 | 13F | United Capital Financial Advisers, Llc | 0 | −100,00 | 0 | |||||
| 2025-07-08 | 13F | Parallel Advisors, LLC | 38 203 | 66,00 | 92 | 73,58 | ||||
| 2025-08-08 | 13F | Massachusetts Financial Services Co /ma/ | 32 193 532 | −14,23 | 77 586 | −11,28 | ||||
| 2025-08-12 | 13F | Dynamic Technology Lab Private Ltd | 25 116 | −23,23 | 61 | −19,74 | ||||
| 2025-04-21 | 13F | Riverbridge Partners Llc | 0 | −100,00 | 0 | |||||
| 2025-05-15 | 13F | CAPROCK Group, Inc. | 109 468 | 67,92 | 257 | 102,36 | ||||
| 2025-05-15 | 13F | Aureus Asset Management, LLC | 0 | −100,00 | 0 | |||||
| 2025-05-09 | 13F | NewEdge Wealth, LLC | 0 | −100,00 | 0 | |||||
| 2025-08-14 | 13F | Engineers Gate Manager LP | 108 806 | 262 | ||||||
| 2025-05-13 | 13F | Employees Retirement System of Texas | 0 | −100,00 | 0 | |||||
| 2025-07-08 | 13F | Northwest & Ethical Investments L.P. | 0 | −100,00 | 0 | −100,00 | ||||
| 2025-08-14 | 13F | Benjamin Edwards Inc | 22 607 | 54 | ||||||
| 2025-08-04 | 13F | Keybank National Association/oh | 87 655 | 2,17 | 211 | 6,03 | ||||
| 2025-07-30 | NP | PZINX - Pzena International Value Fund Institutional | 13 543 | 0,00 | 33 | 17,86 | ||||
| 2025-07-30 | 13F | Rehmann Capital Advisory Group | 23 129 | 56 | ||||||
| 2025-07-14 | 13F | Park Avenue Securities Llc | 45 675 | 9,33 | 0 | |||||
| 2025-06-23 | NP | UBPIX - Ultralatin America Profund Investor Class | 87 582 | −6,18 | 222 | 28,49 | ||||
| 2025-05-07 | 13F | Wealthstream Advisors, Inc. | 0 | −100,00 | 0 | |||||
| 2025-08-27 | NP | Jnl Series Trust - Jnl/lazard Emerging Markets Fund (a) | 1 029 391 | −18,43 | 2 481 | 6,26 | ||||
| 2025-08-13 | 13F | Marshall Wace, Llp | 4 208 299 | 192,73 | 10 142 | 202,84 | ||||
| 2025-07-14 | 13F | GAMMA Investing LLC | 5 954 | 26,14 | 14 | 40,00 | ||||
| 2025-06-25 | NP | GERIX - Goldman Sachs Emerging Markets Equity Insights Fund Institutional | 664 300 | −78,42 | 1 681 | −80,51 | ||||
| 2025-08-12 | 13F | O'shaughnessy Asset Management, Llc | 579 745 | 49,79 | 1 397 | 55,05 | ||||
| 2025-04-02 | 13F | Park National Corp /oh/ | 0 | −100,00 | 0 | |||||
| 2025-07-28 | NP | AVXC - Avantis Emerging Markets ex-China Equity ETF | 40 373 | 37,48 | 99 | 63,33 | ||||
| 2025-08-26 | NP | KXI - iShares Global Consumer Staples ETF | 979 785 | 15,02 | 2 361 | 19,00 | ||||
| 2025-08-28 | NP | SLGAX - SIMT Large Cap Fund Class F | 1 367 493 | 49,72 | 3 296 | 54,84 | ||||
| 2025-08-29 | NP | LIGYX - Loomis Sayles International Growth Fund Class Y | 309 650 | −1,65 | 746 | 1,77 | ||||
| 2025-08-25 | NP | DSTX - Distillate International Fundamental Stability & Value ETF | 198 108 | 7,14 | 477 | 10,93 | ||||
| 2025-07-15 | 13F | Ballentine Partners, LLC | 73 900 | 104,98 | 178 | 111,90 | ||||
| 2025-07-29 | NP | CAVAX - Catholic Values Equity Fund Class F, effective 1-31-2017 (formerly Class A) | 33 504 | 0,00 | 82 | 17,39 | ||||
| 2025-08-11 | 13F | B. Metzler seel. Sohn & Co. AG | 654 320 | 1 577 | ||||||
| 2025-07-24 | 13F | Insight Inv LLC | 0 | −100,00 | 0 | |||||
| 2025-06-26 | NP | FSGEX - Fidelity Series Global ex U.S. Index Fund This fund is a listed as child fund of Fmr Llc and if that institution has disclosed ownership in this security, then these positions will not be double counted when calculating total shares and total value | 145 070 | −61,84 | 367 | −47,80 | ||||
| 2025-08-13 | 13F | Arrowstreet Capital, Limited Partnership | 42 553 928 | −23,66 | 102 555 | −21,04 | ||||
| 2025-05-15 | 13F | Dimension Capital Management Llc | 0 | −100,00 | 0 | |||||
| 2025-07-18 | 13F | Ninety One UK Ltd | 2 799 396 | −9,45 | 6 747 | −6,34 | ||||
| 2025-07-22 | 13F | Red Door Wealth Management, LLC | 19 000 | 0,00 | 46 | 2,27 | ||||
| 2025-07-23 | 13F | Viewpoint Capital Management LLC | 16 300 | 0,00 | 39 | 5,41 | ||||
| 2025-08-13 | 13F | Jones Financial Companies Lllp | 106 908 | −1,51 | 252 | 2,02 | ||||
| 2025-04-29 | 13F | Resources Investment Advisors, LLC. | 0 | −100,00 | 0 | |||||
| 2025-07-30 | 13F | Onyx Bridge Wealth Group LLC | 37 368 | 0,00 | 90 | 3,45 | ||||
| 2025-05-09 | 13F | Pitcairn Co | 0 | −100,00 | 0 | |||||
| 2025-06-30 | NP | ECOW - Pacer Emerging Markets Cash Cows 100 ETF | 704 024 | −9,19 | 1 781 | 24,20 | ||||
| 2025-05-13 | 13F | Mondrian Investment Partners LTD | 27 466 | 31,98 | 64 | 65,79 | ||||
| 2025-07-22 | 13F | Kercheville Advisors, LLC | 39 400 | 95 | ||||||
| 2025-05-15 | 13F | Citadel Advisors Llc | 0 | −100,00 | 0 | −100,00 | ||||
| 2025-07-29 | NP | FEOE - First Eagle Overseas Equity ETF | 792 299 | 449,66 | 1 933 | 548,66 | ||||
| 2025-08-12 | 13F | Barings Llc | 621 824 | −23,47 | 1 499 | −20,87 | ||||
| 2025-06-30 | NP | VT - Vanguard Total World Stock Index Fund ETF Shares | 532 359 | 0,00 | 1 347 | 36,79 | ||||
| 2025-07-25 | 13F | Welch Group, LLC | 44 319 | 0,29 | 107 | 6,00 | ||||
| 2025-08-13 | 13F | Blueshift Asset Management, LLC | 18 000 | −35,13 | 43 | −32,81 | ||||
| 2025-07-14 | 13F | S.A. Mason LLC | 500 | 0,00 | 1 | 0,00 | ||||
| 2025-08-13 | 13F | Quadrature Capital Ltd | 936 411 | 2 252 | ||||||
| 2025-07-16 | 13F | Signaturefd, Llc | 12 712 | 63,23 | 31 | 66,67 | ||||
| 2025-08-13 | 13F | Walleye Capital LLC | 0 | −100,00 | 0 | |||||
| 2025-08-15 | 13F | Kestra Advisory Services, LLC | 18 994 | 7,10 | 46 | 9,76 | ||||
| 2025-07-21 | 13F | Hilltop National Bank | 7 850 | 0,00 | 19 | 28,57 | ||||
| 2025-08-13 | 13F | Manning & Napier Advisors Llc | 1 280 792 | 3 087 | ||||||
| 2025-05-14 | 13F | Rockefeller Capital Management L.P. | 0 | −100,00 | 0 | −100,00 | ||||
| 2025-08-07 | NP | OTGAX - OTG Latin America Fund Class A Shares | 252 000 | 0,00 | 607 | 3,41 | ||||
| 2025-06-26 | NP | DFA INVESTMENT DIMENSIONS GROUP INC - Emerging Markets Sustainability Core 1 Portfolio Institutional Class This fund is a listed as child fund of Dimensional Fund Advisors Lp and if that institution has disclosed ownership in this security, then these positions will not be double counted when calculating total shares and total value | 220 998 | 0,00 | 559 | 37,01 | ||||
| 2025-08-14 | 13F | Citadel Advisors Llc | Call | 180 300 | 12,48 | 435 | 16,35 | |||
| 2025-08-04 | 13F | Virtus Family Office LLC | 576 011 | 20,61 | 1 398 | 24,49 | ||||
| 2025-08-05 | 13F | Freestone Capital Holdings, LLC | 47 092 | −11,42 | 113 | −8,13 | ||||
| 2025-05-14 | 13F | Aspen Grove Capital, LLC | 0 | −100,00 | 0 | |||||
| 2025-06-26 | NP | HLXCX - Emerging Markets ex China Portfolio Institutional Class | 0 | −100,00 | 0 | −100,00 | ||||
| 2025-07-22 | 13F | Wynn Capital, LLC | 119 900 | 5,16 | 289 | 8,68 | ||||
| 2025-07-29 | 13F | FLC Capital Advisors | 60 465 | 146 | ||||||
| 2025-08-06 | 13F | Moors & Cabot, Inc. | 106 900 | −2,73 | 258 | 0,39 | ||||
| 2025-08-08 | 13F | Wealth Alliance | 27 138 | −2,28 | 65 | 1,56 | ||||
| 2025-08-12 | 13F | BlackRock, Inc. | 22 778 969 | 9,43 | 54 897 | 13,19 | ||||
| 2025-08-15 | 13F | Captrust Financial Advisors | 591 413 | 4,58 | 1 425 | 8,20 | ||||
| 2025-08-13 | 13F | Hsbc Holdings Plc | 2 116 346 | 10,88 | 5 103 | 14,57 | ||||
| 2025-08-13 | 13F | Mackenzie Financial Corp | 156 530 | −63,87 | 377 | −62,64 | ||||
| 2025-07-09 | 13F | Riversedge Advisors, Llc | 20 950 | 8,02 | 50 | 11,11 | ||||
| 2025-07-31 | 13F | Ssa Swiss Advisors Ag | 0 | −100,00 | 0 | |||||
| 2025-08-14 | 13F | Two Sigma Advisers, Lp | 20 941 300 | −30,99 | 50 469 | −28,62 | ||||
| 2025-08-13 | 13F | Northwestern Mutual Wealth Management Co | 88 758 | 0,90 | 214 | 4,41 | ||||
| 2025-05-14 | 13F | Credit Agricole S A | 47 555 | −65,64 | 111 | −57,03 | ||||
| 2025-06-26 | NP | DFCEX - Emerging Markets Core Equity Portfolio - Institutional Class This fund is a listed as child fund of Dimensional Fund Advisors Lp and if that institution has disclosed ownership in this security, then these positions will not be double counted when calculating total shares and total value | 3 022 063 | 0,00 | 7 646 | 36,76 | ||||
| 2025-08-08 | 13F | Ranmore Fund Management Ltd | 0 | −100,00 | 0 | |||||
| 2025-08-14 | 13F | Bank Of America Corp /de/ | 27 505 192 | 9,91 | 66 288 | 13,68 | ||||
| 2025-08-11 | 13F | Frank, Rimerman Advisors LLC | 66 140 | 159 | ||||||
| 2025-08-25 | 13F/A | Neuberger Berman Group LLC | 228 227 | 891,30 | 550 | 937,74 | ||||
| 2025-08-11 | 13F | Empowered Funds, LLC | 159 542 | 148,79 | 384 | 157,72 | ||||
| 2025-06-18 | NP | REAYX - Equity Income Fund Class Y | 207 883 | −9,86 | 526 | 23,24 | ||||
| 2025-04-30 | 13F | CORDA Investment Management, LLC. | 0 | −100,00 | 0 | |||||
| 2025-07-24 | 13F | IFP Advisors, Inc | 118 102 | 7,54 | 285 | 11,37 | ||||
| 2025-07-28 | 13F | Fairman Group, LLC | 234 | 0,00 | 1 | |||||
| 2025-07-23 | 13F | Prime Capital Investment Advisors, LLC | 11 849 | −1,07 | 29 | 3,70 | ||||
| 2025-04-23 | 13F | Alpine Bank Wealth Management | 0 | −100,00 | 0 | |||||
| 2025-08-12 | 13F | Dimensional Fund Advisors Lp | 8 342 789 | 6,29 | 20 092 | 9,97 | ||||
| 2025-08-26 | NP | ILF - iShares Latin America 40 ETF | 15 483 289 | 9,47 | 37 315 | 13,23 | ||||
| 2025-08-12 | 13F | Tableaux Llc | 51 261 | 1 435 | ||||||
| 2025-08-14 | 13F | Wellington Management Group Llp | 859 469 | 205,72 | 2 071 | 216,18 | ||||
| 2025-08-12 | 13F | CenterBook Partners LP | 11 169 | 27 | ||||||
| 2025-08-08 | 13F | Pnc Financial Services Group, Inc. | 70 215 | 25,13 | 169 | 30,00 | ||||
| 2025-07-30 | 13F | Forum Financial Management, LP | 11 000 | 0,00 | 27 | 4,00 | ||||
| 2025-08-13 | 13F | New York State Common Retirement Fund | 1 112 200 | 2,46 | 3 | 0,00 | ||||
| 2025-07-21 | 13F | Kennebec Savings Bank | 0 | −100,00 | 0 | |||||
| 2025-08-12 | 13F | American Century Companies Inc | 3 013 784 | 22,75 | 7 263 | 26,98 | ||||
| 2025-08-04 | 13F | Spire Wealth Management | 41 971 | −8,06 | 101 | −4,72 | ||||
| 2025-08-08 | 13F | Quinn Opportunity Partners LLC | 80 000 | 0,00 | 193 | 3,23 | ||||
| 2025-08-11 | 13F | EntryPoint Capital, LLC | 0 | −100,00 | 0 | |||||
| 2025-07-23 | 13F | High Note Wealth, LLC | 66 | 0,00 | 0 | |||||
| 2025-07-14 | 13F | U.S. Capital Wealth Advisors, LLC | 10 556 | −13,33 | 25 | −10,71 | ||||
| 2025-08-01 | 13F | Transcend Wealth Collective, Llc | 34 598 | 245,32 | 83 | 260,87 | ||||
| 2025-08-13 | 13F | Centiva Capital, LP | 96 701 | −1,83 | 233 | 1,75 | ||||
| 2025-08-14 | 13F | Mml Investors Services, Llc | 212 479 | 15,15 | 1 | |||||
| 2025-07-23 | 13F/A | Euro Pacific Asset Management, LLC | 3 156 817 | −1,17 | 8 | 0,00 | ||||
| 2025-07-29 | 13F | Regions Financial Corp | 0 | −100,00 | 0 | |||||
| 2025-07-31 | 13F | R Squared Ltd | 0 | −100,00 | 0 | |||||
| 2025-06-26 | NP | DFAE - Dimensional Emerging Core Equity Market ETF | 1 201 667 | 3,62 | 3 040 | 41,72 | ||||
| 2025-08-01 | 13F | Brinker Capital Investments, LLC | 0 | −100,00 | 0 | −100,00 | ||||
| 2025-07-28 | NP | AVEM - Avantis Emerging Markets Equity ETF This fund is a listed as child fund of American Century Companies Inc and if that institution has disclosed ownership in this security, then these positions will not be double counted when calculating total shares and total value | 2 630 623 | 21,71 | 6 419 | 43,48 | ||||
| 2025-08-14 | 13F | State Street Corp | 11 724 631 | 2,85 | 28 502 | 6,31 | ||||
| 2025-07-11 | 13F/A | Umb Bank N A/mo | 4 997 | −22,30 | 12 | −14,29 | ||||
| 2025-08-14 | 13F | Stifel Financial Corp | 1 025 356 | 30,16 | 2 471 | 34,66 | ||||
| 2025-08-14 | 13F | Synovus Financial Corp | 0 | −100,00 | 0 | |||||
| 2025-07-31 | 13F | Caitong International Asset Management Co., Ltd | 69 413 | 149,44 | 167 | 160,94 | ||||
| 2025-07-29 | NP | GMAQX - GMO Emerging Markets ex-China Fund Class VI | 137 500 | 266,67 | 336 | 260,22 | ||||
| 2025-08-04 | 13F | IFG Advisory, LLC | 26 075 | 0,00 | 63 | 3,33 | ||||
| 2025-07-25 | 13F | Pzena Investment Management Llc | 10 315 005 | −25,47 | 24 859 | −22,91 | ||||
| 2025-08-07 | 13F | Roberts Glore & Co Inc /il/ | 31 580 | −8,41 | 76 | −5,00 | ||||
| 2025-08-06 | 13F | Oldfield Partners LLP | 2 079 600 | −21,07 | 5 012 | −18,37 | ||||
| 2025-08-13 | 13F | Grantham, Mayo, Van Otterloo & Co. LLC | 2 385 900 | 12 937,70 | 5 750 | 13 590,48 | ||||
| 2025-08-12 | 13F | LPL Financial LLC | 1 013 248 | 15,86 | 2 442 | 19,83 | ||||
| 2025-06-30 | NP | VMNVX - Vanguard Global Minimum Volatility Fund Admiral Shares | 901 632 | −8,22 | 2 281 | 25,54 | ||||
| 2025-08-05 | 13F | Scarborough Advisors, LLC | 553 | 1 | ||||||
| 2025-05-13 | 13F | Daiwa Securities Group Inc. | 0 | −100,00 | 0 | |||||
| 2025-08-08 | 13F | Mitsubishi UFJ Trust & Banking Corp | 356 158 | 45,65 | 858 | 50,79 | ||||
| 2025-08-14 | 13F | Lazard Asset Management Llc | 80 209 | 0 | ||||||
| 2025-08-12 | 13F | Virtu Financial LLC | 697 548 | 2 | ||||||
| 2025-07-16 | 13F | Highline Wealth Partners Llc | 2 914 | 61,80 | 7 | 75,00 | ||||
| 2025-06-26 | NP | DAADX - Emerging Markets ex China Core Equity Portfolio Institutional Class | 112 647 | 0,00 | 285 | 36,54 | ||||
| 2025-07-11 | 13F | Farther Finance Advisors, LLC | 5 182 | −8,35 | 12 | −7,69 | ||||
| 2025-07-18 | 13F | Truist Financial Corp | 16 067 | −39,90 | 39 | −38,71 | ||||
| 2025-08-13 | 13F | Natixis Advisors, L.p. | 880 180 | −26,62 | 2 | 0,00 | ||||
| 2025-08-13 | 13F | Cresset Asset Management, LLC | 0 | −100,00 | 0 | |||||
| 2025-08-13 | 13F | First Trust Advisors Lp | 0 | −100,00 | 0 | |||||
| 2025-08-08 | 13F | Crossmark Global Holdings, Inc. | 114 768 | 0,00 | 277 | 3,37 | ||||
| 2025-06-27 | NP | FEBAX - First Eagle Global Income Builder Fund Class A | 9 345 635 | 0,00 | 23 644 | 36,76 | ||||
| 2025-08-14 | 13F | Warren Averett Asset Management, LLC | 339 276 | 1,42 | 818 | 4,88 | ||||
| 2025-08-04 | 13F | Strs Ohio | 3 061 300 | 0,00 | 7 378 | 3,44 | ||||
| 2025-05-07 | 13F | Angeles Wealth Management, Llc | 0 | −100,00 | 0 | −100,00 | ||||
| 2025-07-24 | 13F | PDS Planning, Inc | 16 259 | 4,75 | 39 | 8,33 | ||||
| 2025-08-12 | 13F | Jpmorgan Chase & Co | 416 388 | −38,12 | 1 003 | −35,99 | ||||
| 2025-08-13 | 13F | Guggenheim Capital Llc | 169 421 | −10,69 | 408 | −7,48 | ||||
| 2025-07-10 | 13F | Moody National Bank Trust Division | 30 150 | 0,00 | 73 | 2,86 | ||||
| 2025-08-01 | 13F | Ashton Thomas Private Wealth, LLC | 1 216 115 | 720,63 | 2 935 | 743,10 | ||||
| 2025-07-25 | NP | MEMAX - MFS Emerging Markets Equity Fund A | 25 319 971 | −39,92 | 61 781 | −29,19 | ||||
| 2025-06-26 | NP | DFSE - Dimensional Emerging Markets Sustainability Core 1 ETF | 69 073 | 3,76 | 175 | 41,46 | ||||
| 2025-05-15 | 13F | Glenmede Trust Co Na | 0 | −100,00 | 0 | |||||
| 2025-08-14 | 13F | Citadel Advisors Llc | Put | 0 | −100,00 | 0 | ||||
| 2025-08-26 | NP | BINV - Brandes International ETF | 1 918 482 | 18,72 | 4 624 | 22,79 | ||||
| 2025-06-26 | NP | DEXC - Dimensional Emerging Markets ex China Core Equity ETF | 24 000 | 17,65 | 61 | 62,16 | ||||
| 2025-04-29 | 13F | Pensionmark Financial Group, Llc | 0 | −100,00 | 0 | |||||
| 2025-08-13 | 13F | EverSource Wealth Advisors, LLC | 12 248 | 2 224,10 | 30 | 2 800,00 | ||||
| 2025-08-28 | NP | CWI - SPDR(R) MSCI ACWI EX-US ETF | 427 751 | 0,35 | 1 031 | 3,73 | ||||
| 2025-08-12 | 13F | SRS Capital Advisors, Inc. | 12 085 | 29 | ||||||
| 2025-08-08 | 13F | Itau Unibanco Holding S.A. | 9 844 | 0,00 | 24 | |||||
| 2025-08-14 | 13F | Cook & Bynum Capital Management, LLC | 1 078 495 | 0,00 | 2 600 | 3,46 | ||||
| 2025-05-02 | 13F | Capital A Wealth Management, LLC | 1 378 | 0,00 | 3 | 50,00 | ||||
| 2025-07-15 | 13F | Alhambra Investment Partners LLC | 45 829 | 110 | ||||||
| 2025-07-17 | 13F | Wagner Wealth Management, Llc | 10 525 | 0,00 | 25 | 4,17 | ||||
| 2025-07-17 | 13F | Genesis Private Wealth, Llc | 10 050 | 0,00 | 24 | 4,35 | ||||
| 2025-08-13 | 13F/A | StoneX Group Inc. | 20 221 | 50 | ||||||
| 2025-07-25 | 13F | JustInvest LLC | 113 292 | 23,82 | 273 | 28,17 | ||||
| 2025-08-08 | 13F | SG Americas Securities, LLC | 36 203 | −76,52 | 0 | |||||
| 2025-08-25 | NP | MFS VARIABLE INSURANCE TRUST II - MFS Emerging Markets Equity Portfolio Initial Class | 104 847 | −22,20 | 253 | −19,49 | ||||
| 2025-08-14 | 13F | Royal Bank Of Canada | 2 464 513 | 5,30 | 5 940 | 8,91 | ||||
| 2025-08-14 | 13F | Susquehanna International Group, Llp | 2 144 681 | 275,17 | 5 169 | 288,28 | ||||
| 2025-08-14 | 13F | Susquehanna International Group, Llp | Put | 2 195 500 | 180,86 | 5 291 | 190,55 | |||
| 2025-06-27 | NP | SGOVX - First Eagle Overseas Fund Class A | 75 441 038 | 0,00 | 190 866 | 36,76 | ||||
| 2025-08-14 | 13F | Fmr Llc | 539 512 | −3,78 | 1 300 | −0,46 | ||||
| 2025-08-14 | 13F | Susquehanna International Group, Llp | Call | 436 200 | 233,74 | 1 051 | 245,72 | |||
| 2025-08-14 | 13F | Fortress Private Ledger, Llc | 91 929 | 50,31 | 222 | 55,63 | ||||
| 2025-08-05 | 13F | Huntington National Bank | 1 | 0,00 | 0 | |||||
| 2025-07-24 | 13F | Jfs Wealth Advisors, Llc | 170 | 286,36 | 0 | |||||
| 2025-07-29 | NP | RBB FUND, INC. - Aquarius International Fund | 19 058 | 47 | ||||||
| 2025-08-14 | 13F | Millennium Management Llc | 2 960 164 | 23,37 | 7 134 | 27,60 | ||||
| 2025-08-14 | 13F | Horizon Investments, LLC | 244 | 1 | ||||||
| 2025-08-26 | NP | NMMEX - Active M Emerging Markets Equity Fund | 684 368 | −0,14 | 1 649 | 3,32 | ||||
| 2025-07-18 | 13F | BSW Wealth Partners | 14 598 | 35 | ||||||
| 2025-08-14 | 13F | Harding Loevner Lp | 0 | −100,00 | 0 | |||||
| 2025-08-14 | 13F/A | Skopos Labs, Inc. | 28 106 | 336,63 | 68 | 378,57 | ||||
| 2025-08-14 | 13F | LaSalle St. Investment Advisors, LLC | 0 | −100,00 | 0 | |||||
| 2025-08-14 | 13F | Wetherby Asset Management Inc | 57 811 | −21,15 | 139 | 2,96 | ||||
| 2025-05-06 | 13F | Zevin Asset Management Llc | 0 | −100,00 | 0 | |||||
| 2025-07-23 | 13F | Mraz, Amerine & Associates, Inc. | 724 436 | 5,35 | 1 746 | 11,36 | ||||
| 2025-08-27 | NP | JNL SERIES TRUST - JNL/Loomis Sayles Global Growth Fund (I) | 5 256 435 | −2,52 | 12 668 | 0,83 | ||||
| 2025-08-13 | 13F | Russell Investments Group, Ltd. | 14 580 521 | −9,83 | 35 139 | −6,74 | ||||
| 2025-08-14 | 13F | Mariner, LLC | 121 913 | 106,89 | 294 | 113,87 | ||||
| 2025-08-14 | 13F | Banco BTG Pactual S.A. | 112 100 | −8,04 | 270 | −4,93 | ||||
| 2025-08-12 | 13F | Pathstone Holdings, LLC | 23 567 | 3,42 | 57 | 5,66 | ||||
| 2025-08-12 | 13F | Legal & General Group Plc | 3 344 122 | 0,00 | 8 043 | 3,43 | ||||
| 2025-08-12 | 13F | Jefferies Financial Group Inc. | 14 653 | −66,84 | 35 | −65,69 | ||||
| 2025-06-30 | 13F/A | Deutsche Bank Ag\ | 0 | −100,00 | 0 | |||||
| 2025-08-19 | 13F | Cape Investment Advisory, Inc. | 4 238 | 37,33 | 10 | 42,86 | ||||
| 2025-07-29 | NP | GBFFX - GMO Benchmark-Free Fund Class III | 271 100 | 589,82 | 661 | 474,78 | ||||
| 2025-08-14 | 13F | Two Sigma Investments, Lp | 9 615 096 | −42,44 | 23 172 | −40,46 | ||||
| 2025-07-22 | 13F | Sava Infond d.o.o. | 290 000 | 0,00 | 699 | 3,41 | ||||
| 2025-08-06 | NP | LINCOLN VARIABLE INSURANCE PRODUCTS TRUST - LVIP Loomis Sayles Global Growth Fund Standard Class | 1 488 776 | −5,26 | 3 588 | −2,02 | ||||
| 2025-07-08 | 13F | Chemistry Wealth Management LLC | 36 618 | 0,00 | 88 | 3,53 | ||||
| 2025-05-05 | 13F | Lindbrook Capital, Llc | 7 907 | −67,86 | 18 | −60,00 | ||||
| 2025-08-13 | 13F | Generation Capital Management LLC | 15 000 | 0,00 | 36 | 5,88 | ||||
| 2025-06-18 | NP | RETSX - Tax-Managed U.S. Large Cap Fund Class S | 7 529 693 | 110,73 | 19 050 | 188,20 | ||||
| 2025-07-23 | 13F | Winthrop Advisory Group LLC | 24 634 | 0,00 | 60 | 3,51 | ||||
| 2025-05-14 | 13F | Dorsey & Whitney Trust CO LLC | 0 | −100,00 | 0 | −100,00 | ||||
| 2025-07-31 | 13F | Whipplewood Advisors, LLC | 662 | 39,37 | 2 | 0,00 | ||||
| 2025-06-18 | NP | RSEAX - U.S. Strategic Equity Fund Class A | 1 571 671 | 0,00 | 3 976 | 36,77 | ||||
| 2025-07-24 | 13F | Us Bancorp \de\ | 129 562 | −21,44 | 312 | −18,75 | ||||
| 2025-08-14 | 13F | Goldman Sachs Group Inc | 4 083 797 | −18,33 | 9 842 | −15,53 | ||||
| 2025-08-28 | NP | SIEMX - SIT EMERGING MARKETS EQUITY FUND - CLASS F, effective 1-31-2017 (formerly Class A) | 413 410 | −62,13 | 996 | −60,83 | ||||
| 2025-07-15 | 13F | Jarislowsky, Fraser Ltd | 71 201 | 49,75 | 172 | 55,45 | ||||
| 2025-07-25 | 13F | Envestnet Portfolio Solutions, Inc. | 34 905 | 54,19 | 84 | 61,54 | ||||
| 2025-08-14 | 13F | Ubs Asset Management Americas Inc | 376 100 | 50,44 | 906 | 55,67 | ||||
| 2025-04-23 | 13F | International Assets Investment Management, Llc | 0 | −100,00 | 0 | |||||
| 2025-07-30 | 13F | Whittier Trust Co Of Nevada Inc | 772 | 0,00 | 2 | 0,00 | ||||
| 2025-08-13 | 13F | Legacy Capital Wealth Partners, LLC | 0 | −100,00 | 0 | |||||
| 2025-08-14 | 13F | Schonfeld Strategic Advisors LLC | 416 181 | 1 003 | ||||||
| 2025-08-07 | 13F | Parkside Financial Bank & Trust | 1 638 | 224,36 | 4 | 200,00 | ||||
| 2025-07-09 | 13F | Eldred Rock Partners, LLC | 3 549 857 | 0,06 | 8 555 | 4,08 | ||||
| 2025-08-07 | 13F | HighPoint Advisor Group LLC | 0 | −100,00 | 0 | |||||
| 2025-08-12 | 13F | MAI Capital Management | 816 | −92,08 | 2 | −95,83 | ||||
| 2025-08-11 | 13F | Bulltick Wealth Management, LLC | 38 511 | 93 | ||||||
| 2025-07-25 | 13F | Sequoia Financial Advisors, LLC | 184 384 | 85,18 | 444 | 91,38 | ||||
| 2025-08-14 | 13F | D. E. Shaw & Co., Inc. | 9 525 015 | 195,46 | 22 955 | 205,62 | ||||
| 2025-08-14 | 13F | Wiley Bros.-aintree Capital, Llc | 20 163 | 55,78 | 49 | 65,52 | ||||
| 2025-09-04 | 13F/A | Advisor Group Holdings, Inc. | 50 931 | −10,74 | 123 | −7,58 | ||||
| 2025-05-15 | 13F | Hrt Financial Lp | 0 | −100,00 | 0 | |||||
| 2025-07-10 | 13F | Western Pacific Wealth Management, LP | 1 000 | 0,00 | 2 | 0,00 | ||||
| 2025-07-28 | 13F | Allianz Asset Management GmbH | 150 000 | 362 | ||||||
| 2025-07-14 | 13F | Bank & Trust Co | 1 560 | 0,00 | 4 | 0,00 | ||||
| 2025-08-12 | 13F | XTX Topco Ltd | 0 | −100,00 | 0 | |||||
| 2025-08-14 | 13F | Headlands Technologies LLC | 38 132 | 92 | ||||||
| 2025-07-29 | 13F | Mountain Capital Investment Advisors, Inc | 11 087 | 0,00 | 27 | −3,70 | ||||
| 2025-08-27 | NP | Brighthouse Funds Trust I - SSGA Emerging Markets Enhanced Index Portfolio Class B | 1 027 300 | 171,70 | 2 476 | 181,25 | ||||
| 2025-08-11 | 13F | Bell Investment Advisors, Inc | 513 | 0,00 | 1 | 0,00 | ||||
| 2025-08-14 | 13F | Erste Asset Management GmbH | 250 000 | 0,00 | 590 | 3,51 | ||||
| 2025-05-15 | 13F | Scientech Research LLC | 0 | −100,00 | 0 | |||||
| 2025-08-12 | 13F | Contrarius Group Holdings Ltd | 0 | −100,00 | 0 | |||||
| 2025-06-26 | NP | DFEM - Dimensional Emerging Markets Core Equity 2 ETF | 554 944 | 6,76 | 1 404 | 46,10 | ||||
| 2025-07-10 | 13F | Wealth Enhancement Advisory Services, Llc | 119 963 | −64,62 | 296 | −62,53 | ||||
| 2025-06-26 | NP | Dfa Investment Trust Co - The Emerging Markets Series This fund is a listed as child fund of Dimensional Fund Advisors Lp and if that institution has disclosed ownership in this security, then these positions will not be double counted when calculating total shares and total value | 1 643 290 | 0,00 | 4 158 | 36,74 | ||||
| 2025-08-07 | NP | COBYX - The Cook & Bynum Fund | 483 092 | 0,00 | 1 164 | 3,47 | ||||
| 2025-08-14 | 13F | Ameriprise Financial Inc | 12 766 | 17,60 | 31 | 20,00 | ||||
| 2025-07-31 | 13F/A | Sendero Wealth Management, LLC | 21 540 | 0,00 | 52 | 2,00 | ||||
| 2025-07-29 | NP | SCPAX - Siit Large Cap Disciplined Equity Fund - Class A | 840 730 | 4,79 | 2 051 | 23,55 | ||||
| 2025-08-11 | 13F | Banque Cantonale Vaudoise | 693 600 | 0,00 | 2 | 0,00 | ||||
| 2025-08-14 | 13F | Colony Group, LLC | 19 224 | 35,27 | 46 | 39,39 | ||||
| 2025-08-28 | NP | QEMM - SPDR MSCI Emerging Markets StrategicFactors ETF | 3 414 | −3,97 | 8 | 0,00 | ||||
| 2025-08-14 | 13F | Federation des caisses Desjardins du Quebec | 96 214 | −2,06 | 232 | 1,32 | ||||
| 2025-08-19 | 13F | National Asset Management, Inc. | 57 953 | 12,99 | 140 | 39,00 | ||||
| 2025-08-13 | 13F | Provida Pension Fund Administrator | 0 | −100,00 | 0 | −100,00 | ||||
| 2025-08-25 | NP | EMEQ - Macquarie Focused Emerging Markets Equity ETF | 80 734 | 0,00 | 195 | 3,19 | ||||
| 2025-05-14 | 13F | Price T Rowe Associates Inc /md/ | 0 | −100,00 | 0 | |||||
| 2025-08-14 | 13F/A | Barclays Plc | 122 860 | 189,37 | 0 | |||||
| 2025-07-24 | 13F | Ronald Blue Trust, Inc. | 171 624 | 18,50 | 414 | 22,55 | ||||
| 2025-08-14 | 13F | Xponance, Inc. | 16 298 | 1,22 | 39 | 5,41 | ||||
| 2025-08-14 | 13F | Raymond James Financial Inc | 1 607 651 | −22,74 | 3 874 | −20,09 | ||||
| 2025-08-12 | 13F | Insigneo Advisory Services, Llc | 48 421 | 25,91 | 117 | 30,34 | ||||
| 2025-08-06 | 13F | Simmons Bank | 17 923 | 43 | ||||||
| 2025-04-21 | 13F | Nelson, Van Denburg & Campbell Wealth Management Group, LLC | 0 | −100,00 | 0 | |||||
| 2025-08-14 | 13F | Bnp Paribas Arbitrage, Sa | 283 529 | 5,77 | 683 | 9,46 | ||||
| 2025-07-29 | NP | FEGE - First Eagle Global Equity ETF | 979 225 | 175,21 | 2 389 | 224,59 | ||||
| 2025-08-28 | NP | SPGM - SPDR(R) Portfolio MSCI Global Stock Market ETF | 85 485 | 2,96 | 206 | 6,74 | ||||
| 2025-07-23 | 13F | Armstrong, Fleming & Moore, Inc | 0 | −100,00 | 0 | |||||
| 2025-04-28 | 13F | DAVENPORT & Co LLC | 0 | −100,00 | 0 | |||||
| 2025-08-13 | 13F | Scotia Capital Inc. | 263 290 | 0,63 | 635 | 4,11 | ||||
| 2025-08-14 | 13F | Stansberry Asset Management, Llc | 2 617 541 | 304,19 | 6 308 | 318,30 | ||||
| 2025-07-31 | 13F | Cambridge Investment Research Advisors, Inc. | 902 704 | −5,60 | 2 | 0,00 | ||||
| 2025-08-12 | 13F | Cornerstone Wealth Management, LLC | 12 900 | 31 | ||||||
| 2025-08-14 | 13F | Jane Street Group, Llc | 1 098 536 | 272,14 | 2 647 | 285,30 | ||||
| 2025-07-22 | 13F | Sage Investment Counsel LLC | 165 500 | 0,00 | 399 | 3,38 | ||||
| 2025-08-14 | 13F | Boston Private Wealth Llc | 0 | −100,00 | 0 | |||||
| 2025-04-21 | 13F | Essex Savings Bank | 0 | −100,00 | 0 | −100,00 | ||||
| 2025-08-04 | 13F | Atria Investments Llc | 103 393 | 48,98 | 249 | 54,66 | ||||
| 2025-07-15 | 13F | Fifth Third Bancorp | 246 | −85,66 | 1 | −100,00 | ||||
| 2025-07-22 | 13F | Old National Bancorp /in/ | 22 819 | 55 | ||||||
| 2025-05-14 | 13F | Orion Portfolio Solutions, LLC | 85 740 | 0,00 | 159 | 0,00 | ||||
| 2025-08-14 | 13F | TCG Advisory Services, LLC | 46 303 | −13,51 | 112 | −10,48 | ||||
| 2025-08-27 | NP | JNL SERIES TRUST - JNL/GQG Emerging Markets Equity Fund (A) | 3 008 691 | −23,81 | 7 251 | −0,75 | ||||
| 2025-04-14 | 13F | First Citizens Bank & Trust Co | 0 | −100,00 | 0 | |||||
| 2025-05-09 | 13F | Ruffer LLP | 0 | −100,00 | 0 | |||||
| 2025-05-01 | 13F | Schechter Investment Advisors, LLC | 434 671 | −7,77 | 1 013 | 16,19 | ||||
| 2025-08-08 | 13F | Capstone Financial Advisors, Inc. | 50 000 | 0,00 | 120 | 3,45 | ||||
| 2025-05-05 | 13F | Eagle Bay Advisors LLC | 0 | −100,00 | 0 | −100,00 | ||||
| 2025-07-15 | 13F | Bfsg, Llc | 115 130 | 0,00 | 277 | 3,36 | ||||
| 2025-08-14 | 13F | Mpwm Advisory Solutions, Llc | 0 | −100,00 | 0 | |||||
| 2025-07-14 | 13F | Foundation Resource Management Inc | 6 826 347 | 0,17 | 16 451 | 3,61 | ||||
| 2025-08-08 | 13F | Creative Planning | 125 401 | 19,28 | 302 | 23,77 | ||||
| 2025-07-11 | 13F | Assenagon Asset Management S.A. | 0 | −100,00 | 0 | |||||
| 2025-08-28 | NP | SPEM - SPDR(R) Portfolio Emerging Markets ETF | 6 405 285 | 8,75 | 15 437 | 12,49 | ||||
| 2025-07-14 | 13F | CHICAGO TRUST Co NA | 131 282 | 19,35 | 316 | 23,44 | ||||
| 2025-08-13 | 13F | Invesco Ltd. | 3 978 085 | 4,59 | 9 587 | 8,18 | ||||
| 2025-07-21 | 13F | Mirae Asset Global Investments Co., Ltd. | 242 669 | −73,42 | 585 | −76,80 | ||||
| 2025-08-07 | 13F | Montag A & Associates Inc | 4 808 | −7,75 | 12 | −8,33 | ||||
| 2025-08-04 | 13F | Mesirow Financial Investment Management, Inc. | 40 270 | 23,96 | 97 | 29,33 | ||||
| 2025-08-14 | 13F | Toroso Investments, LLC | 0 | −100,00 | 0 | |||||
| 2025-08-11 | 13F | Anderson Financial Strategies, LLC | 0 | −100,00 | 0 | |||||
| 2025-08-12 | 13F | Private Management Group Inc | 15 377 504 | −0,40 | 37 060 | 3,02 | ||||
| 2025-08-04 | 13F | Savvy Advisors, Inc. | 0 | −100,00 | 0 | |||||
| 2025-08-12 | 13F | Heron Bay Capital Management | 0 | −100,00 | 0 | |||||
| 2025-08-13 | 13F | Brandes Investment Partners, Lp | 20 606 928 | −1,56 | 49 663 | 1,82 | ||||
| 2025-08-28 | NP | SEUIX - Simt Large Cap Value Fund Class I | 1 387 221 | −13,03 | 3 343 | −10,04 | ||||
| 2025-08-04 | 13F | Balentine LLC | 11 548 | 0,00 | 28 | 3,85 | ||||
| 2025-07-29 | NP | LSAGX - Loomis Sayles Global Growth Fund Class A | 835 741 | 16,37 | 2 039 | 37,21 | ||||
| 2025-08-14 | 13F | Group One Trading, L.p. | Put | 821 000 | 384,94 | 1 979 | 402,03 | |||
| 2025-08-27 | NP | RYWTX - Emerging Markets 2x Strategy Fund Class A | 23 469 | 157,05 | 57 | 166,67 | ||||
| 2025-08-27 | NP | BBTIX - Bridge Builder Tax Managed International Equity Fund | 1 197 881 | 0,00 | 2 887 | 3,40 | ||||
| 2025-08-06 | 13F | Commonwealth Equity Services, Llc | 119 395 | 6,36 | 0 | |||||
| 2025-08-14 | 13F | Vident Advisory, LLC | 43 441 | −78,63 | 105 | −78,01 | ||||
| 2025-08-14 | 13F | Group One Trading, L.p. | Call | 37 100 | 148,99 | 89 | 161,76 | |||
| 2025-08-21 | NP | MNCSX - Mercer Non-US Core Equity Fund Class I | 0 | −100,00 | 0 | −100,00 | ||||
| 2025-08-14 | 13F | Group One Trading, L.p. | 403 820 | 190,72 | 973 | 201,24 | ||||
| 2025-07-30 | NP | APIE - ActivePassive International Equity ETF | 364 253 | −11,71 | 889 | 1,60 | ||||
| 2025-07-31 | 13F | 180 Wealth Advisors, Llc | 37 591 | 4,06 | 91 | 7,14 | ||||
| 2025-08-13 | 13F | Amundi | 122 148 | −46,78 | 304 | −45,23 | ||||
| 2025-08-14 | 13F | BTG Pactual Asset Management US LLC | 97 668 | 235 | ||||||
| 2025-08-06 | 13F | Altrius Capital Management Inc | 3 973 716 | −2,09 | 9 577 | 1,27 | ||||
| 2025-08-13 | 13F | Ted Buchan & Co | 0 | −100,00 | 0 |