Grundläggande statistik
| Chef | Richard Pzena |
| Insiderprofil | PZENA INVESTMENT MANAGEMENT LLC |
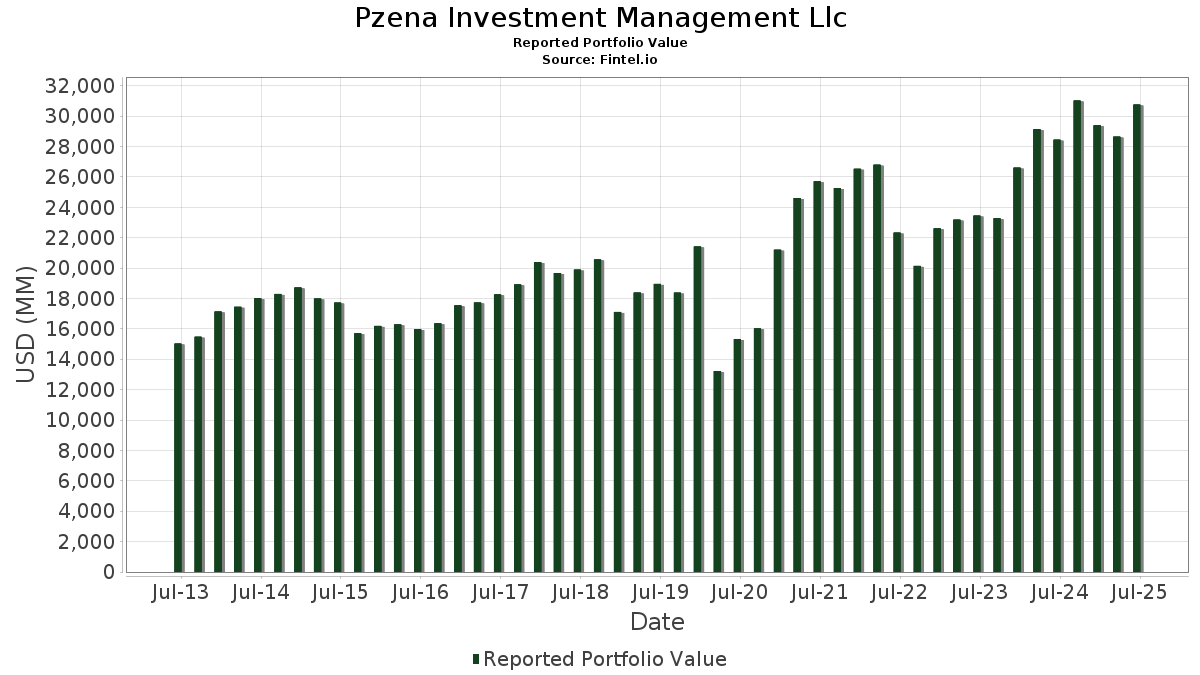
| Portföljvärde | $ 30 752 340 879 |
| Aktuella positioner | 152 |
Senaste innehav, resultat, förvaltat kapital (från 13F, 13D)
Pzena Investment Management Llc har redovisat 152 totala innehav i sina senaste SEC-arkiveringar. Portföljförvaltare anges som Richard Pzena. Det senaste portföljvärdet beräknas vara $ 30 752 340 879 USD. Faktiskt förvaltade tillgångar (AUM) är detta värde plus likvida medel (som inte redovisas). Pzena Investment Management Llcs största innehav är Magna International Inc. (US:MGA) , Cognizant Technology Solutions Corporation (US:CTSH) , Dollar General Corporation (US:DG) , Baxter International Inc. (US:BAX) , and Citigroup Inc. (US:C) . Pzena Investment Management Llcs nya positioner inkluderar WNS (Holdings) Limited (US:WNS) , Oshkosh Corporation (US:OSK) , Arcos Dorados Holdings Inc. (US:ARCO) , Teleflex Incorporated (US:TFX) , and GSK plc - Depositary Receipt (Common Stock) (US:GSK) . Pzena Investment Management Llcs främsta industrier är "Health Services" (sic 80) , "Stone, Clay, Glass, And Concrete Products" (sic 32) , and "Communications" (sic 48) .
Största ökningarna detta kvartal
Vi använder förändringen i portföljallokeringen eftersom det är det mest meningsfulla måttet. Förändringar kan bero på transaktioner eller förändringar i aktiekurser.
| Värdepapper | Aktier (MM) |
Värde (MM$) |
Portfölj % av | ΔPortfölj % av |
|---|---|---|---|---|
| 18,72 | 664,69 | 2,1326 | 1,2453 | |
| 12,21 | 909,71 | 2,9188 | 1,1671 | |
| 13,57 | 1 155,48 | 3,7574 | 0,4530 | |
| 11,85 | 1 355,28 | 4,3484 | 0,4279 | |
| 1,66 | 105,13 | 0,3419 | 0,3419 | |
| 10,37 | 830,99 | 2,7022 | 0,2385 | |
| 5,42 | 1 153,49 | 3,7009 | 0,2165 | |
| 0,53 | 59,71 | 0,1942 | 0,1942 | |
| 29,50 | 1 553,03 | 5,0501 | 0,1918 | |
| 2,79 | 103,08 | 0,3352 | 0,1858 |
Största minskningarna detta kvartal
Vi använder förändringen i portföljallokeringen eftersom det är det mest meningsfulla måttet. Förändringar kan bero på transaktioner eller förändringar i aktiepriser.
| Värdepapper | Aktier (MM) |
Värde (MM$) |
Portfölj % av | ΔPortfölj % av |
|---|---|---|---|---|
| 27,09 | 717,38 | 2,3328 | −0,7100 | |
| 14,84 | 687,10 | 2,2045 | −0,6614 | |
| 39,34 | 1 191,11 | 3,8732 | −0,5214 | |
| 13,71 | 766,86 | 2,4605 | −0,4946 | |
| 42,71 | 530,87 | 1,7263 | −0,4824 | |
| 16,75 | 1 155,20 | 3,7565 | −0,4261 | |
| 4,08 | 996,66 | 3,1978 | −0,3395 | |
| 68,66 | 355,67 | 1,1566 | −0,3239 | |
| 4,24 | 237,93 | 0,7634 | −0,3100 | |
| 10,46 | 866,14 | 2,7790 | −0,2609 |
13D/G-arkiveringar
Detta är en lista över 13D- och 13G-arkiveringar som gjorts under det senaste året (om några). Klicka på länken för att se hela transaktionshistoriken. Gröna rader indikerar nya positioner. Röda rader indikerar stängda positioner.
| Fil Datum | Formulär | Värdepapper | Föregående aktier |
Aktuella aktier |
ΔAktier % | % Ägande |
% ΔÄgande | |
|---|---|---|---|---|---|---|---|---|
| 2025-09-02 | BAX / Baxter International Inc. | 39 708 226 | 55 458 217 | 39,66 | 10,80 | 40,26 | ||
| 2025-07-15 | ARCO / Arcos Dorados Holdings Inc. | 6 533 482 | 5,00 | |||||
| 2025-07-14 | AMWD / American Woodmark Corporation | 840 674 | 1 148 331 | 36,60 | 7,90 | 38,60 | ||
| 2025-07-14 | SWKS / Skyworks Solutions, Inc. | 7 851 443 | 12 321 597 | 56,93 | 8,20 | 60,78 | ||
| 2025-07-11 | PVH / PVH Corp. | 6 219 748 | 6 465 818 | 3,96 | 13,40 | 19,64 | ||
| 2025-07-11 | OEC / Orion S.A. | 3 647 985 | 4 577 197 | 25,47 | 8,10 | 28,57 | ||
| 2025-07-03 | VREX / Varex Imaging Corporation | 3 890 879 | 4 244 977 | 9,10 | 10,20 | 7,37 | ||
| 2025-07-03 | HVT / Haverty Furniture Companies, Inc. | 962 102 | 1 560 557 | 62,20 | 10,50 | 64,06 | ||
| 2025-07-03 | SHYF / The Shyft Group, Inc. | 3 099 622 | 3 579 364 | 15,48 | 10,20 | 13,33 | ||
| 2025-05-01 | JELD / JELD-WEN Holding, Inc. | 10 311 305 | 0 | −100,00 | 0,00 | −100,00 | ||
| 2025-05-01 | PLOW / Douglas Dynamics, Inc. | 2 273 003 | 2 325 476 | 2,31 | 10,10 | 3,06 | ||
| 2025-05-01 | GCO / Genesco Inc. | 1 047 673 | 1 399 224 | 33,56 | 12,70 | 36,56 | ||
| 2025-04-28 | KOP / Koppers Holdings Inc. | 1 221 328 | 6,10 | |||||
| 2025-04-28 | AAP / Advance Auto Parts, Inc. | 3 270 897 | 4 312 508 | 31,84 | 7,20 | 30,91 | ||
| 2025-04-28 | PAHC / Phibro Animal Health Corporation | 1 460 800 | 723 830 | −50,45 | 3,60 | −50,00 | ||
| 2025-04-28 | SPB / Spectrum Brands Holdings, Inc. | 1 334 033 | 5,10 | |||||
| 2025-02-04 | MGA / Magna International Inc. | 28 289 811 | 10,00 | |||||
| 2025-01-30 | DG / Dollar General Corporation | 11 861 633 | 5,40 | |||||
| 2025-01-30 | EQH / Equitable Holdings, Inc. | 8 234 705 | 2,60 | |||||
| 2025-01-30 | SSNC / SS&C Technologies Holdings, Inc. | 14 619 455 | 11 667 485 | −20,19 | 4,70 | −20,34 | ||
| 2025-01-23 | AVT / Avnet, Inc. | 8 751 446 | 7 364 024 | −15,85 | 8,50 | −12,37 | ||
| 2025-01-23 | NWL / Newell Brands Inc. | 54 518 863 | 49 432 520 | −9,33 | 11,90 | −9,85 | ||
| 2024-11-08 | TILE / Interface, Inc. | 3 490 324 | 317 299 | −90,91 | 0,50 | −91,67 | ||
| 2024-11-08 | SCSC / ScanSource, Inc. | 1 893 151 | 514 503 | −72,82 | 2,10 | −72,00 | ||
| 2024-10-22 | GIL / Gildan Activewear Inc. | 9 602 146 | 636 743 | −93,37 | 0,40 | −92,86 | ||
| 2024-10-22 | CNO / CNO Financial Group, Inc. | 6 982 684 | 4 577 890 | −34,44 | 4,30 | −30,65 | ||
| 2024-10-21 | MRC / MRC Global Inc. | 7 001 859 | 5 770 791 | −17,58 | 6,80 | −18,07 | ||
| 2024-10-21 | SCS / Steelcase Inc. | 7 843 245 | 5 239 449 | −33,20 | 5,60 | −33,33 | ||
| 2024-10-21 | USNA / USANA Health Sciences, Inc. | 1 049 610 | 5,50 | |||||
| 2024-10-21 | DOX / Amdocs Limited | 6 482 552 | 5,70 | |||||
| 2024-10-15 | MBUU / Malibu Boats, Inc. | 1 555 331 | 7,80 | |||||
| 2024-10-10 | HOFT / Hooker Furnishings Corporation | 1 426 039 | 1 286 381 | −9,79 | 12,00 | −10,45 | ||
| 2024-10-07 | LEA / Lear Corporation | 6 304 116 | 7 764 912 | 23,17 | 13,80 | 27,78 | ||
| 2024-10-04 | NOV / NOV Inc. | 31 371 893 | 43 348 680 | 38,18 | 11,00 | 37,50 |
13F- och fond arkiveringar
Denna blankett lämnades in den 2025-07-25 för rapporteringsperioden 2025-06-30. Klicka på länksymbolen för att se hela transaktionshistoriken.
Uppgradera för att låsa upp premiumdata och exportera till Excel![]() .
.
| Värdepapper | Typ | Genomsnittligt aktiepris | Aktier (MM) |
ΔAktier (%) |
ΔAktier (%) |
Värde ($MM) |
Portfölj (%) |
ΔPortfölj (%) |
|
|---|---|---|---|---|---|---|---|---|---|
| MGA / Magna International Inc. | 29,50 | 3,70 | 1 553,03 | 11,61 | 5,0501 | 0,1918 | |||
| CTSH / Cognizant Technology Solutions Corporation | 17,45 | 2,20 | 1 361,68 | 4,24 | 4,4279 | −0,1327 | |||
| DG / Dollar General Corporation | 11,85 | −7,22 | 1 355,28 | 20,69 | 4,3484 | 0,4279 | |||
| BAX / Baxter International Inc. | 39,34 | 6,97 | 1 191,11 | −5,37 | 3,8732 | −0,5214 | |||
| C / Citigroup Inc. | 13,57 | 1,82 | 1 155,48 | 22,09 | 3,7574 | 0,4530 | |||
| CVS / CVS Health Corporation | 16,75 | −5,29 | 1 155,20 | −3,57 | 3,7565 | −0,4261 | |||
| COF / Capital One Financial Corporation | 5,42 | −2,60 | 1 153,49 | 15,58 | 3,7009 | 0,2165 | |||
| CHTR / Charter Communications, Inc. | 2,65 | −4,79 | 1 083,36 | 5,61 | 3,5229 | −0,0586 | |||
| HUM / Humana Inc. | 4,08 | 6,47 | 996,66 | −1,63 | 3,1978 | −0,3395 | |||
| SWKS / Skyworks Solutions, Inc. | 12,21 | 57,26 | 909,71 | 81,32 | 2,9188 | 1,1671 | |||
| GPN / Global Payments Inc. | 11,05 | 32,59 | 884,46 | 8,38 | 2,8761 | 0,0269 | |||
| SSNC / SS&C Technologies Holdings, Inc. | 10,46 | 0,36 | 866,14 | −0,52 | 2,7790 | −0,2609 | |||
| WFC / Wells Fargo & Company | 10,37 | 5,52 | 830,99 | 17,76 | 2,7022 | 0,2385 | |||
| UBS / UBS Group AG | 30,90 | 5,29 | 829,73 | 5,21 | 2,6622 | −0,0913 | |||
| MDT / Medtronic plc | 8,86 | 5,59 | 771,92 | 2,43 | 2,4767 | −0,1544 | |||
| TSN / Tyson Foods, Inc. | 13,71 | 3,35 | 766,86 | −9,39 | 2,4605 | −0,4946 | |||
| MET / MetLife, Inc. | 9,14 | 6,84 | 735,41 | 7,02 | 2,3595 | −0,0397 | |||
| LEA / Lear Corporation | 7,60 | −0,81 | 722,13 | 6,79 | 2,3169 | −0,0439 | |||
| DOW / Dow Inc. | 27,09 | 8,55 | 717,38 | −17,68 | 2,3328 | −0,7100 | |||
| BMY / Bristol-Myers Squibb Company | 14,84 | 10,29 | 687,10 | −16,29 | 2,2045 | −0,6614 | |||
| CRBG / Corebridge Financial, Inc. | 18,72 | 132,58 | 664,69 | 161,53 | 2,1326 | 1,2453 | |||
| DOX / Amdocs Limited | 6,55 | 2,06 | 597,72 | 1,77 | 1,9178 | −0,1327 | |||
| NOV / NOV Inc. | 42,71 | 2,75 | 530,87 | −16,08 | 1,7263 | −0,4824 | |||
| PVH / PVH Corp. | 6,41 | 3,99 | 439,56 | 10,36 | 1,4294 | 0,0388 | |||
| FMS / Fresenius Medical Care AG - Depositary Receipt (Common Stock) | 14,66 | −4,64 | 418,92 | 9,41 | 1,3441 | 0,0073 | |||
| TEL / TE Connectivity plc | 2,42 | −2,03 | 407,94 | 16,93 | 1,3089 | 0,0909 | |||
| AVT / Avnet, Inc. | 7,34 | 2,93 | 389,68 | 13,61 | 1,2671 | 0,0696 | |||
| NOK / Nokia Oyj - Depositary Receipt (Common Stock) | 68,66 | −14,66 | 355,67 | −16,12 | 1,1566 | −0,3239 | |||
| BAC / Bank of America Corporation | 6,58 | 3,52 | 311,21 | 17,39 | 1,0120 | 0,0864 | |||
| NWL / Newell Brands Inc. | 48,37 | −0,75 | 261,22 | −13,55 | 0,8494 | −0,2056 | |||
| VOYA / Voya Financial, Inc. | 3,66 | 1,73 | 259,95 | 6,59 | 0,8340 | −0,0174 | |||
| SHEL / Shell plc - Depositary Receipt (Common Stock) | 3,67 | 2,03 | 258,06 | −1,97 | 0,8280 | −0,0911 | |||
| EQH / Equitable Holdings, Inc. | 4,24 | −28,14 | 237,93 | −22,61 | 0,7634 | −0,3100 | |||
| BAP / Credicorp Ltd. | 1,03 | −1,69 | 229,72 | 18,04 | 0,7370 | 0,0576 | |||
| DAL / Delta Air Lines, Inc. | 4,31 | 1,91 | 212,08 | 14,95 | 0,6897 | 0,0455 | |||
| AAP / Advance Auto Parts, Inc. | 4,39 | 1,91 | 204,32 | 20,83 | 0,6644 | 0,0740 | |||
| CI / The Cigna Group | 0,52 | 9,66 | 173,09 | 10,19 | 0,5554 | 0,0069 | |||
| PFE / Pfizer Inc. | 6,56 | −7,08 | 158,99 | −11,12 | 0,5170 | −0,1075 | |||
| KSPI / Joint Stock Company Kaspi.kz - Depositary Receipt (Common Stock) | 1,68 | 17,28 | 142,67 | 7,23 | 0,4578 | −0,0068 | |||
| ZTO / ZTO Express (Cayman) Inc. - Depositary Receipt (Common Stock) | 7,62 | −1,36 | 135,31 | −11,75 | 0,4341 | −0,1012 | |||
| MHK / Mohawk Industries, Inc. | 1,18 | 5,36 | 123,27 | −3,26 | 0,4008 | −0,0440 | |||
| CNXC / Concentrix Corporation | 2,28 | −0,44 | 120,34 | −5,42 | 0,3861 | −0,0581 | |||
| GL / Globe Life Inc. | 0,95 | 0,54 | 117,58 | −5,13 | 0,3772 | −0,0555 | |||
| PPG / PPG Industries, Inc. | 1,01 | 5,25 | 115,34 | 9,49 | 0,3701 | 0,0023 | |||
| MS / Morgan Stanley | 0,79 | 3,67 | 111,44 | 25,16 | 0,3576 | 0,0467 | |||
| CSCO / Cisco Systems, Inc. | 1,60 | −12,54 | 111,00 | −1,67 | 0,3610 | −0,0332 | |||
| WNS / WNS (Holdings) Limited | 1,66 | 105,13 | 0,3419 | 0,3419 | |||||
| LKQ / LKQ Corporation | 2,79 | 176,89 | 103,08 | 140,90 | 0,3352 | 0,1858 | |||
| JPM / JPMorgan Chase & Co. | 0,34 | 9,63 | 99,24 | 29,57 | 0,3227 | 0,0553 | |||
| CNO / CNO Financial Group, Inc. | 2,55 | −0,49 | 98,47 | −7,82 | 0,3159 | −0,0570 | |||
| RHI / Robert Half Inc. | 2,38 | 80,27 | 97,59 | 35,66 | 0,3131 | 0,0620 | |||
| GSCE / GS Connect S&P GSCI Enhanced Commodity Total Return ETN | 0,13 | −7,57 | 89,40 | 19,75 | 0,2868 | 0,0262 | |||
| WBS / Webster Financial Corporation | 1,61 | 1,49 | 88,06 | 7,49 | 0,2863 | 0,0003 | |||
| GD / General Dynamics Corporation | 0,29 | 4,67 | 85,03 | 12,00 | 0,2728 | 0,0077 | |||
| ELV / Elevance Health, Inc. | 0,22 | 8,11 | 84,51 | −3,33 | 0,2748 | −0,0304 | |||
| ADNT / Adient plc | 4,17 | 7,00 | 81,24 | 61,91 | 0,2606 | 0,0855 | |||
| SPB / Spectrum Brands Holdings, Inc. | 1,47 | 10,53 | 78,15 | −18,13 | 0,2507 | −0,0825 | |||
| OLN / Olin Corporation | 3,83 | 4,55 | 76,93 | −13,35 | 0,2468 | −0,0632 | |||
| HAL / Halliburton Company | 3,73 | 134,68 | 76,10 | 88,52 | 0,2442 | 0,1032 | |||
| WAB / Westinghouse Air Brake Technologies Corporation | 0,36 | 4,81 | 75,51 | 20,99 | 0,2455 | 0,0277 | |||
| GPC / Genuine Parts Company | 0,60 | 98,03 | 72,31 | 101,64 | 0,2320 | 0,1068 | |||
| MRC / MRC Global Inc. | 5,22 | −2,37 | 71,61 | 16,59 | 0,2298 | 0,0153 | |||
| UHS / Universal Health Services, Inc. | 0,39 | −0,02 | 70,96 | −3,62 | 0,2277 | −0,0294 | |||
| XOM / Exxon Mobil Corporation | 0,65 | 6,28 | 70,51 | −3,66 | 0,2262 | −0,0293 | |||
| DRH / DiamondRock Hospitality Company | 8,79 | 2,11 | 67,30 | 1,32 | 0,2159 | −0,0160 | |||
| PLOW / Douglas Dynamics, Inc. | 2,28 | 0,38 | 67,24 | 27,34 | 0,2157 | 0,0314 | |||
| HSIC / Henry Schein, Inc. | 0,92 | −4,71 | 67,22 | 1,63 | 0,2157 | −0,0152 | |||
| TRS / TriMas Corporation | 2,18 | 1,98 | 62,31 | 24,52 | 0,1999 | 0,0252 | |||
| AMWD / American Woodmark Corporation | 1,15 | 36,60 | 61,29 | 23,92 | 0,1966 | 0,0240 | |||
| SCS / Steelcase Inc. | 5,75 | 7,27 | 60,02 | 2,08 | 0,1926 | −0,0127 | |||
| KFY / Korn Ferry | 0,82 | 6,56 | 60,01 | 15,20 | 0,1951 | 0,0133 | |||
| OSK / Oshkosh Corporation | 0,53 | 59,71 | 0,1942 | 0,1942 | |||||
| REZI / Resideo Technologies, Inc. | 2,69 | 1,58 | 59,28 | 26,60 | 0,1902 | 0,0267 | |||
| ONB / Old National Bancorp | 2,70 | −6,24 | 57,53 | −5,58 | 0,1846 | −0,0281 | |||
| HUN / Huntsman Corporation | 5,31 | 9,30 | 55,34 | −27,87 | 0,1776 | −0,0903 | |||
| MBUU / Malibu Boats, Inc. | 1,67 | 8,87 | 52,37 | 11,21 | 0,1680 | 0,0036 | |||
| ARCO / Arcos Dorados Holdings Inc. | 6,53 | 51,55 | 0,1676 | 0,1676 | |||||
| NVST / Envista Holdings Corporation | 2,46 | 7,18 | 48,05 | 21,34 | 0,1542 | 0,0159 | |||
| OEC / Orion S.A. | 4,58 | 37,50 | 48,01 | 11,55 | 0,1541 | 0,0038 | |||
| SHG / Shinhan Financial Group Co., Ltd. - Depositary Receipt (Common Stock) | 1,03 | −4,73 | 46,43 | 34,17 | 0,1490 | 0,0281 | |||
| BFH / Bread Financial Holdings, Inc. | 0,80 | 9,88 | 45,70 | 25,33 | 0,1486 | 0,0213 | |||
| ABM / ABM Industries Incorporated | 0,96 | 13,48 | 45,51 | 13,12 | 0,1460 | 0,0056 | |||
| MBC / MasterBrand, Inc. | 4,15 | 45,30 | 45,41 | 21,60 | 0,1457 | 0,0153 | |||
| ASB / Associated Banc-Corp | 1,86 | 4,01 | 45,35 | 12,60 | 0,1455 | 0,0049 | |||
| SHYF / The Shyft Group, Inc. | 3,58 | 16,05 | 44,89 | 79,88 | 0,1440 | 0,0569 | |||
| HDB / HDFC Bank Limited - Depositary Receipt (Common Stock) | 0,58 | 13,76 | 44,74 | 31,28 | 0,1455 | 0,0265 | |||
| RF / Regions Financial Corporation | 1,90 | 0,00 | 44,67 | 8,24 | 0,1433 | −0,0008 | |||
| WSFS / WSFS Financial Corporation | 0,81 | 2,97 | 44,61 | 9,18 | 0,1431 | 0,0005 | |||
| WCC / WESCO International, Inc. | 0,23 | 0,00 | 42,38 | 19,25 | 0,1360 | 0,0119 | |||
| TFX / Teleflex Incorporated | 0,36 | 42,15 | 0,1371 | 0,1371 | |||||
| CBRE / CBRE Group, Inc. | 0,30 | −26,86 | 41,37 | −21,63 | 0,1327 | −0,0516 | |||
| SCSC / ScanSource, Inc. | 0,98 | 3,56 | 40,79 | 27,31 | 0,1326 | 0,0208 | |||
| KOP / Koppers Holdings Inc. | 1,25 | 2,19 | 40,12 | 17,33 | 0,1287 | 0,0093 | |||
| MSM / MSC Industrial Direct Co., Inc. | 0,46 | 0,00 | 39,27 | 9,46 | 0,1260 | 0,0007 | |||
| FITB / Fifth Third Bancorp | 0,95 | 0,06 | 39,13 | 4,99 | 0,1256 | −0,0046 | |||
| LDOS / Leidos Holdings, Inc. | 0,24 | 5,44 | 38,54 | 23,27 | 0,1237 | 0,0145 | |||
| HCA / HCA Healthcare, Inc. | 0,10 | −12,41 | 38,30 | −2,89 | 0,1229 | −0,0148 | |||
| JNJ / Johnson & Johnson | 0,25 | 4,46 | 37,62 | −3,78 | 0,1207 | −0,0158 | |||
| VREX / Varex Imaging Corporation | 4,24 | 11,64 | 36,80 | −16,56 | 0,1181 | −0,0359 | |||
| AIG / American International Group, Inc. | 0,43 | −12,03 | 36,75 | −13,40 | 0,1179 | −0,0302 | |||
| USNA / USANA Health Sciences, Inc. | 1,20 | 9,41 | 36,58 | 23,85 | 0,1174 | 0,0142 | |||
| TGT / Target Corporation | 0,37 | 6,28 | 36,19 | 0,47 | 0,1161 | −0,0096 | |||
| COLB / Columbia Banking System, Inc. | 1,54 | 8,57 | 36,04 | 1,78 | 0,1156 | −0,0080 | |||
| HR / Healthcare Realty Trust Incorporated | 2,23 | 0,00 | 35,30 | −6,15 | 0,1133 | −0,0181 | |||
| SNV / Synovus Financial Corp. | 0,68 | 1,72 | 35,21 | 12,63 | 0,1130 | 0,0038 | |||
| G / Genpact Limited | 0,73 | 0,00 | 32,22 | −12,64 | 0,1034 | −0,0254 | |||
| HVT / Haverty Furniture Companies, Inc. | 1,56 | 61,53 | 31,76 | 66,69 | 0,1033 | 0,0368 | |||
| UVV / Universal Corporation | 0,50 | −45,50 | 28,94 | −43,37 | 0,0929 | −0,0856 | |||
| KEY / KeyCorp | 1,65 | 0,22 | 28,72 | 9,18 | 0,0921 | 0,0003 | |||
| GCO / Genesco Inc. | 1,43 | 44,42 | 28,22 | 33,95 | 0,0905 | 0,0170 | |||
| ARW / Arrow Electronics, Inc. | 0,22 | 0,00 | 28,19 | 22,73 | 0,0905 | 0,0103 | |||
| HELE / Helen of Troy Limited | 0,99 | 30,30 | 27,96 | −30,87 | 0,0897 | −0,0515 | |||
| UVSP / Univest Financial Corporation | 0,89 | −22,30 | 26,68 | −17,70 | 0,0856 | −0,0276 | |||
| CMA / Comerica Incorporated | 0,42 | 0,00 | 25,21 | 1,00 | 0,0809 | −0,0063 | |||
| ABEV / Ambev S.A. - Depositary Receipt (Common Stock) | 10,32 | −25,47 | 24,86 | −22,91 | 0,0798 | −0,0328 | |||
| CHRW / C.H. Robinson Worldwide, Inc. | 0,25 | −6,33 | 24,10 | −12,23 | 0,0784 | −0,0175 | |||
| BIDU / Baidu, Inc. - Depositary Receipt (Common Stock) | 0,28 | −0,06 | 23,71 | −6,87 | 0,0771 | −0,0118 | |||
| FMC / FMC Corporation | 0,56 | 0,08 | 23,44 | −0,96 | 0,0752 | −0,0074 | |||
| TBI / TrueBlue, Inc. | 2,92 | 2,97 | 18,92 | 25,65 | 0,0607 | 0,0081 | |||
| MMI / Marcus & Millichap, Inc. | 0,61 | 6,62 | 18,87 | −4,95 | 0,0605 | −0,0088 | |||
| HOFT / Hooker Furnishings Corporation | 1,36 | 2,23 | 14,38 | 7,73 | 0,0461 | −0,0005 | |||
| MAN / ManpowerGroup Inc. | 0,35 | 0,00 | 14,19 | −30,20 | 0,0455 | −0,0254 | |||
| FNF / Fidelity National Financial, Inc. | 0,22 | −4,78 | 12,52 | −17,98 | 0,0402 | −0,0131 | |||
| TSM / Taiwan Semiconductor Manufacturing Company Limited - Depositary Receipt (Common Stock) | 0,04 | 2,48 | 9,64 | 39,83 | 0,0313 | 0,0073 | |||
| BABA / Alibaba Group Holding Limited - Depositary Receipt (Common Stock) | 0,05 | 0,50 | 6,05 | −13,80 | 0,0194 | −0,0051 | |||
| KB / KB Financial Group Inc. - Depositary Receipt (Common Stock) | 0,04 | −17,38 | 3,44 | 26,10 | 0,0110 | 0,0015 | |||
| CIG / Companhia Energética de Minas Gerais - CEMIG - Depositary Receipt (Common Stock) | 1,59 | 0,30 | 3,11 | 11,70 | 0,0100 | 0,0003 | |||
| ITUB / Itaú Unibanco Holding S.A. - Depositary Receipt (Common Stock) | 0,41 | 0,00 | 2,78 | 23,49 | 0,0089 | 0,0011 | |||
| VALE / Vale S.A. - Depositary Receipt (Common Stock) | 0,29 | 0,00 | 2,78 | −2,73 | 0,0089 | −0,0011 | |||
| DAN / Dana Incorporated | 0,16 | −89,53 | 2,70 | −86,53 | 0,0087 | −0,0613 | |||
| PBR.A / Petróleo Brasileiro S.A. - Petrobras - Depositary Receipt (Common Stock) | 0,23 | 19,55 | 2,66 | 5,81 | 0,0085 | −0,0002 | |||
| ING / ING Groep N.V. - Depositary Receipt (Common Stock) | 0,06 | 11,47 | 1,23 | 24,49 | 0,0039 | 0,0005 | |||
| BCS / Barclays PLC - Depositary Receipt (Common Stock) | 0,06 | 8,95 | 1,20 | 31,87 | 0,0039 | 0,0007 | |||
| MT / ArcelorMittal S.A. - Depositary Receipt (Common Stock) | 0,04 | 10,48 | 1,18 | 20,92 | 0,0038 | 0,0004 | |||
| HSBC / HSBC Holdings plc - Depositary Receipt (Common Stock) | 0,02 | 6,04 | 1,15 | 12,25 | 0,0037 | 0,0002 | |||
| PHG / Koninklijke Philips N.V. - Depositary Receipt (Common Stock) | 0,02 | 33,52 | 0,50 | 26,07 | 0,0016 | 0,0002 | |||
| SMFG / Sumitomo Mitsui Financial Group, Inc. - Depositary Receipt (Common Stock) | 0,02 | 8,67 | 0,36 | 6,14 | 0,0012 | −0,0000 | |||
| NWG / NatWest Group plc - Depositary Receipt (Common Stock) | 0,02 | −45,10 | 0,34 | −34,86 | 0,0011 | −0,0007 | |||
| EQNR / Equinor ASA - Depositary Receipt (Common Stock) | 0,01 | 44,32 | 0,34 | 37,55 | 0,0011 | 0,0002 | |||
| IBN / ICICI Bank Limited - Depositary Receipt (Common Stock) | 0,01 | −48,94 | 0,34 | −45,53 | 0,0011 | −0,0011 | |||
| DIS / The Walt Disney Company | 0,00 | 0,00 | 0,32 | 25,50 | 0,0010 | 0,0001 | |||
| GSK / GSK plc - Depositary Receipt (Common Stock) | 0,01 | 0,29 | 0,0009 | 0,0009 | |||||
| CALM / Cal-Maine Foods, Inc. | 0,00 | 0,28 | 0,0009 | 0,0009 | |||||
| INTC / Intel Corporation | 0,01 | 0,00 | 0,28 | −1,08 | 0,0009 | −0,0001 | |||
| SNY / Sanofi - Depositary Receipt (Common Stock) | 0,01 | 3,62 | 0,27 | −9,73 | 0,0009 | −0,0002 | |||
| MRK / Merck & Co., Inc. | 0,00 | 0,26 | 0,0008 | 0,0008 | |||||
| ULTA / Ulta Beauty, Inc. | 0,00 | 0,25 | 0,0008 | 0,0008 | |||||
| CRUS / Cirrus Logic, Inc. | 0,00 | 0,00 | 0,24 | 4,76 | 0,0008 | −0,0000 | |||
| ADBE / Adobe Inc. | 0,00 | 0,23 | 0,0007 | 0,0007 | |||||
| HIG / The Hartford Insurance Group, Inc. | 0,00 | 0,22 | 0,0007 | 0,0007 | |||||
| ALKS / Alkermes plc | 0,01 | 0,21 | 0,0007 | 0,0007 | |||||
| DELL / Dell Technologies Inc. | 0,00 | 0,21 | 0,0007 | 0,0007 | |||||
| GILD / Gilead Sciences, Inc. | 0,00 | −100,00 | 0,00 | 0,0000 | |||||
| DFS / Discover Financial Services | 0,00 | −100,00 | 0,00 | 0,0000 | |||||
| EBAY / eBay Inc. | 0,00 | −100,00 | 0,00 | 0,0000 | |||||
| JELD / JELD-WEN Holding, Inc. | 0,00 | −100,00 | 0,00 | −100,00 | −0,2149 | ||||
| PAHC / Phibro Animal Health Corporation | 0,00 | −100,00 | 0,00 | 0,0000 | |||||
| COR / Cencora, Inc. | 0,00 | −100,00 | 0,00 | 0,0000 |