Grundläggande statistik
| Institutionella ägare | 604 total, 566 long only, 2 short only, 36 long/short - change of −11,92% MRQ |
| Genomsnittlig portföljallokering | 0.2722 % - change of −23,31% MRQ |
| Institutionella aktier (lång) | 902 000 876 (ex 13D/G) - change of −28,30MM shares −3,04% MRQ |
| Institutionellt värde (lång) | $ 11 236 834 USD ($1000) |
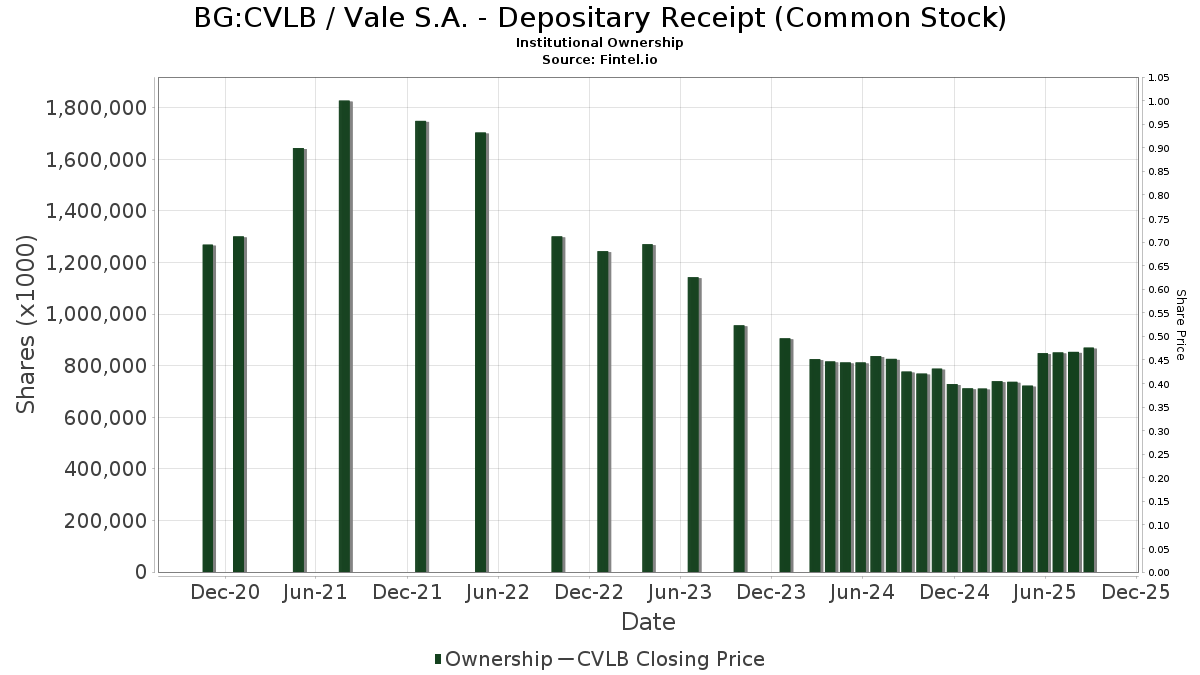
Institutionellt ägande och aktieägare
Vale S.A. - Depositary Receipt (Common Stock) (BG:CVLB) har 604 Institutionella ägare och aktieägare som har lämnat in 13D/G- eller 13F-formulär till Securities Exchange Commission (SEC). Dessa institut innehar totalt 902,000,876 aktier. Största aktieägare inkluderar Capital World Investors, BlackRock, Inc., GQG Partners LLC, Fmr Llc, Arrowstreet Capital, Limited Partnership, AIM INVESTMENT FUNDS (INVESCO INVESTMENT FUNDS) - Invesco Oppenheimer Developing Markets Fund Class R6, Capital International Investors, Lazard Asset Management Llc, Fisher Asset Management, LLC, and FEMSX - Fidelity Series Emerging Markets Opportunities Fund .
Vale S.A. - Depositary Receipt (Common Stock) (BUL:CVLB) Institutionell ägarstruktur visar institutioners och fonders nuvarande positioner i företaget, samt de senaste förändringarna i positionernas storlek. Större aktieägare kan vara enskilda investerare, fonder, hedgefonder eller institutioner. Bilaga 13D visar att investeraren äger (eller ägde) mer än 5% av företaget och avser (eller avsåg) att aktivt eftersträva en förändring av affärsstrategin. Schedule 13G indikerar en passiv investering på över 5%.
Fondsentimentets poäng
Fondsentimentet poängen(fka Ägarackumulation-poäng) visar vilka aktier som är mest köpta av fonder. Det är resultatet av en sofistikerad kvantitativ flerfaktormodell som identifierar företag med de högsta nivåerna av institutionell ackumulering. Poängsättningsmodellen använder en kombination av den totala ökningen av redovisade ägare, förändringarna i portföljallokeringarna för dessa ägare och andra mått. Siffran sträcker sig från 0 till 100, där högre siffror indikerar en högre nivå av ackumulering i förhållande till sina konkurrenter, och 50 är genomsnittet.
Uppdateringsfrekvens: Dagligen
Se Ownership Explorer, som innehåller en lista över de högst rankade företagen.
AI+ Ask Fintel’s AI assistant about Vale S.A. - Depositary Receipt (Common Stock).
Select a question to share a public post with an AI-crafted answer.
Thinking of good questions…
13F- och NPORT-arkiveringar
Detaljer om 13F-arkiveringar är gratis. Detaljer om NP-arkiveringar kräver ett premiummedlemskap. Gröna rader indikerar nya positioner. Röda rader indikerar stängda positioner. Klicka på länk symbolen för att se hela transaktionshistoriken.
Uppgradera
för att låsa upp premiumdata och exportera till Excel ![]() .
.
Important Note
In an effort to reduce load times for our mobile users, we are testing some ways to deliver lighter pages.
In this first test, we will deliver only the most recent 750 transactions (out of 805 for this stock). If you are interested in loading *all* the transactions for this company, click the "load all" button below. This is just a test and if you don't like it, please let us know by submitting some gentle feedback via the link at the bottom of this page.
Load All| Fil Datum | Källa | Investerare | Typ | Genomsnittligt pris (beräknat) |
Aktier | Δ Aktier (%) |
Rapporterat värde (1000 USD) |
Δ Värde (%) |
Portföljallokering (%) |
|
|---|---|---|---|---|---|---|---|---|---|---|
| 2026-02-13 | 13F | Walleye Trading LLC | Put | 1 725 000 | 13,49 | 22 477 | 36,17 | |||
| 2026-02-13 | 13F | Walleye Trading LLC | Call | 1 440 200 | 10,38 | 18 766 | 32,43 | |||
| 2026-02-13 | 13F | Walleye Trading LLC | 245 728 | −6,75 | 3 202 | 11,88 | ||||
| 2026-01-15 | 13F | Founders Capital Management | 3 800 | 0,00 | 50 | 19,51 | ||||
| 2026-02-04 | 13F | D'Orazio & Associates, Inc. | 62 503 | 11,99 | 814 | 34,32 | ||||
| 2026-02-17 | 13F | Private Advisor Group, LLC | 39 125 | −0,48 | 510 | 19,48 | ||||
| 2026-02-17 | 13F | Pine Valley Investments Ltd Liability Co | Call | 8 178 | ||||||
| 2025-09-26 | NP | DILAX - Davis International Fund Class A | 266 390 | 0,00 | 2 539 | 2,34 | ||||
| 2026-01-30 | 13F | R Squared Ltd | 54 967 | 3,94 | 716 | 24,74 | ||||
| 2026-02-12 | 13F | Jane Street Group, Llc | Call | 442 700 | −77,12 | 5 768 | −72,55 | |||
| 2026-02-12 | 13F | Jane Street Group, Llc | Put | 1 165 700 | 21,21 | 15 189 | 45,43 | |||
| 2026-02-12 | 13F | Jane Street Group, Llc | 3 412 312 | 383,13 | 44 462 | 479,69 | ||||
| 2026-02-17 | 13F | Tower Research Capital LLC (TRC) | 293 | −89,41 | 4 | −90,00 | ||||
| 2026-01-26 | 13F | Mountain Hill Investment Partners Corp. | 3 500 | −68,18 | 46 | −62,18 | ||||
| 2026-02-02 | 13F | Ping Capital Management, Inc. | 35 100 | −73,57 | 457 | −68,31 | ||||
| 2026-01-14 | 13F | Generali Investments CEE, investicni spolecnost, a.s. | 24 600 | −41,57 | 321 | −29,98 | ||||
| 2026-02-12 | 13F | DRW Securities, LLC | 53 642 | −73,30 | 699 | −67,89 | ||||
| 2026-02-13 | 13F | MAI Capital Management | 24 698 | 5,16 | 322 | 25,88 | ||||
| 2026-02-17 | 13F | Amundi | 1 598 530 | 10,88 | 20 829 | 27,97 | ||||
| 2026-01-20 | 13F | Signaturefd, Llc | 32 614 | 1,93 | 425 | 22,19 | ||||
| 2026-02-09 | 13F | SLT Holdings LLC | 18 250 | 238 | ||||||
| 2025-09-24 | NP | CDAZX - Multi-Manager Directional Alternative Strategies Fund Institutional Class | 27 966 | 3,81 | 267 | 6,40 | ||||
| 2026-02-13 | 13F | Van Eck Associates Corp | 3 400 270 | 13,50 | 44 | 37,50 | ||||
| 2025-11-12 | 13F | HAP Trading, LLC | Call | 44 600 | 8 | |||||
| 2026-02-17 | 13F | Engineers Gate Manager LP | 228 272 | 2 974 | ||||||
| 2026-02-11 | 13F | Vise Technologies, Inc. | 32 091 | 45,82 | 418 | 74,90 | ||||
| 2026-02-10 | 13F | Verus Capital Partners, Llc | 132 123 | 13,78 | 1 722 | 36,48 | ||||
| 2026-02-10 | 13F | Sivia Capital Partners, LLC | 12 733 | −0,26 | 166 | 19,57 | ||||
| 2025-11-14 | 13F | Ion Asset Management Ltd. | 81 800 | 888 | ||||||
| 2026-01-26 | 13F | Merit Financial Group, LLC | 23 832 | 12,77 | 311 | 35,37 | ||||
| 2026-02-03 | 13F | Maxi Investments CY Ltd | 0 | −100,00 | 0 | |||||
| 2025-09-23 | NP | IEMGX - Voya Multi-Manager Emerging Markets Equity Fund Class I | 17 314 | −49,54 | 165 | −48,28 | ||||
| 2026-02-04 | 13F | Community Bank, N.A. | 600 | 0,00 | 8 | 16,67 | ||||
| 2026-02-09 | 13F | Huntington National Bank | 8 121 | 72,31 | 106 | 105,88 | ||||
| 2026-02-02 | 13F | Chung Wu Investment Group, LLC | 3 500 | 0,00 | 46 | 18,42 | ||||
| 2026-02-17 | 13F | Orbis Allan Gray Ltd | 18 242 181 | 34,39 | 237 696 | 61,25 | ||||
| 2026-02-10 | 13F | Cravens & Co Advisors, LLC | 20 202 | −0,44 | 285 | 29,55 | ||||
| 2025-09-25 | NP | DFEM - Dimensional Emerging Markets Core Equity 2 ETF | 1 720 718 | 7,91 | 16 398 | 10,47 | ||||
| 2026-02-13 | 13F | Walleye Capital LLC | Call | 31 300 | 104,58 | 408 | 145,18 | |||
| 2026-02-13 | 13F | Walleye Capital LLC | Put | 129 400 | 16 075,00 | 1 686 | 20 975,00 | |||
| 2026-02-13 | 13F | Walleye Capital LLC | 211 023 | −87,38 | 2 750 | −84,87 | ||||
| 2026-02-13 | 13F | Sei Investments Co | 1 317 933 | 100,56 | 17 173 | 140,64 | ||||
| 2026-02-06 | 13F | Larson Financial Group LLC | 10 215 | 390,63 | 133 | 504,55 | ||||
| 2025-09-26 | NP | Global Macro Portfolio - Global Macro Portfolio | 371 000 | 17,39 | 3 536 | 20,16 | ||||
| 2026-02-17 | 13F | Janus Henderson Group Plc | 1 115 499 | −0,70 | 14 533 | 19,10 | ||||
| 2026-01-29 | 13F | Kestra Private Wealth Services, Llc | 15 760 | 0,03 | 205 | 19,88 | ||||
| 2026-02-11 | 13F | MidWestOne Financial Group, Inc. | 133 267 | −26,43 | 1 736 | −11,74 | ||||
| 2026-02-13 | 13F | Lord, Abbett & Co. Llc | 2 100 000 | 27 | ||||||
| 2026-02-02 | 13F | Principal Financial Group Inc | 379 340 | 6,79 | 4 943 | 28,13 | ||||
| 2026-02-17 | 13F | Oaktree Capital Management Lp | 2 023 706 | −0,49 | 26 369 | 19,39 | ||||
| 2026-01-27 | 13F | Ninety One UK Ltd | 7 715 768 | 1,09 | 100 536 | 21,28 | ||||
| 2026-02-17 | 13F | LMR Partners LLP | Call | 51 700 | −55,66 | 674 | −46,84 | |||
| 2026-02-13 | 13F | Rhumbline Advisers | 123 785 | −31,22 | 1 613 | −17,50 | ||||
| 2026-02-17 | 13F | LMR Partners LLP | Put | 91 900 | 0,00 | 1 197 | 19,94 | |||
| 2025-11-14 | 13F | Capstone Investment Advisors, Llc | 37 993 | 413 | ||||||
| 2026-02-17 | 13F | Citadel Advisors Llc | Call | 3 835 400 | −50,18 | 49 975 | −40,23 | |||
| 2026-02-17 | 13F | Citadel Advisors Llc | 5 921 812 | 54,30 | 77 161 | 85,13 | ||||
| 2026-02-17 | 13F | Citadel Advisors Llc | Put | 1 771 300 | −20,93 | 23 080 | −5,13 | |||
| 2026-01-23 | 13F | Octavia Wealth Advisors, LLC | 17 175 | 48,64 | 228 | 81,60 | ||||
| 2026-02-05 | 13F | Bessemer Group Inc | 24 929 | 0,00 | 0 | |||||
| 2026-02-10 | 13F/A | Northwestern Mutual Wealth Management Co | 93 642 | −3,79 | 1 220 | 15,53 | ||||
| 2026-02-12 | 13F | Scotia Capital Inc. | 199 954 | 0,29 | 2 605 | 20,32 | ||||
| 2026-02-17 | 13F | Two Sigma Advisers, Lp | 2 461 400 | 32 072 | ||||||
| 2025-11-14 | 13F | Northwest Bancshares, Inc. | 0 | −100,00 | 0 | |||||
| 2026-02-17 | 13F | Aster Capital Management (DIFC) Ltd | 0 | −100,00 | 0 | |||||
| 2026-01-29 | 13F | Aprio Wealth Management, LLC | 54 823 | 29,25 | 714 | 55,22 | ||||
| 2026-02-02 | 13F | Truist Financial Corp | 8 109 148 | 16 205,37 | 105 662 | 19 467,04 | ||||
| 2026-01-08 | 13F | True Wealth Design, LLC | 469 | 0,00 | 6 | 20,00 | ||||
| 2026-02-13 | 13F | Boston Partners | 65 338 | 851 | ||||||
| 2025-09-23 | NP | VVIFX - Voya VACS Series EME Fund | 22 929 | −59,69 | 219 | −58,79 | ||||
| 2026-01-23 | 13F | U.S. Capital Wealth Advisors, LLC | 25 284 | −2,38 | 329 | 17,08 | ||||
| 2025-09-29 | NP | Calamos Global Total Return Fund | 5 250 | 0,00 | 50 | 4,17 | ||||
| 2026-01-21 | 13F | Stone House Investment Management, LLC | 100 | 0,00 | 1 | 0,00 | ||||
| 2026-01-27 | 13F | Wealth Enhancement Trust Services, Inc. | 3 000 | 39 | ||||||
| 2026-01-28 | 13F | CAPROCK Group, Inc. | 270 326 | 22,06 | 3 584 | 52,34 | ||||
| 2026-02-13 | 13F | Kestra Advisory Services, LLC | 0 | −100,00 | 0 | |||||
| 2026-02-11 | 13F | Group One Trading, L.p. | Put | 3 481 200 | −3,93 | 45 360 | 15,26 | |||
| 2026-02-11 | 13F | Group One Trading, L.p. | 98 717 | 1 286 | ||||||
| 2026-02-06 | 13F | Windmill Hill Asset Management Ltd | 61 344 | 0,00 | 799 | 19,97 | ||||
| 2026-02-17 | 13F | Grantham, Mayo, Van Otterloo & Co. LLC | 317 300 | 4 134 | ||||||
| 2026-01-16 | 13F | Perigon Wealth Management, LLC | 96 063 | 40,54 | 1 252 | 68,60 | ||||
| 2026-02-17 | 13F | Millennium Management Llc | Call | 310 300 | −9,90 | 4 043 | 8,10 | |||
| 2026-02-19 | 13F | Invesco Ltd. | 17 158 851 | −40,75 | 223 580 | −28,92 | ||||
| 2026-02-17 | 13F | Mercer Global Advisors Inc /adv | 87 097 | −8,87 | 1 135 | 9,35 | ||||
| 2026-01-05 | 13F | Union Bancaire Privee, UBP SA | 16 000 | 16,74 | 193 | 37,86 | ||||
| 2026-02-17 | 13F | Millennium Management Llc | 8 360 116 | 9,03 | 108 932 | 30,81 | ||||
| 2026-02-17 | 13F | Millennium Management Llc | Put | 283 900 | −1,83 | 3 699 | 17,80 | |||
| 2026-02-10 | 13F | Capital Innovations LLC | 0 | −100,00 | 0 | |||||
| 2026-01-21 | 13F | Flagship Harbor Advisors, Llc | 3 597 | −73,17 | 47 | −68,28 | ||||
| 2026-02-17 | 13F | EFG International AG | 4 000 | 52 | ||||||
| 2026-02-13 | 13F | Oceanic Investment Management LTD | 21 026 | 274 | ||||||
| 2026-02-02 | 13F | Qrg Capital Management, Inc. | 81 702 | 55,38 | 1 065 | 86,34 | ||||
| 2026-02-13 | 13F | Islay Capital Management, Llc | 1 000 | 0,00 | 13 | 30,00 | ||||
| 2026-02-17 | 13F | MIRAE ASSET GLOBAL ETFS HOLDINGS Ltd. | 43 705 | 17,34 | 569 | 40,84 | ||||
| 2025-09-25 | NP | Alpine Total Dynamic Dividend Fund | 0 | −100,00 | 0 | −100,00 | ||||
| 2026-01-30 | 13F | Pekin Hardy Strauss, Inc. | 78 689 | 5,65 | 1 025 | 26,86 | ||||
| 2026-01-29 | 13F | Matthews International Capital Management Llc | 132 432 | 1 726 | ||||||
| 2026-01-20 | 13F | Stratos Wealth Advisors, LLC | 0 | −100,00 | 0 | |||||
| 2026-02-09 | 13F | Cary Street Partner Investment Advisory Llc | 3 267 | 18,89 | 43 | 44,83 | ||||
| 2026-01-07 | 13F | Sagespring Wealth Partners, Llc | 15 693 | 18,62 | 204 | 42,66 | ||||
| 2026-02-17 | 13F | Public Employees Retirement System Of Ohio | 958 883 | −3,93 | 12 494 | 15,27 | ||||
| 2026-03-06 | 13F | Hsbc Holdings Plc | 2 216 984 | 6,39 | 28 890 | 27,71 | ||||
| 2026-02-02 | 13F | Legacy Edge Advisors, LLC | 13 500 | 176 | ||||||
| 2026-01-30 | 13F | ARGA Investment Management, LP | 182 364 | 0,00 | 2 376 | 20,00 | ||||
| 2026-02-09 | 13F | Hantz Financial Services, Inc. | 179 919 | 53,73 | 2 | 100,00 | ||||
| 2026-02-13 | 13F | Itau Unibanco Holding S.A. | 10 122 584 | 69,64 | 132 707 | 104,79 | ||||
| 2026-02-13 | 13F | Pinpoint Asset Management (Singapore) Pte. Ltd. | 18 087 | 236 | ||||||
| 2026-01-26 | 13F | Means Investment Co., Inc. | Call | 0 | −100,00 | 0 | ||||
| 2026-02-06 | 13F | Gsa Capital Partners Llp | 124 869 | 54,26 | 2 | |||||
| 2026-02-05 | 13F | Everstar Asset Management, LLC | 30 000 | 0,00 | 391 | 20,00 | ||||
| 2025-11-14 | 13F | Wetherby Asset Management Inc | 39 664 | −3,05 | 431 | 8,31 | ||||
| 2025-09-25 | NP | JEMA - JPMorgan Emerging Markets Equity Core ETF | 145 141 | −3,21 | 1 383 | −0,93 | ||||
| 2025-09-25 | NP | Thrivent Core Funds - Thrivent Core Emerging Markets Equity Fund | 370 949 | 4,33 | 3 535 | 6,80 | ||||
| 2026-02-11 | 13F | Capital World Investors | 89 322 261 | 58,21 | 1 163 896 | 89,84 | ||||
| 2026-02-17 | 13F | Balyasny Asset Management Llc | Call | 226 000 | −5,24 | 2 948 | 13,78 | |||
| 2025-09-26 | NP | FSSGX - Fidelity SAI Sustainable Emerging Markets Equity Fund | 0 | −100,00 | 0 | −100,00 | ||||
| 2026-02-17 | 13F | Tudor Investment Corp Et Al | Call | 0 | −100,00 | 0 | −100,00 | |||
| 2026-02-17 | 13F | Balyasny Asset Management Llc | Put | 493 400 | 12,65 | 6 431 | 35,22 | |||
| 2026-02-17 | 13F | Old West Investment Management, LLC | 92 080 | 1 200 | ||||||
| 2026-02-02 | 13F | Oppenheimer & Co Inc | 0 | −100,00 | 0 | |||||
| 2026-02-19 | 13F | CI Private Wealth, LLC | 12 842 | −82,13 | 167 | −78,59 | ||||
| 2026-01-28 | 13F | Kingswood Wealth Advisors, Llc | 10 593 | 138 | ||||||
| 2026-02-17 | 13F | Lighthouse Investment Partners, LLC | 370 459 | 21,15 | 4 827 | 45,39 | ||||
| 2025-11-04 | 13F | Winnow Wealth Llc | 0 | −100,00 | 0 | |||||
| 2026-01-20 | 13F | SOA Wealth Advisors, LLC. | 170 | 0,00 | 2 | 100,00 | ||||
| 2026-01-26 | 13F | Heritage Wealth Management, Inc. | 11 000 | 0,00 | 143 | 20,17 | ||||
| 2026-01-09 | 13F | Diversified Trust Co | 36 152 | −2,38 | 471 | 17,16 | ||||
| 2026-02-03 | 13F | Mitsubishi UFJ Kokusai Asset Management Co., Ltd. | 0 | −100,00 | 0 | −100,00 | ||||
| 2026-02-17 | 13F/A | Cantor Fitzgerald, L. P. | 0 | −100,00 | 0 | −100,00 | ||||
| 2026-02-19 | 13F | Atomi Financial Group, Inc. | 96 652 | 26,62 | 1 259 | 52,05 | ||||
| 2026-01-22 | 13F | Intergy Private Wealth, LLC | 13 851 | 20,13 | 180 | 44,00 | ||||
| 2026-02-10 | 13F | Goldman Sachs Group Inc | Call | 1 769 500 | −59,50 | 23 057 | −51,41 | |||
| 2026-02-10 | 13F | Goldman Sachs Group Inc | Put | 13 493 500 | 7,90 | 175 820 | 29,46 | |||
| 2026-01-20 | 13F | Perpetual Ltd | 141 560 | −2,35 | 1 845 | 17,15 | ||||
| 2026-02-10 | 13F | Goldman Sachs Group Inc | 13 587 443 | 8,35 | 177 044 | 29,99 | ||||
| 2026-01-26 | 13F | Private Trust Co Na | 40 | 0,00 | 1 | |||||
| 2026-01-05 | 13F | Commons Capital, Llc | 141 750 | 0,00 | 1 847 | 20,01 | ||||
| 2026-02-13 | 13F | Nfj Investment Group, Llc | 55 | 0,00 | 1 | |||||
| 2026-02-12 | 13F | Rossby Financial, LCC | 297 | 0,00 | 4 | 0,00 | ||||
| 2026-02-17 | 13F | Voloridge Investment Management, Llc | 2 959 832 | 9 173,53 | 38 567 | 11 046,24 | ||||
| 2026-02-03 | 13F | We Are One Seven, LLC | 39 080 | −14,13 | 509 | 3,04 | ||||
| 2026-02-09 | 13F | Morningstar Investment Management LLC | 0 | −100,00 | 0 | |||||
| 2026-02-12 | 13F | Barings Llc | 878 365 | 10,81 | 11 445 | 32,96 | ||||
| 2026-02-26 | 13F | Anchor Investment Management, LLC | 250 | 0,00 | 3 | 50,00 | ||||
| 2026-02-12 | 13F | Brinker Capital Investments, LLC | 58 297 | 22,42 | 760 | 46,81 | ||||
| 2026-02-09 | 13F | Strategic Financial Concepts, LLC | 13 700 | 179 | ||||||
| 2026-01-21 | 13F | Greenleaf Trust | 28 207 | 0,00 | 368 | 19,93 | ||||
| 2026-02-11 | 13F | USCF Advisers LLC | 100 | 0,00 | 1 | 0,00 | ||||
| 2026-02-14 | 13F | Frec Markets, Inc. | 14 447 | 188 | ||||||
| 2026-02-10 | 13F | Baker Avenue Asset Management, LP | 10 200 | 0,00 | 133 | 20,00 | ||||
| 2026-01-07 | 13F | Hilltop National Bank | 370 | −35,09 | 5 | −33,33 | ||||
| 2026-02-12 | 13F | Keynote Financial Services Llc | 36 594 | −3,43 | 477 | 15,82 | ||||
| 2026-02-13 | 13F | Marnell Management LLC | 25 800 | 336 | ||||||
| 2026-02-17 | 13F | Aqr Capital Management Llc | 9 530 954 | 826,73 | 124 188 | 1 012,00 | ||||
| 2026-02-11 | 13F | Jpmorgan Chase & Co | 4 545 946 | 2,15 | 59 234 | 22,55 | ||||
| 2026-02-11 | 13F | Jpmorgan Chase & Co | Put | 8 850 000 | 36,15 | 115 316 | 63,36 | |||
| 2026-02-17 | 13F | XTX Topco Ltd | 467 887 | 521,93 | 6 097 | 646,14 | ||||
| 2025-11-12 | 13F | Creekmur Asset Management LLC | 12 | 0,00 | 0 | |||||
| 2025-09-23 | NP | SLANX - DWS Latin America Equity Fund Class A | 190 900 | 22,06 | 1 819 | 24,93 | ||||
| 2026-02-17 | 13F | Roehl & Yi Investment Advisors, LLC | 12 447 | 162 | ||||||
| 2026-02-03 | 13F | Kassira Wealth Management LLC | 40 458 | −3,65 | 527 | 15,57 | ||||
| 2026-02-02 | 13F | Nkcfo Llc | 237 750 | 3 | ||||||
| 2026-02-17 | 13F | Rwc Asset Advisors (us) Llc | 6 523 762 | 8,98 | 85 005 | 30,75 | ||||
| 2025-11-12 | 13F | Ameliora Wealth Management Ltd. | 0 | −100,00 | 0 | |||||
| 2026-02-13 | 13F | Mml Investors Services, Llc | 260 439 | 4,05 | 3 394 | 24,83 | ||||
| 2025-09-26 | NP | PCEMX - PACE International Emerging Markets Equity Investments Class P | 115 775 | −30,64 | 1 103 | −51,73 | ||||
| 2026-02-12 | 13F | Campbell & CO Investment Adviser LLC | 0 | −100,00 | 0 | |||||
| 2026-02-17 | 13F | Ninepoint Partners LP | 228 | 3 | ||||||
| 2026-02-04 | 13F | BCJ Capital Management, LLC | 484 111 | 6 308 | ||||||
| 2026-02-09 | 13F | MTM Investment Management, LLC | 12 | 0,00 | 0 | |||||
| 2026-02-13 | 13F | Focused Alpha, Llc | 18 917 | 246 | ||||||
| 2026-02-13 | 13F | Vontobel Holding Ltd. | 144 207 | 218,26 | 1 879 | 281,91 | ||||
| 2026-01-15 | 13F | Nisa Investment Advisors, Llc | 1 270 | 5,83 | 17 | 30,77 | ||||
| 2025-09-24 | NP | BLACKROCK NATURAL RESOURCES TRUST - BLACKROCK NATURAL RESOURCES TRUST Investor A This fund is a listed as child fund of BlackRock, Inc. and if that institution has disclosed ownership in this security, then these positions will not be double counted when calculating total shares and total value | 531 071 | −25,89 | 5 061 | −24,13 | ||||
| 2026-02-17 | 13F | Ancora Advisors, LLC | 480 | 6 | ||||||
| 2026-02-13 | 13F | Arrowstreet Capital, Limited Partnership | 41 596 000 | 2 239,57 | 541 996 | 2 707,10 | ||||
| 2026-02-10 | 13F | Daiwa Securities Group Inc. | 136 194 | −11,67 | 2 | 0,00 | ||||
| 2026-02-13 | 13F | NLB Skladi, upravljanje premozenja, d.o.o. | 494 796 | 6 447 | ||||||
| 2026-01-08 | 13F | Tuttle Tactical Management LLC | 30 627 | 399 | ||||||
| 2026-02-13 | 13F | Pine Valley Investments Ltd Liability Co | 0 | −100,00 | 0 | |||||
| 2026-02-13 | 13F | First Trust Advisors Lp | 231 454 | 30,01 | 3 016 | 55,98 | ||||
| 2026-01-20 | 13F | Ascent Group, LLC | 63 229 | 4,16 | 824 | 24,89 | ||||
| 2026-02-12 | 13F | Commonwealth Equity Services, Llc | 184 462 | 8,38 | 2 404 | 240 200,00 | ||||
| 2026-02-23 | 13F | Wealth Preservation Advisors, LLC | 150 | 2 | ||||||
| 2026-02-17 | 13F | ION Fund Management Ltd | Call | 2 307 100 | 30 062 | |||||
| 2026-02-17 | 13F | Susquehanna International Group, Llp | Put | 14 617 300 | 19,55 | 190 463 | 43,44 | |||
| 2026-02-17 | 13F | Susquehanna International Group, Llp | Call | 7 156 200 | 0,09 | 93 245 | 20,09 | |||
| 2026-02-17 | 13F | Susquehanna International Group, Llp | 4 015 527 | −36,25 | 52 322 | −23,52 | ||||
| 2026-01-28 | 13F | Old National Bancorp /in/ | 17 254 | 23,37 | 225 | 48,34 | ||||
| 2026-02-11 | 13F | Capital International Investors | 27 642 423 | −40,19 | 360 298 | −28,19 | ||||
| 2026-03-04 | 13F | Rehmann Capital Advisory Group | 16 509 | 49,65 | 215 | 80,67 | ||||
| 2025-11-14 | 13F | Compass Rose Asset Management, LP | 0 | −100,00 | 0 | −100,00 | ||||
| 2026-02-12 | 13F | Intesa Sanpaolo Wealth Management | 24 000 | 313 | ||||||
| 2026-02-13 | 13F | Natixis | 207 198 | 273,31 | 2 700 | 348,34 | ||||
| 2026-02-17 | 13F | Turim 21 Investimentos Ltda. | 3 131 646 | 0,00 | 40 805 | 19,98 | ||||
| 2025-09-26 | NP | MSTFX - Morningstar International Equity Fund | 101 925 | 13,65 | 971 | 16,43 | ||||
| 2025-09-25 | NP | DFEV - Dimensional Emerging Markets Value ETF | 855 296 | 0,00 | 8 151 | 2,36 | ||||
| 2026-02-13 | 13F | SRS Capital Advisors, Inc. | 4 372 | 1 167,25 | 57 | 1 766,67 | ||||
| 2026-01-23 | 13F | Assetmark, Inc | 289 337 | 10,95 | 3 770 | 33,12 | ||||
| 2025-11-05 | 13F | Flynn Zito Capital Management, Llc | 0 | −100,00 | 0 | |||||
| 2026-02-18 | 13F | Vident Advisory, LLC | 164 189 | 0,11 | 2 139 | 20,10 | ||||
| 2025-09-24 | NP | SNTKX - Steward International Enhanced Index Fund Class A | 90 960 | 0,00 | 867 | 2,36 | ||||
| 2025-09-25 | NP | EMGAX - Wells Fargo Emerging Markets Equity Fund Class A | 1 590 978 | 0,00 | 15 162 | 2,36 | ||||
| 2026-01-30 | 13F | Mizuho Securities Co. Ltd. | 0 | −100,00 | 0 | |||||
| 2026-02-13 | 13F | Causeway Capital Management Llc | 904 000 | 11 779 | ||||||
| 2026-01-26 | 13F | Moran Wealth Management, LLC | 79 095 | 26,92 | 1 031 | 52,37 | ||||
| 2026-01-14 | 13F | LVW Advisors, LLC | 27 938 | 364 | ||||||
| 2025-11-14 | 13F | Dynamo Administracao de Recursos Ltda. | 4 633 | −41,08 | 50 | −34,21 | ||||
| 2026-02-17 | 13F | one8zero8, LLC | 43 500 | 8,75 | 567 | 30,41 | ||||
| 2025-11-14 | 13F | Atom Investors LP | 0 | −100,00 | 0 | |||||
| 2026-02-03 | 13F | Gateway Investment Advisers Llc | 20 927 | 2,73 | 273 | 23,08 | ||||
| 2026-02-17 | 13F | Tudor Investment Corp Et Al | 196 150 | 2 556 | ||||||
| 2026-02-17 | 13F | Tudor Investment Corp Et Al | Put | 110 400 | 1 439 | |||||
| 2026-02-13 | 13F | Arkadios Wealth Advisors | 76 316 | −6,15 | 994 | 12,57 | ||||
| 2025-09-25 | NP | SEMVX - Hartford Schroders Emerging Markets Equity Fund Class A | 0 | −100,00 | 0 | −100,00 | ||||
| 2025-10-07 | 13F | Sonora Investment Management Group, LLC | 12 850 | 140 | ||||||
| 2026-02-12 | 13F | CIBC Private Wealth Group, LLC | 2 001 | −13,00 | 26 | 8,33 | ||||
| 2026-02-04 | 13F | Oxbow Advisors, LLC | 546 782 | 10,02 | 7 125 | 32,00 | ||||
| 2026-01-23 | 13F | Freestone Capital Holdings, LLC | 16 496 | 0,34 | 215 | 20,22 | ||||
| 2026-01-26 | 13F | Cwm, Llc | 3 190 | −0,22 | 0 | |||||
| 2025-11-14 | 13F | Two Sigma Securities, Llc | 0 | −100,00 | 0 | |||||
| 2026-02-04 | 13F | Ameritas Advisory Services, LLC | 0 | −100,00 | 0 | |||||
| 2026-01-20 | 13F | Thurston, Springer, Miller, Herd & Titak, Inc. | 98 | 1 | ||||||
| 2026-02-09 | 13F | Frazier Financial Advisors, LLC | 499 | 237,16 | 7 | 500,00 | ||||
| 2026-02-09 | 13F | Arista Wealth Management, LLC | 0 | −100,00 | 0 | |||||
| 2026-02-11 | 13F | Vermillion Wealth Management, Inc. | 2 | 0 | ||||||
| 2026-02-13 | 13F | Banco Santander, S.A. | 263 854 | −53,73 | 3 438 | −44,48 | ||||
| 2026-02-13 | 13F | Macquarie Group Ltd | 0 | −100,00 | 0 | |||||
| 2026-02-12 | 13F | Marex Group plc | 166 735 | 9,55 | 2 173 | 31,48 | ||||
| 2026-03-12 | 13F/A | Peak6 Llc | Put | 774 800 | 167,17 | 10 096 | 220,58 | |||
| 2026-03-12 | 13F/A | Peak6 Llc | Call | 607 900 | 143,16 | 7 921 | 191,71 | |||
| 2026-02-11 | 13F | Metis Global Partners, LLC | 296 177 | −8,21 | 3 859 | 10,13 | ||||
| 2026-02-17 | 13F | Warren Averett Asset Management, LLC | 14 477 | 12,43 | 189 | 35,25 | ||||
| 2026-03-12 | 13F/A | Peak6 Llc | 105 098 | 1 369 | ||||||
| 2025-11-03 | 13F | Stonehage Fleming Financial Services Holdings Ltd | 0 | −100,00 | 0 | |||||
| 2026-02-17 | 13F | Schonfeld Strategic Advisors LLC | 0 | −100,00 | 0 | |||||
| 2026-02-13 | 13F | Level Four Advisory Services, Llc | 164 710 | −2,75 | 2 146 | 16,69 | ||||
| 2026-02-12 | 13F | Bank Of Montreal /can/ | 1 721 116 | 229,21 | 22 547 | 297,15 | ||||
| 2025-09-26 | NP | EPDPX - EuroPac International Dividend Income Fund Class A | 40 000 | 0,00 | 381 | 2,42 | ||||
| 2026-02-13 | 13F | Squarepoint Ops LLC | Call | 801 900 | −78,29 | 10 449 | −73,95 | |||
| 2026-01-29 | 13F | UBS Group AG | Put | 6 143 378 | 42,05 | 80 048 | 70,43 | |||
| 2026-02-13 | 13F | Squarepoint Ops LLC | Put | 4 744 100 | 30,54 | 61 816 | 56,63 | |||
| 2026-01-29 | 13F | UBS Group AG | Call | 8 602 409 | −14,49 | 112 089 | 2,60 | |||
| 2026-02-13 | 13F | Squarepoint Ops LLC | 449 599 | 2 191,53 | 5 858 | 2 650,23 | ||||
| 2026-01-29 | 13F | UBS Group AG | 4 630 332 | −50,64 | 60 333 | −40,77 | ||||
| 2026-02-17 | 13F | Hood River Capital Management LLC | 1 300 | 17 | ||||||
| 2026-02-17 | 13F | D. E. Shaw & Co., Inc. | Put | 429 300 | −35,15 | 5 594 | −22,20 | |||
| 2026-02-17 | 13F | D. E. Shaw & Co., Inc. | Call | 985 000 | −68,04 | 12 835 | −61,65 | |||
| 2025-11-13 | 13F | Beaird Harris Wealth Management, LLC | 0 | −100,00 | 0 | |||||
| 2026-02-02 | 13F | Benjamin Edwards Inc | 11 051 | 5,35 | 144 | 26,55 | ||||
| 2026-01-29 | 13F | Rakuten Securities, Inc. | 8 283 | −29,74 | 108 | −16,41 | ||||
| 2025-09-25 | NP | TWAAX - Thrivent International Allocation Fund Class A | 48 742 | 6,05 | 465 | 8,67 | ||||
| 2026-02-13 | 13F | Ieq Capital, Llc | 59 380 | 35,97 | 774 | 63,08 | ||||
| 2026-02-17 | 13F | Balyasny Asset Management Llc | 0 | −100,00 | 0 | |||||
| 2026-02-18 | 13F | Caitlin John, LLC | 4 310 | 85,38 | 56 | 124,00 | ||||
| 2026-02-17 | 13F | Northern Trust Corp | 4 864 383 | 5,94 | 63 383 | 27,10 | ||||
| 2026-02-12 | 13F | Nuveen, LLC | 3 280 249 | −6,81 | 42 742 | 11,82 | ||||
| 2026-02-17 | 13F | DV Trading LLC | 262 | 3 | ||||||
| 2025-09-29 | NP | CVY - Invesco Zacks Multi-Asset Income ETF This fund is a listed as child fund of Invesco Ltd. and if that institution has disclosed ownership in this security, then these positions will not be double counted when calculating total shares and total value | 104 798 | 13,95 | 999 | 0,10 | ||||
| 2026-01-21 | 13F | Prime Capital Investment Advisors, LLC | 0 | −100,00 | 0 | |||||
| 2025-09-25 | NP | NEWFX - NEW WORLD FUND INC Class A | 13 432 672 | 9,51 | 128 013 | 12,10 | ||||
| 2026-03-16 | 13F | Bank of New Hampshire | 1 155 | 0,00 | 15 | 25,00 | ||||
| 2026-02-11 | 13F | West Family Investments, Inc. | 10 014 | 0,00 | 130 | 20,37 | ||||
| 2025-10-17 | 13F | Westend Capital Management LLC | 0 | −100,00 | 0 | −100,00 | ||||
| 2025-11-14 | 13F | Capula Management Ltd | Call | 0 | −100,00 | 0 | ||||
| 2026-02-17 | 13F | SageView Advisory Group, LLC | 100 | 1 | ||||||
| 2026-02-17 | 13F | Delaware Management Holdings, Inc. | 1 570 579 | 20 465 | ||||||
| 2026-02-17 | 13F | TCG Advisory Services, LLC | 51 779 | 675 | ||||||
| 2026-02-20 | 13F | White Knight Strategic Wealth Advisors, LLC | 0 | −100,00 | 0 | |||||
| 2026-01-27 | 13F | Journey Advisory Group, LLC | 407 902 | 0,30 | 5 315 | 20,34 | ||||
| 2026-01-26 | 13F | Abbington Investment Group | 176 989 | 19,83 | 2 306 | 43,77 | ||||
| 2026-02-10 | 13F | Acadian Asset Management Llc | 5 095 487 | 9 375,22 | 66 | |||||
| 2026-02-12 | 13F | Dimensional Fund Advisors Lp | 7 183 913 | −11,49 | 93 616 | 6,22 | ||||
| 2026-02-17 | 13F | SummitTX Capital, L.P. | 685 874 | −26,18 | 8 937 | −11,44 | ||||
| 2026-02-09 | 13F | Hartland & Co., LLC | 700 | 9 | ||||||
| 2026-02-05 | 13F | Cornerstone Wealth Management, LLC | 16 849 | 0,00 | 220 | 20,33 | ||||
| 2026-02-10 | 13F | IFG Advisory, LLC | 34 221 | 446 | ||||||
| 2026-01-27 | 13F | WealthCollab, LLC | 364 | 0,00 | 5 | 33,33 | ||||
| 2026-01-16 | 13F | Ronald Blue Trust, Inc. | 15 182 | −5,89 | 198 | 12,57 | ||||
| 2026-02-13 | 13F | American Century Companies Inc | 5 901 094 | 13,84 | 76 891 | 36,59 | ||||
| 2026-02-17 | 13F | Liontrust Investment Partners LLP | 160 000 | 220,00 | 2 085 | 283,79 | ||||
| 2026-02-17 | 13F | Quantinno Capital Management LP | 230 757 | 73,74 | 3 007 | 108,46 | ||||
| 2026-02-11 | 13F | Capital International Ltd /ca/ | 280 267 | −4,85 | 3 652 | 14,17 | ||||
| 2025-11-14 | 13F | Cubist Systematic Strategies, LLC | Call | 522 700 | −1,91 | 5 677 | 9,70 | |||
| 2025-11-14 | 13F | Cubist Systematic Strategies, LLC | Put | 438 900 | 10,03 | 4 766 | 23,06 | |||
| 2026-02-17 | 13F | Advisory Services Network, LLC | 39 636 | 17,41 | 516 | 40,98 | ||||
| 2025-11-12 | 13F | Laffer Investments | 0 | −100,00 | 0 | −100,00 | ||||
| 2026-02-04 | 13F | HighPoint Advisor Group LLC | 25 980 | −10,76 | 339 | 6,96 | ||||
| 2025-11-14 | 13F | Dauntless Investment Group, LLC | 0 | −100,00 | 0 | −100,00 | ||||
| 2026-02-09 | 13F | Fisher Asset Management, LLC | 21 597 376 | −0,67 | 281 414 | 19,18 | ||||
| 2026-01-21 | 13F | Crews Bank & Trust | 0 | −100,00 | 0 | |||||
| 2025-09-25 | NP | DFAE - Dimensional Emerging Core Equity Market ETF | 1 651 800 | 5,43 | 15 742 | 7,92 | ||||
| 2026-01-30 | 13F | Us Bancorp \de\ | 46 940 | −68,48 | 612 | −62,21 | ||||
| 2026-02-12 | 13F | Summit Financial, LLC | 88 721 | −2,65 | 1 249 | 26,19 | ||||
| 2026-02-17 | 13F | Alliancebernstein L.p. | 159 317 | 101,26 | 2 076 | 141,56 | ||||
| 2026-02-03 | 13F | NewEdge Wealth, LLC | 25 091 | 18,66 | 327 | 25,38 | ||||
| 2026-02-09 | 13F | Legal & General Group Plc | 1 694 | 0,00 | 22 | 22,22 | ||||
| 2026-02-17 | 13F | Snowden Capital Advisors LLC | 29 711 | 51,58 | 392 | 84,43 | ||||
| 2026-02-03 | 13F | Strengthening Families & Communities, LLC | 0 | −100,00 | 0 | |||||
| 2026-02-12 | 13F | Quadrant Capital Group Llc | 66 870 | 1,29 | 871 | 21,65 | ||||
| 2025-09-26 | NP | RAZAX - Multi-Asset Growth Strategy Fund Class A | 0 | −100,00 | 0 | −100,00 | ||||
| 2026-02-12 | 13F/A | Pinebridge Investments Llc | 356 252 | 4 642 | ||||||
| 2025-11-14 | 13F | PineBridge Investments, L.P. | 238 098 | −8,17 | 2 586 | 2,70 | ||||
| 2026-02-17 | 13F | Driehaus Capital Management Llc | 5 780 150 | −29,39 | 75 315 | −15,29 | ||||
| 2026-02-11 | 13F | Capital Group Investment Management Pte. Ltd. | 68 030 | −9,49 | 886 | 8,58 | ||||
| 2026-01-23 | 13F | Robeco Institutional Asset Management B.V. | 20 809 302 | 77,77 | 271 145 | 113,30 | ||||
| 2026-02-17 | 13F | Hartree Partners, LP | 30 000 | 391 | ||||||
| 2025-10-29 | 13F | J.Safra Asset Management Corp | 0 | −100,00 | 0 | −100,00 | ||||
| 2026-02-13 | 13F | Virtus ETF Advisers LLC | 28 456 | 371 | ||||||
| 2026-01-29 | 13F | Nbc Securities, Inc. | 0 | −100,00 | 0 | |||||
| 2025-11-14 | 13F | Sompo Japan Nipponkoa Asset Management Co.,ltd. | 0 | −100,00 | 0 | |||||
| 2025-09-26 | NP | John Hancock Tax-advantaged Dividend Income Fund | 600 000 | 0,00 | 5 718 | 2,36 | ||||
| 2026-02-17 | 13F | Mirabella Financial Services Llp | 181 158 | 2 360 | ||||||
| 2025-10-07 | 13F | Proathlete Wealth Management Llc | 0 | −100,00 | 0 | |||||
| 2026-01-27 | 13F | TD Waterhouse Canada Inc. | 57 020 | 2 326,38 | 742 | 2 868,00 | ||||
| 2026-02-17 | 13F | Qube Research & Technologies Ltd | Put | 18 400 | 0,00 | 240 | 20,10 | |||
| 2026-02-17 | 13F | Old Mission Capital Llc | 30 703 | 400 | ||||||
| 2026-02-13 | 13F | Eschler Asset Management LLP | 35 000 | 456 | ||||||
| 2026-02-13 | 13F | GQG Partners LLC | 65 132 572 | 42,41 | 848 677 | 70,87 | ||||
| 2026-02-17 | 13F | Qube Research & Technologies Ltd | Call | 116 000 | −27,55 | 1 511 | −13,06 | |||
| 2026-02-17 | 13F | Fmr Llc | 54 962 420 | −0,47 | 716 160 | 19,42 | ||||
| 2025-09-25 | NP | ADAVX - Aberdeen Dynamic Dividend Fund Class A | 0 | −100,00 | 0 | −100,00 | ||||
| 2026-02-12 | 13F | Insigneo Advisory Services, Llc | 112 326 | −12,91 | 1 464 | 4,50 | ||||
| 2026-02-11 | 13F | Fox Run Management, L.l.c. | 53 664 | −32,45 | 699 | −18,91 | ||||
| 2026-02-03 | 13F | Sequoia Financial Advisors, LLC | 41 921 | 46,17 | 546 | 75,56 | ||||
| 2026-01-27 | 13F | Zurcher Kantonalbank (Zurich Cantonalbank) | 114 855 | 339,69 | 1 497 | 428,62 | ||||
| 2026-02-24 | 13F | Bell Investment Advisors, Inc | 422 | 0,00 | 5 | 25,00 | ||||
| 2025-09-26 | NP | UUPIX - Ultraemerging Markets Profund Investor Class | 17 503 | 18,71 | 167 | 21,17 | ||||
| 2026-01-27 | 13F | Belpointe Asset Management LLC | 69 513 | 906 | ||||||
| 2026-01-23 | 13F | Ritholtz Wealth Management | 407 634 | 10,61 | 5 311 | 32,71 | ||||
| 2026-02-11 | 13F | CenterBook Partners LP | 108 732 | 30,34 | 1 417 | 56,46 | ||||
| 2026-02-11 | 13F | RWC Asset Management LLP | 2 500 707 | 28,15 | 32 584 | 53,76 | ||||
| 2025-11-06 | 13F | Midwest Trust Co | 0 | −100,00 | 0 | |||||
| 2026-02-03 | 13F | International Assets Investment Management, Llc | 12 888 | −17,48 | 168 | 9,15 | ||||
| 2026-01-21 | 13F | Yousif Capital Management, Llc | 40 389 | 0,00 | 603 | 37,67 | ||||
| 2026-02-17 | 13F | SIH Partners, LLLP | 0 | −100,00 | 0 | |||||
| 2026-01-21 | 13F | Naviter Wealth, LLC | 47 670 | −7,52 | 632 | 12,88 | ||||
| 2026-02-06 | 13F | Leonteq Securities AG | 463 376 | 11,09 | 6 038 | 33,30 | ||||
| 2026-02-17 | 13F | Raymond James Financial Inc | 1 994 495 | 22,25 | 25 988 | 46,68 | ||||
| 2025-09-26 | NP | FHKFX - Fidelity Series Emerging Markets Fund This fund is a listed as child fund of Fmr Llc and if that institution has disclosed ownership in this security, then these positions will not be double counted when calculating total shares and total value | 2 891 207 | −54,59 | 27 553 | −53,52 | ||||
| 2026-02-11 | 13F | J.w. Cole Advisors, Inc. | 10 969 | 1,12 | 106 | −10,26 | ||||
| 2026-01-21 | 13F | Kawa Capital Management, Inc | 520 000 | −49,02 | 7 051 | −36,35 | ||||
| 2025-11-12 | 13F | Contrarius Group Holdings Ltd | 0 | −100,00 | 0 | |||||
| 2026-01-27 | 13F | Bayforest Capital Ltd | 114 | 1 | ||||||
| 2026-02-17 | 13F | Wiley Bros.-aintree Capital, Llc | 23 206 | 13,14 | 302 | 36,04 | ||||
| 2026-01-09 | 13F | Assenagon Asset Management S.A. | 102 362 | −94,64 | 1 334 | −93,58 | ||||
| 2026-02-13 | 13F | SPX Equities Gestao de Recursos Ltda | 395 018 | −96,43 | 5 147 | −95,72 | ||||
| 2026-02-17 | 13F | Nomura Holdings Inc | Call | 3 274 800 | 0,00 | 42 671 | 19,98 | |||
| 2026-02-17 | 13F | Nomura Holdings Inc | Put | 120 000 | 0,00 | 1 564 | 19,95 | |||
| 2026-02-13 | 13F | Financial Sense Advisors, Inc. | Call | 0 | −100,00 | 0 | −100,00 | |||
| 2025-09-25 | NP | PGNAX - PGIM Jennison Natural Resources Fund Class A | 872 825 | 20,16 | 8 318 | 23,01 | ||||
| 2025-11-04 | 13F | Syntax Research, Inc. | 0 | −100,00 | 0 | −100,00 | ||||
| 2026-02-12 | 13F | BRYN MAWR TRUST Co | 10 500 | 0,00 | 137 | 19,30 | ||||
| 2026-02-13 | 13F | Golden State Wealth Management, LLC | 0 | −100,00 | 0 | −100,00 | ||||
| 2025-11-04 | 13F | High Note Wealth, LLC | 0 | −100,00 | 0 | |||||
| 2026-02-17 | 13F | PharVision Advisers, LLC | 26 023 | 112,24 | 339 | 154,89 | ||||
| 2026-02-23 | 13F | Walser Wealth Management Company, A Ltd Liability Co | 21 456 | 280 | ||||||
| 2026-02-17 | 13F | Clear Street Markets Llc | 394 700 | 1 677,93 | 5 143 | 2 033,61 | ||||
| 2026-02-11 | 13F | Investors Towarzystwo Funduszy Inwestycyjnych Spolka Akcyjna | 2 055 | 27 | ||||||
| 2026-02-17 | 13F | Clear Street Markets Llc | Put | 309 000 | 4 026 | |||||
| 2026-02-12 | 13F | Advocate Investing Services LLC | 31 665 | 413 | ||||||
| 2025-11-14 | 13F | Wolverine Trading, Llc | 15 784 | 170 | ||||||
| 2025-11-14 | 13F | Wolverine Trading, Llc | Call | 157 800 | 1 696 | |||||
| 2025-11-14 | 13F | Wolverine Trading, Llc | Put | 568 100 | 6 107 | |||||
| 2025-09-26 | NP | UBPIX - Ultralatin America Profund Investor Class | 71 711 | 0,30 | 683 | 2,71 | ||||
| 2026-02-10 | 13F | Nomura Asset Management Co Ltd | 108 359 | 11,23 | 1 412 | 33,36 | ||||
| 2026-03-11 | 13F | Larry Mathis Financial Planning, LLC | 20 030 | 261 | ||||||
| 2025-09-25 | NP | CAIBX - CAPITAL INCOME BUILDER Class A | 6 898 935 | 0,00 | 65 747 | 2,36 | ||||
| 2026-01-30 | 13F | Jennison Associates Llc | 1 603 391 | 54,95 | 20 892 | 85,92 | ||||
| 2026-02-17 | 13F | Graham Capital Management, L.P. | 17 513 | −53,99 | 228 | −44,79 | ||||
| 2026-02-06 | 13F | HighTower Advisors, LLC | 388 889 | 8,96 | 5 067 | 30,76 | ||||
| 2026-01-12 | 13F | Foster Group, Inc. | 10 382 | 135 | ||||||
| 2026-02-06 | 13F | EverSource Wealth Advisors, LLC | 9 167 | −4,58 | 119 | 14,42 | ||||
| 2026-02-06 | 13F | IFP Advisors, Inc | 1 251 | −74,73 | 16 | −69,81 | ||||
| 2026-02-17 | 13F | LaSalle St. Investment Advisors, LLC | 78 620 | 41,58 | 1 | |||||
| 2026-02-17 | 13F | Shay Capital LLC | Call | 0 | −100,00 | 0 | −100,00 | |||
| 2026-02-12 | 13F | Steward Partners Investment Advisory, Llc | 21 997 | 18,28 | 287 | 42,29 | ||||
| 2025-11-14 | 13F | Strategic Wealth Partners, Ltd. | 314 | −98,00 | 3 | −98,03 | ||||
| 2025-11-13 | 13F | Eisler Capital Management Ltd. | Put | 800 000 | 0,00 | 8 616 | 11,03 | |||
| 2025-11-13 | 13F | Eisler Capital Management Ltd. | Call | 600 000 | 0,00 | 6 462 | 11,03 | |||
| 2026-02-13 | 13F | State Street Corp | 10 598 523 | −2,43 | 140 690 | 19,26 | ||||
| 2026-02-13 | 13F | Financial Sense Advisors, Inc. | 397 116 | 205,59 | 5 174 | 266,69 | ||||
| 2025-10-31 | 13F | Whittier Trust Co Of Nevada Inc | 0 | −100,00 | 0 | −100,00 | ||||
| 2025-11-14 | 13F | American Trust Investment Advisors, LLC | 0 | −100,00 | 0 | |||||
| 2025-09-26 | NP | John Hancock Premium Dividend Fund | 480 000 | 0,00 | 4 574 | 2,37 | ||||
| 2026-02-17 | 13F | Optiver Holding B.V. | Put | 10 374 400 | −5,83 | 135 178 | 12,99 | |||
| 2026-02-17 | 13F | Dynamo Internacional Gestao De Recursos Ltda. | 0 | −100,00 | 0 | |||||
| 2026-02-17 | 13F | Optiver Holding B.V. | 2 387 454 | 31 109 | ||||||
| 2026-02-11 | 13F | Capital International Inc /ca/ | 180 335 | −69,69 | 2 350 | −63,64 | ||||
| 2026-02-03 | 13F | Crossmark Global Holdings, Inc. | 127 601 | 0,23 | 1 663 | 20,26 | ||||
| 2026-01-21 | 13F | First United Bank Trust/ | 0 | −100,00 | 0 | |||||
| 2026-01-27 | 13F | Fortis Capital Advisors, LLC | 69 513 | 906 | ||||||
| 2026-02-13 | 13F | Clear Street Group Inc. | 31 581 | 412 | ||||||
| 2026-02-17 | 13F | Rexford Capital Inc | 12 612 | 0,00 | 164 | 20,59 | ||||
| 2026-02-02 | 13F | Strs Ohio | 9 967 | −14,87 | 130 | 1,57 | ||||
| 2026-02-13 | 13F | Gen-Wealth Partners Inc | 300 | −80,00 | 4 | −81,25 | ||||
| 2025-09-26 | NP | FDCAX - Fidelity Capital Appreciation Fund This fund is a listed as child fund of Fmr Llc and if that institution has disclosed ownership in this security, then these positions will not be double counted when calculating total shares and total value | 0 | −100,00 | 0 | −100,00 | ||||
| 2026-02-17 | 13F | Nomura Holdings Inc | 0 | −100,00 | 0 | |||||
| 2026-02-11 | 13F | X-Square Capital, LLC | 158 535 | −1,26 | 2 | 100,00 | ||||
| 2026-02-13 | 13F | Wells Fargo & Company/mn | 2 362 919 | 31,02 | 30 789 | 57,20 | ||||
| 2026-02-17 | 13F | Trexquant Investment LP | 2 306 104 | 638,96 | 30 049 | 786,63 | ||||
| 2026-02-13 | 13F | Motiv8 Investments LLC | 139 | 0 | ||||||
| 2026-02-12 | 13F | BlackRock, Inc. | 70 171 344 | 10,05 | 914 333 | 32,04 | ||||
| 2025-09-26 | NP | RMYAX - Multi-Strategy Income Fund Class A | 7 561 | 2,70 | 72 | 5,88 | ||||
| 2026-02-17 | 13F | Himension Fund | 918 117 | 463,51 | 11 963 | 576,26 | ||||
| 2026-02-13 | 13F | Gould Asset Management Llc /ca/ | 22 410 | 0,00 | 292 | 20,16 | ||||
| 2026-02-17 | 13F | Massar Capital Management, LP | 40 000 | 0,00 | 521 | 20,05 | ||||
| 2026-02-13 | 13F | Cohen & Steers, Inc. | 280 946 | −39,76 | 4 | −40,00 | ||||
| 2026-02-03 | 13F | Manning & Napier Advisors Llc | 315 414 | −3,39 | 4 132 | 16,53 | ||||
| 2026-02-17 | 13F | FIL Ltd | 31 025 | 0,00 | 404 | 20,24 | ||||
| 2026-01-27 | 13F | Waterfront Wealth Inc. | 78 951 | 1,61 | 1 275 | 42,62 | ||||
| 2026-02-17 | 13F | Quadrature Capital Ltd | 1 063 995 | 73,13 | 13 864 | 107,62 | ||||
| 2026-02-02 | 13F | Davis Selected Advisers | 2 931 198 | 0,00 | 38 194 | 19,98 | ||||
| 2026-02-20 | 13F | Larch Capital Partners Llc | 1 374 389 | 18 229 | ||||||
| 2026-02-11 | 13F | Stirlingshire Investments, Inc. | 15 939 | 218 | ||||||
| 2026-02-17 | 13F | Murchinson Ltd. | 0 | −100,00 | 0 | |||||
| 2026-02-17 | 13F | Guggenheim Capital Llc | 117 544 | 13,93 | 1 532 | 36,70 | ||||
| 2026-02-13 | 13F | Morgan Stanley | 12 563 174 | −12,10 | 163 698 | 5,47 | ||||
| 2026-02-10 | 13F | NS Partners Ltd | 702 500 | −13,79 | 9 154 | 3,44 | ||||
| 2026-01-13 | 13F | Kathmere Capital Management, LLC | 135 416 | 14,12 | 1 764 | 36,96 | ||||
| 2026-02-13 | 13F | JustInvest LLC | 46 836 | 7,24 | 610 | 28,69 | ||||
| 2026-02-12 | 13F | Qtron Investments LLC | 0 | −100,00 | 0 | |||||
| 2026-02-06 | 13F | Radnor Capital Management, LLC | 36 484 | −0,41 | 475 | 19,65 | ||||
| 2026-02-11 | 13F | LPL Financial LLC | 1 019 350 | 10,66 | 13 282 | 32,78 | ||||
| 2026-02-13 | 13F | Recurrent Investment Advisors LLC | 187 430 | 43,73 | 2 442 | 72,46 | ||||
| 2026-01-26 | 13F | Pursuit Wealth Management LLC | 56 658 | 738 | ||||||
| 2026-02-17 | 13F | Masters Capital Management Llc | 0 | −100,00 | 0 | |||||
| 2026-02-10 | 13F | Root Financial Partners, LLC | 18 | 0,00 | 0 | |||||
| 2025-10-08 | 13F/A | New York State Common Retirement Fund | 0 | −100,00 | 0 | −100,00 | ||||
| 2026-02-12 | 13F | Renaissance Technologies Llc | 11 040 637 | 50,06 | 143 860 | 80,04 | ||||
| 2026-02-10 | 13F | Texas Yale Capital Corp. | 12 900 | 24,04 | 168 | 50,00 | ||||
| 2026-01-21 | 13F | Aaron Wealth Advisors LLC | 21 429 | 279 | ||||||
| 2026-02-13 | 13F | Bridgewater Associates, LP | 6 024 497 | −17,92 | 78 499 | −1,52 | ||||
| 2026-02-17 | 13F | Mpwm Advisory Solutions, Llc | 173 | 0,00 | 2 | 100,00 | ||||
| 2026-02-17 | 13F | Lazard Asset Management Llc | 22 480 635 | 0,93 | 292 923 | 21,10 | ||||
| 2025-10-31 | 13F | Whittier Trust Co | 0 | −100,00 | 0 | −100,00 | ||||
| 2026-02-13 | 13F | Inspire Advisors, LLC | 20 025 | −5,70 | 261 | 13,04 | ||||
| 2026-02-11 | 13F | Parallel Advisors, LLC | 17 252 | −0,56 | 225 | 19,15 | ||||
| 2026-02-17 | 13F | Captrust Financial Advisors | 29 086 | 44,84 | 379 | 73,39 | ||||
| 2026-02-12 | 13F | CoreCommodity Management, LLC | 22 903 | 0,00 | 298 | 20,16 | ||||
| 2026-02-17 | 13F | Moore Capital Management, Lp | 271 000 | 3 531 | ||||||
| 2026-01-20 | 13F | AdvisorNet Financial, Inc | 19 632 | 0,00 | 256 | 19,72 | ||||
| 2025-10-17 | 13F | Retireful, LLC | 0 | −100,00 | 0 | |||||
| 2026-02-17 | 13F | Integrated Advisors Network LLC | 0 | −100,00 | 0 | |||||
| 2026-01-08 | 13F | Wealth Enhancement Advisory Services, Llc | 41 004 | 5,71 | 581 | 35,75 | ||||
| 2026-01-12 | 13F | Moody National Bank Trust Division | 19 072 | −6,66 | 249 | 12,22 | ||||
| 2026-02-17 | 13F | Woodline Partners LP | 0 | −100,00 | 0 | −100,00 | ||||
| 2026-01-06 | 13F | Investors Research Corp | 5 500 | 0,00 | 72 | 20,34 | ||||
| 2025-09-23 | NP | GERIX - Goldman Sachs Emerging Markets Equity Insights Fund Institutional | 0 | −100,00 | 0 | −100,00 | ||||
| 2026-02-13 | 13F | Advyzon Investment Management, LLC | 15 887 | 207 | ||||||
| 2025-09-25 | NP | EEMGX - MFS Emerging Markets Equity Research Fund R4 | 5 667 | 16,82 | 54 | 20,00 | ||||
| 2026-02-10 | 13F | Rothschild Investment Llc | 335 | 0,00 | 4 | 33,33 | ||||
| 2026-02-10 | 13F | Murphy & Mullick Capital Management Corp | 500 | 0,00 | 7 | 20,00 | ||||
| 2026-02-18 | 13F | GWM Advisors LLC | 85 751 | 89,10 | 1 117 | 127,03 | ||||
| 2025-11-07 | 13F | Wealth Alliance | 0 | −100,00 | 0 | |||||
| 2026-02-17 | 13F | Ameriprise Financial Inc | 148 438 | −87,14 | 1 957 | −84,40 | ||||
| 2026-02-09 | 13F | Bleakley Financial Group, LLC | 22 984 | 6,70 | 299 | 28,33 | ||||
| 2026-02-17 | 13F | Greenline Partners, LLC | 661 200 | 96,67 | 8 615 | 135,96 | ||||
| 2026-01-23 | 13F | Sumitomo Mitsui Trust Holdings, Inc. | 199 605 | −2,79 | 2 601 | 16,64 | ||||
| 2026-02-13 | 13F | BNB Wealth Management, LLC | 10 000 | 130 | ||||||
| 2025-09-26 | NP | FBCGX - Fidelity Blue Chip Growth K6 Fund This fund is a listed as child fund of Fmr Llc and if that institution has disclosed ownership in this security, then these positions will not be double counted when calculating total shares and total value | 0 | −100,00 | 0 | −100,00 | ||||
| 2026-02-05 | 13F | Thrivent Financial For Lutherans | 378 799 | −27,99 | 5 | −20,00 | ||||
| 2026-01-21 | 13F | Rathbone Brothers plc | 0 | −100,00 | 0 | |||||
| 2026-02-06 | 13F | Cadence Wealth Management LLC | 43 644 | 0,43 | 569 | 20,59 | ||||
| 2026-02-12 | 13F | Ankerstar Wealth, LLC | 9 | 0 | ||||||
| 2026-02-06 | 13F | Profund Advisors Llc | 178 021 | 10,53 | 2 320 | 32,59 | ||||
| 2025-10-30 | 13F | Ridgewood Investments LLC | 92 611 | 51,88 | 684 | 15,37 | ||||
| 2026-01-08 | 13F | Traveka Wealth, LLC | 14 630 | 191 | ||||||
| 2026-01-29 | 13F | D.a. Davidson & Co. | 185 917 | −15,91 | 2 423 | 0,92 | ||||
| 2026-02-11 | 13F | TCTC Holdings, LLC | 560 | 0,00 | 7 | 16,67 | ||||
| 2026-02-09 | 13F | Atlantic Trust, LLC | 415 | 5 | ||||||
| 2026-02-13 | 13F | Knollwood Investment Advisory, LLC | 50 000 | 0,00 | 652 | 19,89 | ||||
| 2026-02-18 | 13F | Mackenzie Financial Corp | 1 338 132 | 15,47 | 17 495 | 39,01 | ||||
| 2026-02-06 | 13F | Signature Estate & Investment Advisors Llc | 10 496 | 0,00 | 137 | 20,35 | ||||
| 2026-02-09 | 13F | Genus Capital Management Inc. | 13 833 | −16,03 | 180 | 1,12 | ||||
| 2026-02-12 | 13F | Integrated Quantitative Investments LLC | 0 | −100,00 | 0 | |||||
| 2026-02-12 | 13F | Skopos Labs, Inc. | 221 075 | 359,88 | 2 856 | 510,26 | ||||
| 2026-01-15 | 13F | Highline Wealth Partners Llc | 1 699 | 83,28 | 22 | 120,00 | ||||
| 2025-11-12 | 13F | Transce3nd, LLC | 0 | −100,00 | 0 | −100,00 | ||||
| 2026-02-05 | 13F | May Hill Capital, LLC | 30 424 | 137,71 | 396 | 186,96 | ||||
| 2026-02-17 | 13F | Boreal Capital Management LLC | 560 | 0,00 | 7 | 16,67 | ||||
| 2026-02-13 | 13F | PCM Encore, LLC | 19 272 | 251 | ||||||
| 2026-02-17 | 13F | Cetera Investment Advisers | 207 502 | −6,28 | 2 704 | 12,44 | ||||
| 2026-01-20 | 13F | Lazari Capital Management, Inc. | 0 | −100,00 | 0 | |||||
| 2026-01-22 | 13F | Comprehensive Money Management Services LLC | 28 082 | −2,43 | 366 | 16,99 | ||||
| 2026-02-02 | 13F | CENTRAL TRUST Co | 1 500 | 0,00 | 20 | 18,75 | ||||
| 2025-09-26 | NP | FSGEX - Fidelity Series Global ex U.S. Index Fund This fund is a listed as child fund of Fmr Llc and if that institution has disclosed ownership in this security, then these positions will not be double counted when calculating total shares and total value | 34 124 | 0,00 | 325 | 2,52 | ||||
| 2025-09-25 | NP | DFAX - Dimensional World ex U.S. Core Equity 2 ETF | 239 247 | 10,58 | 2 280 | 13,21 | ||||
| 2026-01-29 | 13F | UMA Financial Services, Inc. | 589 | 0,00 | 8 | 16,67 | ||||
| 2026-02-13 | 13F | Caitong International Asset Management Co., Ltd | 0 | −100,00 | 0 | |||||
| 2026-02-17 | 13F | Bank Of America Corp /de/ | 9 932 169 | −41,44 | 129 416 | −29,74 | ||||
| 2026-02-17 | 13F | Jump Financial, LLC | 393 230 | −71,01 | 5 124 | −65,22 | ||||
| 2026-02-11 | 13F | Longfellow Investment Management Co Llc | 239 430 | −13,28 | 3 120 | 4,04 | ||||
| 2025-09-25 | NP | GBLAX - AMERICAN FUNDS GLOBAL BALANCED FUND Class A This fund is a listed as child fund of Capital World Investors and if that institution has disclosed ownership in this security, then these positions will not be double counted when calculating total shares and total value | 3 691 051 | 0,00 | 35 176 | 2,36 | ||||
| 2026-02-13 | 13F | Cloverfields Capital Group, Lp | 66 062 | −70,91 | 861 | −65,13 | ||||
| 2025-11-04 | 13F | Independent Advisor Alliance | 0 | −100,00 | 0 | −100,00 | ||||
| 2026-02-13 | 13F | Toroso Investments, LLC | 376 781 | 16,30 | 4 909 | 39,54 | ||||
| 2026-02-06 | 13F | New Millennium Group LLC | 12 937 | 169 | ||||||
| 2026-02-17 | 13F | Sig Brokerage, Lp | Put | 15 000 | 0,00 | 195 | 20,37 | |||
| 2025-09-26 | NP | FTCEX - Fidelity Total International Equity Fund Fidelity Advisor Total International Equity Fund: Class C This fund is a listed as child fund of Fmr Llc and if that institution has disclosed ownership in this security, then these positions will not be double counted when calculating total shares and total value | 175 668 | −22,30 | 1 674 | −20,44 | ||||
| 2026-02-04 | 13F | Tls Advisors Llc | 99 393 | 3,19 | 1 | 0,00 | ||||
| 2026-02-05 | 13F | Baader Bank INC | 40 421 | 304,21 | 525 | 385,19 | ||||
| 2026-02-13 | 13F | Centiva Capital, LP | 207 349 | 434,05 | 2 702 | 541,57 | ||||
| 2026-02-13 | 13F | Centiva Capital, LP | Put | 1 500 000 | 19 545 | |||||
| 2026-02-17 | 13F | Equitable Holdings, Inc. | 69 908 | 0,59 | 911 | 20,69 | ||||
| 2026-02-17 | 13F | Man Group plc | 5 629 183 | 36,10 | 73 348 | 63,30 | ||||
| 2026-01-06 | 13F | Tucker Asset Management Llc | 0 | −100,00 | 0 | |||||
| 2026-02-17 | 13F | CWM Advisors, LLC | 7 530 | 98 | ||||||
| 2026-02-02 | 13F | Horizon Investments, LLC | 0 | −100,00 | 0 | |||||
| 2026-02-11 | 13F | Capital International Sarl | 659 103 | 4,14 | 8 588 | 24,95 | ||||
| 2026-02-12 | 13F | Principal Securities, Inc. | 0 | −100,00 | 0 | |||||
| 2026-01-26 | 13F | Patriot Financial Group Insurance Agency, LLC | 0 | −100,00 | 0 | |||||
| 2026-02-11 | 13F | Allianz Asset Management GmbH | 1 774 300 | 8 771,50 | 23 119 | 10 553,92 | ||||
| 2026-02-11 | 13F | Letko, Brosseau & Associates Inc | 36 650 | 0,00 | 478 | 19,85 | ||||
| 2026-02-10 | 13F | State of Wyoming | 16 120 | 17,49 | 210 | 41,89 | ||||
| 2026-02-06 | 13F | Global Retirement Partners, LLC | 0 | −100,00 | 0 | |||||
| 2026-02-13 | 13F | Y-Intercept (Hong Kong) Ltd | 948 087 | −43,35 | 12 354 | −32,03 | ||||
| 2026-02-17 | 13F | Agf Management Ltd | 18 293 | −3,36 | 238 | 16,10 | ||||
| 2026-02-06 | 13F | Cedar Wealth Management, LLC | 100 | 0,00 | 1 | 0,00 | ||||
| 2025-09-25 | NP | ROAM - Hartford Multifactor Emerging Markets ETF | 23 377 | 24,06 | 223 | 18,09 | ||||
| 2025-09-26 | NP | FBGRX - Fidelity Blue Chip Growth Fund This fund is a listed as child fund of Fmr Llc and if that institution has disclosed ownership in this security, then these positions will not be double counted when calculating total shares and total value | 0 | −100,00 | 0 | −100,00 | ||||
| 2026-02-13 | 13F | Journey Strategic Wealth Llc | 23 816 | 26,65 | 310 | 51,96 | ||||
| 2025-11-13 | 13F | Glenmede Investment Management, LP | 0 | −100,00 | 0 | −100,00 | ||||
| 2026-02-17 | 13F | Brevan Howard Capital Management LP | 0 | −100,00 | 0 | −100,00 | ||||
| 2026-02-13 | 13F | Integrated Wealth Concepts LLC | 57 621 | −9,71 | 751 | 8,23 | ||||
| 2026-02-13 | 13F | Kiltearn Partners LLP | 1 157 336 | −17,03 | 15 080 | −0,46 | ||||
| 2025-09-24 | NP | DAEMX - Dunham Emerging Markets Stock Fund Class A | 60 800 | 579 | ||||||
| 2026-02-13 | 13F | Neuberger Berman Group LLC | 148 004 | 32,65 | 1 928 | 59,21 | ||||
| 2026-02-11 | 13F | Capital Research Global Investors | 8 173 426 | 0,38 | 106 500 | 20,44 | ||||
| 2026-02-10 | 13F | Avestar Capital, LLC | Call | 2 000 | 0,00 | 26 | 23,81 | |||
| 2026-02-10 | 13F | Avestar Capital, LLC | 11 818 | −10,15 | 154 | 7,75 | ||||
| 2026-01-21 | 13F | Sowell Financial Services LLC | 15 696 | −14,52 | 205 | 2,51 | ||||
| 2026-02-17 | 13F | Cape Investment Advisory, Inc. | 670 | 89,80 | 9 | 166,67 | ||||
| 2026-02-05 | 13F | Pacific Heights Asset Management Llc | 500 000 | 0,00 | 6 515 | 19,98 | ||||
| 2026-02-04 | 13F | Pensionmark Financial Group, Llc | 33 546 | 115,16 | 222 | 31,36 | ||||
| 2026-02-09 | 13F | Geode Capital Management, Llc | 12 597 | −70,15 | 164 | −64,19 | ||||
| 2026-02-06 | 13F | Lsv Asset Management | 46 822 | 0,00 | 1 | |||||
| 2026-02-09 | 13F | Cary Street Partners Financial Llc | 9 499 | 0,00 | 124 | 19,42 | ||||
| 2026-02-10 | 13F | Foundations Investment Advisors, LLC | 1 264 002 | 16 470 | ||||||
| 2026-02-20 | 13F | Sunbelt Securities, Inc. | 250 | 0,00 | 3 | 50,00 | ||||
| 2026-02-13 | 13F | Bridgefront Capital, LLC | 0 | −100,00 | 0 | |||||
| 2025-09-29 | NP | TIIV - AAM Todd International Intrinsic Value ETF | 9 772 | 93 | ||||||
| 2026-02-06 | 13F | Creative Financial Designs Inc /adv | 1 225 | 0,00 | 16 | 15,38 | ||||
| 2026-02-17 | 13F | Moore Capital Management, Lp | Call | 0 | −100,00 | 0 | ||||
| 2026-02-05 | 13F | Cambridge Investment Research Advisors, Inc. | 465 441 | −5,20 | 6 | 20,00 | ||||
| 2026-02-20 | 13F/A | CMT Capital Markets Trading GmbH | 52 062 | −83,41 | 1 | −100,00 | ||||
| 2025-11-12 | 13F | NewSquare Capital LLC | 0 | −100,00 | 0 | |||||
| 2025-12-16 | 13F | Garde Capital, Inc. | 0 | −100,00 | 0 | |||||
| 2026-01-21 | 13F | Sound Income Strategies, LLC | 265 | 0,00 | 4 | 50,00 | ||||
| 2025-11-14 | 13F | AXA Investment Managers S.A. | 2 240 | 24 | ||||||
| 2026-01-26 | 13F | Mirae Asset Global Investments Co., Ltd. | 359 114 | 2,89 | 4 679 | 23,46 | ||||
| 2026-01-05 | 13F | Confluence Investment Management Llc | 0 | −100,00 | 0 | |||||
| 2026-02-13 | 13F | VPR Management LLC | 122 010 | 0,00 | 1 590 | 19,92 | ||||
| 2026-02-13 | 13F | Absolute Gestao de Investimentos Ltda. | 0 | −100,00 | 0 | |||||
| 2026-02-17 | 13F | Capital Fund Management S.a. | Call | 889 400 | −69,27 | 11 589 | −63,13 | |||
| 2026-02-11 | 13F | Franklin Resources Inc | 972 681 | 2,80 | 12 674 | 23,35 | ||||
| 2026-02-17 | 13F | Capital Fund Management S.a. | Put | 1 023 000 | −4,21 | 13 330 | 14,92 | |||
| 2026-01-14 | 13F | Redhawk Wealth Advisors, Inc. | 38 929 | 75,17 | 507 | 110,37 | ||||
| 2026-02-11 | 13F | Nikko Asset Management Americas, Inc. | 184 005 | 2 396 | ||||||
| 2026-02-12 | 13F | Marex Group plc | Call | 110 000 | 0,00 | 1 433 | 20,02 | |||
| 2025-11-14 | 13F | Axa S.a. | 0 | −100,00 | 0 | |||||
| 2026-01-08 | 13F | Grove Bank & Trust | 250 | 0,00 | 3 | 50,00 | ||||
| 2026-01-22 | 13F | Massachusetts Financial Services Co /ma/ | 8 488 758 | −11,49 | 110 609 | 6,19 | ||||
| 2026-02-10 | 13F | Savant Capital, LLC | 59 643 | 22,82 | 777 | 47,44 | ||||
| 2026-02-11 | 13F | Flagship Wealth Advisors, Llc | 47 | 0,00 | 1 | |||||
| 2025-11-13 | 13F | Crescent Grove Advisors, LLC | 0 | −100,00 | 0 | −100,00 | ||||
| 2026-01-16 | 13F | Standard Life Aberdeen plc | 2 838 991 | 2,41 | 36 992 | 24,31 | ||||
| 2026-01-27 | 13F | Genoa Capital Gestora de Recursos Ltda. | 0 | −100,00 | 0 | |||||
| 2026-02-10 | 13F | KERR FINANCIAL PLANNING Corp | 1 500 | 0,00 | 25 | 33,33 | ||||
| 2026-02-10 | 13F | Quantbot Technologies LP | 51 758 | −51,81 | 674 | −42,20 | ||||
| 2026-01-30 | 13F | State of New Jersey Common Pension Fund D | 478 398 | 0,00 | 6 234 | 19,98 | ||||
| 2026-02-17 | 13F | Jain Global LLC | 304 950 | 3 973 | ||||||
| 2026-01-13 | 13F | Mather Group, Llc. | 0 | −100,00 | 0 | |||||
| 2025-11-24 | 13F/A | Fulcrum Asset Management LLP | Put | 0 | −100,00 | 0 | −100,00 | |||
| 2026-02-10 | 13F | Bank of New York Mellon Corp | 70 982 | 17,58 | 925 | 41,07 | ||||
| 2025-09-25 | NP | Clough Global Dividend & Income Fund | 56 300 | 0,00 | 537 | 2,29 | ||||
| 2026-02-17 | 13F | Laird Norton Trust Company, Llc | 58 048 | 770 | ||||||
| 2026-02-09 | 13F | Mondrian Investment Partners LTD | 11 419 957 | 0,40 | 148 802 | 20,46 | ||||
| 2025-09-29 | NP | MPEMX - MONDRIAN EMERGING MARKETS VALUE EQUITY FUND | 36 819 | −5,29 | 351 | −3,05 | ||||
| 2026-02-11 | 13F | Capital Group Private Client Services, Inc. | 20 963 | −20,90 | 273 | −4,88 | ||||
| 2026-02-10 | 13F | Bnp Paribas Arbitrage, Sa | 4 585 885 | 150,73 | 59 754 | 200,83 | ||||
| 2026-02-17 | 13F | Moneda S.A. Administradora General de Fondos | 269 619 | −16,19 | 3 512 | −9,70 | ||||
| 2026-02-10 | 13F | Bnp Paribas Arbitrage, Sa | Put | 30 164 | 114,39 | 39 304 | 157,22 | |||
| 2026-02-10 | 13F | Bnp Paribas Arbitrage, Sa | Call | 15 670 | 55,80 | 20 418 | 86,94 | |||
| 2025-09-25 | NP | TIER - T. Rowe Price International Equity Research ETF | 2 116 | 20 | ||||||
| 2025-09-26 | NP | BLACKROCK FUNDS - BlackRock Emerging Markets ex-China Fund Investor A This fund is a listed as child fund of BlackRock, Inc. and if that institution has disclosed ownership in this security, then these positions will not be double counted when calculating total shares and total value | 0 | −100,00 | 0 | −100,00 | ||||
| 2026-02-13 | 13F | Verition Fund Management LLC | 466 039 | −30,66 | 6 072 | −16,81 | ||||
| 2026-02-13 | 13F | Citigroup Inc | Call | 1 488 200 | −1,33 | 19 391 | 18,39 | |||
| 2025-09-26 | NP | FAMKX - Fidelity Advisor Emerging Markets Fund Class A This fund is a listed as child fund of Fmr Llc and if that institution has disclosed ownership in this security, then these positions will not be double counted when calculating total shares and total value | 8 965 320 | −30,83 | 85 439 | −29,19 | ||||
| 2026-02-13 | 13F | Citigroup Inc | Put | 2 148 500 | 53,46 | 27 995 | 84,12 | |||
| 2025-09-26 | NP | Global Macro Absolute Return Advantage Portfolio - Global Macro Absolute Return Advantage Portfolio | 1 312 000 | 11,62 | 12 503 | 14,27 | ||||
| 2026-02-06 | 13F | Verde Servicos Internacionais S.A. | 249 600 | 0,00 | 3 | 50,00 | ||||
| 2026-02-14 | 13F | Rockefeller Capital Management L.P. | 44 204 | −2,41 | 576 | 17,11 | ||||
| 2025-10-30 | 13F | Stock Yards Bank & Trust Co | 0 | −100,00 | 0 | |||||
| 2026-02-13 | 13F | Verition Fund Management LLC | Put | 58 200 | −90,08 | 758 | −88,10 | |||
| 2026-02-13 | 13F | Citigroup Inc | 827 966 | −19,54 | 10 788 | −3,45 | ||||
| 2026-02-17 | 13F | Credit Agricole S A | Call | 100 000 | −60,00 | 1 303 | −52,01 | |||
| 2026-02-17 | 13F | Credit Agricole S A | 2 884 | −96,74 | 38 | −96,15 | ||||
| 2026-01-29 | 13F | Sava Infond d.o.o. | 60 000 | 39,53 | 782 | 67,60 | ||||
| 2026-02-13 | 13F | Schroder Investment Management Group | 0 | −100,00 | 0 | |||||
| 2026-02-11 | 13F | O'shaughnessy Asset Management, Llc | 2 540 879 | 12,84 | 33 108 | 35,39 | ||||
| 2026-02-13 | 13F | Flow Traders U.s. Llc | 59 201 | 1 | ||||||
| 2026-01-28 | 13F | Geneos Wealth Management Inc. | 15 495 | −32,62 | 202 | −19,28 | ||||
| 2026-02-12 | 13F | Sprott Inc. | 75 084 | −25,33 | 978 | −10,44 | ||||
| 2026-01-16 | 13F | Surience Private Wealth Llc | 170 190 | 2 218 | ||||||
| 2026-02-20 | 13F/A | Capital Markets Trading UK LLP | 30 251 | −87,66 | 0 | −100,00 | ||||
| 2026-02-09 | 13F | Harbour Investments, Inc. | 2 436 | −22,96 | 32 | −8,82 | ||||
| 2026-01-23 | 13F | Rsm Us Wealth Management Llc | 17 689 | 6,58 | 232 | 28,33 | ||||
| 2026-02-10 | 13F | NINE MASTS CAPITAL Ltd | 16 277 | −96,51 | 756 | −95,29 | ||||
| 2026-02-10 | 13F | NINE MASTS CAPITAL Ltd | Put | 11 500 | −41,62 | 16 | −97,44 | |||
| 2026-01-22 | 13F | Accordant Advisory Group Inc | 36 | −92,80 | 0 | −100,00 | ||||
| 2025-10-27 | 13F | Bogart Wealth, LLC | 0 | −100,00 | 0 | |||||
| 2026-02-12 | 13F | Triumph Capital Management | 3 085 | −0,32 | 40 | 21,21 | ||||
| 2026-02-17 | 13F | Capital Fund Management S.a. | 1 754 916 | 173,80 | 22 867 | 228,53 | ||||
| 2025-11-06 | 13F | Whipplewood Advisors, LLC | 0 | −100,00 | 0 | |||||
| 2026-02-17 | 13F | Sig Brokerage, Lp | Call | 0 | −100,00 | 0 | −100,00 | |||
| 2026-02-12 | 13F | Callan Family Office, LLC | 55 364 | 108,99 | 721 | 151,22 | ||||
| 2026-02-12 | 13F | Federation des caisses Desjardins du Quebec | 38 247 | 21,79 | 498 | 46,04 | ||||
| 2026-02-17 | 13F | Price T Rowe Associates Inc /md/ | 1 485 036 | −6,15 | 19 | 11,76 | ||||
| 2026-02-10 | 13F | Monaco Asset Management SAM | 0 | −100,00 | 0 | |||||
| 2026-01-29 | 13F | Teachers Retirement System Of The State Of Kentucky | 4 072 400 | 51,96 | 53 | 82,76 | ||||
| 2026-02-10 | 13F | Connor, Clark & Lunn Investment Management Ltd. | 17 937 883 | 36,12 | 233 731 | 63,32 | ||||
| 2026-02-12 | 13F | Tocqueville Asset Management L.p. | 80 614 | 1 050 | ||||||
| 2026-02-13 | 13F | Verition Fund Management LLC | Call | 0 | −100,00 | 0 | −100,00 | |||
| 2026-02-10 | 13F | Natixis Advisors, L.p. | 469 790 | 11,71 | 6 | 50,00 | ||||
| 2026-02-17 | 13F | Sig Brokerage, Lp | 0 | −100,00 | 0 | −100,00 | ||||
| 2026-02-05 | 13F | Atria Investments Llc | 11 270 | −5,51 | 147 | 13,18 | ||||
| 2026-02-03 | 13F | Chesapeake Capital Corp /il/ | 72 358 | 0,90 | 943 | 21,08 | ||||
| 2026-02-12 | 13F | Cibc World Markets Corp | 0 | −100,00 | 0 | |||||
| 2025-11-13 | 13F | Riggs Asset Managment Co. Inc. | 0 | −100,00 | 0 | |||||
| 2025-11-13 | 13F | EntryPoint Capital, LLC | 0 | −100,00 | 0 | −100,00 | ||||
| 2025-10-21 | 13F | American National Bank | 0 | −100,00 | 0 | |||||
| 2025-11-13 | 13F | Diametric Capital, LP | 0 | −100,00 | 0 | |||||
| 2026-02-09 | 13F | Leavell Investment Management, Inc. | 11 215 | 149 | ||||||
| 2026-02-12 | 13F | Brown Brothers Harriman & Co | 1 442 | −83,95 | 19 | −83,49 | ||||
| 2026-02-23 | 13F | Vinland Capital Management Gestora de Recursos LTDA. | 50 000 | 652 | ||||||
| 2026-02-13 | 13F | Baird Financial Group, Inc. | 369 699 | 4 817 | ||||||
| 2025-09-25 | NP | Dfa Investment Trust Co - The Emerging Markets Series This fund is a listed as child fund of Dimensional Fund Advisors Lp and if that institution has disclosed ownership in this security, then these positions will not be double counted when calculating total shares and total value | 537 780 | 0,00 | 5 125 | 2,38 | ||||
| 2026-02-11 | 13F | Cerity Partners LLC | 38 514 | 31,78 | 502 | 58,04 | ||||
| 2026-01-13 | 13F | Fort Washington Investment Advisors Inc /oh/ | 24 923 | 29,25 | 325 | 55,02 | ||||
| 2026-02-12 | 13F | Hrt Financial Lp | 0 | −100,00 | 0 | |||||
| 2026-02-12 | 13F | Advisory Resource Group | 120 355 | −8,86 | 1 568 | 9,34 | ||||
| 2026-02-02 | 13F | Miracle Mile Advisors, LLC | 13 523 | 2,66 | 176 | 23,08 | ||||
| 2026-02-03 | 13F | Orion Capital Management LLC | 0 | −100,00 | 0 | |||||
| 2026-01-15 | 13F | J. Safra Sarasin Holding AG | 68 200 | 0,00 | 889 | 20,00 | ||||
| 2026-02-13 | 13F | Bank Of Nova Scotia | 56 033 | −1,01 | 730 | 18,89 | ||||
| 2026-01-09 | 13F | 180 Wealth Advisors, Llc | 82 508 | −3,91 | 1 075 | 15,34 | ||||
| 2026-02-17 | 13F | Ameriflex Group, Inc. | 600 | 8 | ||||||
| 2026-02-13 | 13F | Smartleaf Asset Management LLC | 5 311 | 1 064,69 | 70 | 1 625,00 | ||||
| 2026-02-20 | 13F/A | CMT Capital Markets Trading GmbH | Put | 3 922 300 | −3,16 | 51 | 18,60 | |||
| 2026-01-16 | 13F | Vanguard Capital Wealth Advisors This fund is a listed as child fund of Vanguard Group Inc and if that institution has disclosed ownership in this security, then these positions will not be double counted when calculating total shares and total value | 10 500 | 137 | ||||||
| 2026-02-17 | 13F | Banco Bilbao Vizcaya Argentaria, S.a. | 0 | −100,00 | 0 | |||||
| 2025-11-13 | 13F | VGI Partners Ltd | 0 | −100,00 | 0 | |||||
| 2026-02-17 | 13F | Jones Financial Companies Lllp | 51 199 | 9,01 | 667 | 32,87 | ||||
| 2026-02-05 | 13F/A | Fulcrum Asset Management LLP | 28 982 | −9,08 | 380 | 9,54 | ||||
| 2026-02-11 | 13F | Simplex Trading, Llc | Put | 1 826 100 | −17,41 | 23 794 | 99 041,67 | |||
| 2026-02-11 | 13F | Simplex Trading, Llc | 636 509 | 8 294 | ||||||
| 2026-01-15 | 13F | SILVER OAK SECURITIES, Inc | 33 650 | 0,00 | 441 | 20,55 | ||||
| 2026-01-29 | 13F | Calamos Advisors LLC | 74 150 | 180,34 | 966 | 236,59 | ||||
| 2026-02-11 | 13F | Winton Capital Group Ltd | 99 000 | 1 290 | ||||||
| 2026-01-22 | 13F | Financial Consulate, Inc | 500 | 7 | ||||||
| 2026-01-22 | 13F | HHM Wealth Advisors, LLC | 700 | 0,00 | 9 | 28,57 | ||||
| 2026-01-23 | 13F | Nbt Bank N A /ny | 13 | 18,18 | 1 | |||||
| 2026-02-13 | 13F | Cornerstone Financial Management LLC | 51 | 1 | ||||||
| 2026-01-29 | 13F | IMC-Chicago, LLC | Put | 255 400 | 90,74 | 3 328 | 128,82 | |||
| 2026-01-14 | 13F | Jfs Wealth Advisors, Llc | 1 836 | 0,00 | 24 | 26,32 | ||||
| 2026-02-13 | 13F | Colony Group, LLC | 32 875 | 428 | ||||||
| 2025-09-26 | NP | RTXAX - Tax-Managed Real Assets Fund Class A | 99 402 | 52,38 | 947 | 56,01 | ||||
| 2026-01-20 | 13F | Wall Street Access Asset Management, LLC | 5 907 | 0,00 | 77 | 18,75 | ||||
| 2026-02-11 | 13F | Janney Montgomery Scott LLC | 29 218 | −48,63 | 0 | |||||
| 2026-01-29 | 13F | Calamos Advisors LLC | Call | 0 | −100,00 | 0 | −100,00 | |||
| 2025-10-30 | 13F | Ridgewood Investments LLC | Call | 0 | −100,00 | 0 | −100,00 | |||
| 2026-01-23 | 13F | Financial Connections Group, Inc. | 1 000 | 0,00 | 0 | |||||
| 2025-09-25 | NP | DFCEX - Emerging Markets Core Equity Portfolio - Institutional Class This fund is a listed as child fund of Dimensional Fund Advisors Lp and if that institution has disclosed ownership in this security, then these positions will not be double counted when calculating total shares and total value | 1 040 592 | 0,00 | 9 917 | 2,36 | ||||
| 2026-02-09 | 13F | Todd Asset Management Llc | 6 239 516 | 51,62 | 81 301 | 81,92 | ||||
| 2026-02-17 | 13F | Abel Hall, LLC | 32 000 | 0,00 | 417 | 19,88 | ||||
| 2026-02-17 | 13F | Qube Research & Technologies Ltd | 0 | −100,00 | 0 | |||||
| 2026-01-15 | 13F | Shrier Wealth Management, Llc | 22 677 | 295 | ||||||
| 2025-09-25 | NP | DEHP - Dimensional Emerging Markets High Profitability ETF | 9 111 | −14,30 | 87 | −12,24 | ||||
| 2025-09-26 | NP | DINT - Davis Select International ETF | 548 439 | −1,82 | 5 227 | 0,50 | ||||
| 2026-02-17 | 13F | Creative Planning | 274 994 | 37,54 | 3 583 | 65,04 | ||||
| 2026-02-09 | 13F | Employees Retirement System of Texas | 170 991 | 2 | ||||||
| 2025-11-12 | 13F | Corient IA LLC | 0 | −100,00 | 0 | −100,00 | ||||
| 2026-02-09 | 13F | Wellington Shields Capital Management, LLC | 0 | −100,00 | 0 | |||||
| 2026-01-12 | 13F | Abound Wealth Management | 30 | 0,00 | 0 | |||||
| 2026-02-17 | 13F | Boothbay Fund Management, Llc | 13 706 | 179 | ||||||
| 2026-02-10 | 13F | Sittner & Nelson, Llc | 237 | 0,00 | 4 | 50,00 | ||||
| 2026-02-13 | 13F | Parkside Financial Bank & Trust | 188 | 0,00 | 2 | 0,00 | ||||
| 2026-01-13 | 13F | Bank & Trust Co | 200 | 0,00 | 3 | 0,00 | ||||
| 2026-01-14 | 13F | Trust Co Of Oklahoma | 10 000 | 0,00 | 130 | 20,37 | ||||
| 2026-01-28 | 13F | DekaBank Deutsche Girozentrale | 631 753 | 0,00 | 9 | 33,33 | ||||
| 2026-02-13 | 13F | Marshall Wace, Llp | 3 165 210 | 41 243 | ||||||
| 2026-02-13 | 13F | Impala Asset Management LLC | 160 000 | 2 085 | ||||||
| 2025-09-25 | NP | AMTAX - AB All Market Real Return Portfolio Class A | 72 730 | 46,31 | 693 | 50,00 | ||||
| 2026-02-12 | 13F | Wealthspire Advisors, LLC | 0 | −100,00 | 0 | −100,00 | ||||
| 2026-02-12 | 13F | Alps Advisors Inc | 0 | −100,00 | 0 | |||||
| 2026-02-03 | 13F | Garner Asset Management Corp | 275 | 4 | ||||||
| 2026-02-05 | 13F | Allworth Financial LP | 19 374 | 74,93 | 252 | 110,00 | ||||
| 2026-02-03 | 13F | Ballentine Partners, LLC | 30 684 | 7,22 | 400 | 28,71 | ||||
| 2026-02-13 | 13F | Ubs Asset Management Americas Inc | 100 020 | 1 303 | ||||||
| 2026-01-28 | 13F | N.E.W. Advisory Services LLC | 2 000 | 26 | ||||||
| 2026-02-06 | 13F | Kilter Group LLC | 0 | −100,00 | 0 | |||||
| 2026-01-29 | 13F | Deltec Asset Management Llc | 16 500 | 0,00 | 215 | 19,55 | ||||
| 2026-01-09 | 13F | SG Americas Securities, LLC | 808 326 | 99,39 | 11 | 150,00 | ||||
| 2026-01-05 | 13F | Rosenberg Matthew Hamilton | 2 483 | 0,00 | 32 | 23,08 | ||||
| 2026-02-13 | 13F | Barclays Plc | 1 561 385 | −38,99 | 20 345 | −26,80 | ||||
| 2026-02-17 | 13F | Adage Capital Partners Gp, L.l.c. | 0 | −100,00 | 0 | |||||
| 2025-09-25 | NP | DAADX - Emerging Markets ex China Core Equity Portfolio Institutional Class | 301 863 | −31,03 | 2 877 | −29,41 | ||||
| 2026-01-26 | 13F | Monument Capital Management | 18 765 | 45,34 | 245 | 74,29 | ||||
| 2026-01-23 | 13F | Farther Finance Advisors, LLC | 33 009 | 50,53 | 430 | 80,67 | ||||
| 2025-11-07 | 13F | Sierra Ocean, Llc | 0 | −100,00 | 0 | |||||
| 2025-10-17 | 13F | Thompson Investment Management, Inc. | 0 | −100,00 | 0 | |||||
| 2026-02-05 | 13F | Gabelli Funds Llc | 10 000 | 0,00 | 130 | 20,37 | ||||
| 2026-02-13 | 13F | Johnson Investment Counsel Inc | 0 | −100,00 | 0 | |||||
| 2026-01-28 | 13F | Kapitalo Investimentos Ltda | 0 | −100,00 | 0 | |||||
| 2026-02-12 | 13F | Mint Tower Capital Management B.V. | 20 000 | 0 | ||||||
| 2026-02-12 | 13F | Mint Tower Capital Management B.V. | Call | 284 900 | 4 | |||||
| 2025-09-25 | NP | DEXC - Dimensional Emerging Markets ex China Core Equity ETF | 97 400 | 16,51 | 928 | 19,28 | ||||
| 2025-09-25 | NP | Dimensional Emerging Markets Value Fund - Dimensional Emerging Markets Value Fund This fund is a listed as child fund of Dimensional Fund Advisors Lp and if that institution has disclosed ownership in this security, then these positions will not be double counted when calculating total shares and total value | 656 676 | 0,00 | 6 258 | 2,37 | ||||
| 2026-02-12 | 13F | Mint Tower Capital Management B.V. | Put | 309 900 | 4 | |||||
| 2026-02-13 | 13F | Pathstone Holdings, LLC | 32 917 | 30,28 | 429 | 56,57 | ||||
| 2026-02-13 | 13F | Ubs Oconnor Llc | 0 | −100,00 | 0 | |||||
| 2026-01-05 | 13F | Park Avenue Securities Llc | 21 431 | 58,03 | 0 | |||||
| 2026-02-20 | 13F/A | Capital Markets Trading UK LLP | Put | 2 149 100 | −5,22 | 28 | 16,67 | |||
| 2026-02-17 | 13F | Caption Management, LLC | 770 000 | 10 033 | ||||||
| 2026-02-17 | 13F | Holocene Advisors, LP | 7 532 061 | 226,84 | 98 143 | 292,14 | ||||
| 2026-02-19 | 13F | Birchwood Financial Partners, Inc. | 1 620 | 21 | ||||||
| 2026-02-13 | 13F | Mariner, LLC | 152 538 | 8,62 | 1 988 | 30,30 | ||||
| 2026-01-09 | 13F | Pacifica Partners Inc. | 0 | −100,00 | 0 | |||||
| 2025-11-13 | 13F | Tepp RIA, LLC | 0 | −100,00 | 0 | −100,00 | ||||
| 2026-02-13 | 13F | Barclays Plc | Call | 13 700 | 0,00 | 179 | 20,27 | |||
| 2026-02-10 | 13F | CIBC World Markets Inc. | 816 277 | 9,09 | 10 636 | 30,89 | ||||
| 2026-01-07 | 13F | Riversedge Advisors, Llc | 12 938 | 169 | ||||||
| 2026-02-06 | 13F | GPS Wealth Strategies Group, LLC | 0 | −100,00 | 0 | |||||
| 2026-01-27 | 13F | Evergreen Capital Management Llc | 25 049 | 9,77 | 340 | 37,25 | ||||
| 2026-02-03 | 13F | AssuredPartners Investment Advisors, LLC | 36 350 | 474 | ||||||
| 2025-10-07 | 13F | GFG Capital, LLC | 0 | −100,00 | 0 | |||||
| 2026-02-17 | 13F | Clough Capital Partners L P | 0 | −100,00 | 0 | |||||
| 2026-02-17 | 13F | Caption Management, LLC | Put | 1 875 400 | 24 436 | |||||
| 2026-02-17 | 13F | Caption Management, LLC | Call | 2 155 400 | 28 085 | |||||
| 2026-01-08 | 13F | Wedmont Private Capital | 25 460 | 4,96 | 363 | 35,96 | ||||
| 2025-09-23 | NP | FNCRX - Franklin Natural Resources Fund Class C | 199 400 | 0,00 | 1 900 | 2,37 | ||||
| 2026-02-17 | 13F | Advisor Group Holdings, Inc. | 315 802 | −0,95 | 4 115 | 24,21 | ||||
| 2026-02-06 | 13F | Pnc Financial Services Group, Inc. | 28 913 | 2,23 | 377 | 22,48 | ||||
| 2026-02-13 | 13F | Stifel Financial Corp | 254 707 | −2,87 | 3 319 | 16,54 | ||||
| 2026-01-27 | 13F | Ninety One North America, Inc. | 3 361 779 | −0,47 | 43 804 | 19,42 | ||||
| 2026-02-12 | 13F | Advisors Asset Management, Inc. | 263 799 | −4,28 | 3 437 | 14,87 | ||||
| 2026-02-10 | 13F | NINE MASTS CAPITAL Ltd | Call | 0 | −100,00 | 0 | −100,00 | |||
| 2026-01-30 | 13F | Carrera Capital Advisors | 13 961 | 7,42 | 191 | 34,75 | ||||
| 2025-09-26 | NP | Global Opportunities Portfolio - Global Opportunities Portfolio | 496 500 | 29,13 | 4 732 | 32,19 |