Grundläggande statistik
| Portföljvärde | $ 288 165 447 |
| Aktuella positioner | 138 |
Senaste innehav, resultat, förvaltat kapital (från 13F, 13D)
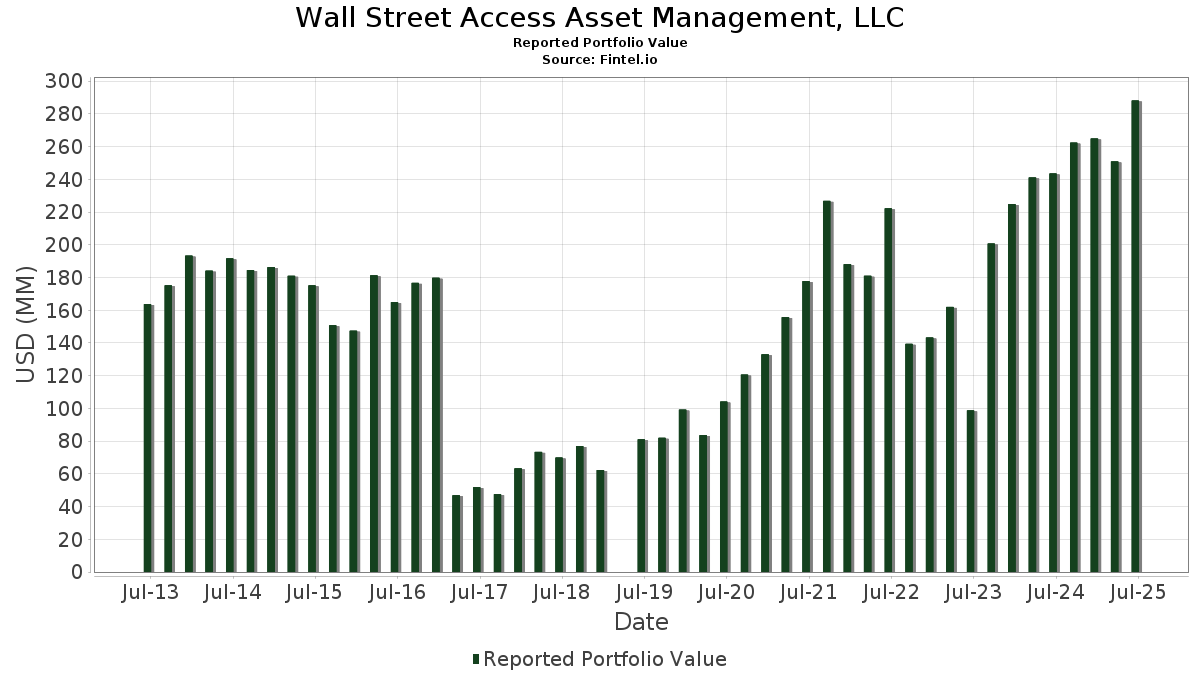
Wall Street Access Asset Management, LLC har redovisat 138 totala innehav i sina senaste SEC-arkiveringar. Det senaste portföljvärdet beräknas vara $ 288 165 447 USD. Faktiskt förvaltade tillgångar (AUM) är detta värde plus likvida medel (som inte redovisas). Wall Street Access Asset Management, LLCs största innehav är iShares Trust - iShares Core S&P 500 ETF (US:IVV) , Berkshire Hathaway Inc. (US:BRK.A) , Microsoft Corporation (US:MSFT) , Apple Inc. (US:AAPL) , and Amazon.com, Inc. (US:AMZN) . Wall Street Access Asset Management, LLCs nya positioner inkluderar Honeywell International Inc. (US:HON) , Rocket Companies, Inc. (US:RKT) , AstraZeneca PLC - Depositary Receipt (Common Stock) (US:AZN) , .
Största ökningarna detta kvartal
Vi använder förändringen i portföljallokeringen eftersom det är det mest meningsfulla måttet. Förändringar kan bero på transaktioner eller förändringar i aktiekurser.
| Värdepapper | Aktier (MM) |
Värde (MM$) |
Portfölj % av | ΔPortfölj % av |
|---|---|---|---|---|
| 0,04 | 19,63 | 6,8116 | 1,1419 | |
| 0,00 | 41,54 | 14,4159 | 0,7331 | |
| 0,01 | 9,22 | 3,2008 | 0,3830 | |
| 0,01 | 2,70 | 0,9367 | 0,2773 | |
| 0,01 | 2,17 | 0,7528 | 0,2064 | |
| 0,01 | 0,59 | 0,2051 | 0,2051 | |
| 0,00 | 0,52 | 0,1809 | 0,1809 | |
| 0,00 | 0,51 | 0,1754 | 0,1754 | |
| 0,02 | 1,32 | 0,4584 | 0,1665 | |
| 0,00 | 0,43 | 0,1493 | 0,1493 |
Största minskningarna detta kvartal
Vi använder förändringen i portföljallokeringen eftersom det är det mest meningsfulla måttet. Förändringar kan bero på transaktioner eller förändringar i aktiepriser.
| Värdepapper | Aktier (MM) |
Värde (MM$) |
Portfölj % av | ΔPortfölj % av |
|---|---|---|---|---|
| 0,02 | 11,42 | 3,9643 | −1,3597 | |
| 0,06 | 12,66 | 4,3924 | −0,9910 | |
| 0,04 | 4,66 | 1,6178 | −0,4669 | |
| 0,02 | 2,69 | 0,9351 | −0,2150 | |
| 0,08 | 46,74 | 16,2190 | −0,1948 | |
| 0,01 | 1,08 | 0,3738 | −0,1667 | |
| 0,01 | 4,14 | 1,4363 | −0,1355 | |
| 0,00 | 0,85 | 0,2963 | −0,1338 | |
| 0,00 | 0,22 | 0,0760 | −0,1099 | |
| 0,00 | 0,30 | 0,1032 | −0,1073 |
13F- och fond arkiveringar
Denna blankett lämnades in den 2025-08-08 för rapporteringsperioden 2025-06-30. Klicka på länksymbolen för att se hela transaktionshistoriken.
Uppgradera för att låsa upp premiumdata och exportera till Excel![]() .
.
| Värdepapper | Typ | Genomsnittligt aktiepris | Aktier (MM) |
ΔAktier (%) |
ΔAktier (%) |
Värde ($MM) |
Portfölj (%) |
ΔPortfölj (%) |
|
|---|---|---|---|---|---|---|---|---|---|
| IVV / iShares Trust - iShares Core S&P 500 ETF | 0,08 | 2,70 | 46,74 | 13,48 | 16,2190 | −0,1948 | |||
| BRK.A / Berkshire Hathaway Inc. | 0,00 | 32,56 | 41,54 | 21,00 | 14,4159 | 0,7331 | |||
| MSFT / Microsoft Corporation | 0,04 | 4,13 | 19,63 | 37,97 | 6,8116 | 1,1419 | |||
| AAPL / Apple Inc. | 0,06 | 1,45 | 12,66 | −6,30 | 4,3924 | −0,9910 | |||
| AMZN / Amazon.com, Inc. | 0,05 | 1,87 | 11,82 | 17,47 | 4,1006 | 0,0914 | |||
| BRK.A / Berkshire Hathaway Inc. | 0,02 | −6,25 | 11,42 | −14,49 | 3,9643 | −1,3597 | |||
| GOOG / Alphabet Inc. | 0,06 | 3,60 | 10,76 | 17,63 | 3,7332 | 0,0883 | |||
| META / Meta Platforms, Inc. | 0,01 | 1,87 | 9,22 | 30,45 | 3,2008 | 0,3830 | |||
| VTV / Vanguard Index Funds - Vanguard Value ETF | 0,03 | 14,13 | 5,74 | 16,77 | 1,9910 | 0,0329 | |||
| VUG / Vanguard Index Funds - Vanguard Growth ETF | 0,01 | 1,51 | 5,23 | 20,02 | 1,8160 | 0,0782 | |||
| BRO / Brown & Brown, Inc. | 0,04 | 0,00 | 4,66 | −10,88 | 1,6178 | −0,4669 | |||
| DIA / SPDR Dow Jones Industrial Average ETF Trust | 0,01 | 0,00 | 4,14 | 4,97 | 1,4363 | −0,1355 | |||
| RSP / Invesco Exchange-Traded Fund Trust - Invesco S&P 500 Equal Weight ETF | 0,02 | 18,23 | 3,93 | 24,03 | 1,3651 | 0,1013 | |||
| VIG / Vanguard Specialized Funds - Vanguard Dividend Appreciation ETF | 0,02 | 5,96 | 3,82 | 11,79 | 1,3264 | −0,0362 | |||
| QQQ / Invesco QQQ Trust, Series 1 | 0,01 | 8,46 | 3,59 | 27,61 | 1,2449 | 0,1243 | |||
| GOOGL / Alphabet Inc. | 0,02 | −0,56 | 3,17 | 13,32 | 1,0986 | −0,0148 | |||
| DFAS / Dimensional ETF Trust - Dimensional U.S. Small Cap ETF | 0,05 | 2,43 | 3,11 | 9,24 | 1,0793 | −0,0555 | |||
| SHV / iShares Trust - iShares Short Treasury Bond ETF | 0,03 | 28,75 | 3,02 | 28,73 | 1,0482 | 0,1129 | |||
| SPY / SPDR S&P 500 ETF | 0,00 | 1,61 | 2,92 | 12,23 | 1,0129 | −0,0236 | |||
| VB / Vanguard Index Funds - Vanguard Small-Cap ETF | 0,01 | 0,52 | 2,82 | 7,40 | 0,9779 | −0,0676 | |||
| JPM / JPMorgan Chase & Co. | 0,01 | 38,04 | 2,70 | 63,18 | 0,9367 | 0,2773 | |||
| BLDR / Builders FirstSource, Inc. | 0,02 | −0,03 | 2,69 | −6,62 | 0,9351 | −0,2150 | |||
| NVDA / NVIDIA Corporation | 0,01 | 8,55 | 2,17 | 58,32 | 0,7528 | 0,2064 | |||
| ABBV / AbbVie Inc. | 0,01 | 15,64 | 2,14 | 2,49 | 0,7420 | −0,0897 | |||
| VO / Vanguard Index Funds - Vanguard Mid-Cap ETF | 0,01 | 3,08 | 1,86 | 11,53 | 0,6445 | −0,0192 | |||
| BAC / Bank of America Corporation | 0,04 | 6,43 | 1,77 | 20,63 | 0,6153 | 0,0298 | |||
| UBER / Uber Technologies, Inc. | 0,02 | 1,22 | 1,71 | 29,66 | 0,5918 | 0,0675 | |||
| JGRW / Trust For Professional Managers - Jensen Quality Growth ETF | 0,06 | 17,81 | 1,70 | 22,62 | 0,5892 | 0,0373 | |||
| ET / Energy Transfer LP - Limited Partnership | 0,09 | 0,00 | 1,57 | −2,48 | 0,5452 | −0,0968 | |||
| APO / Apollo Global Management, Inc. | 0,01 | −0,33 | 1,52 | 3,25 | 0,5291 | −0,0594 | |||
| JNJ / Johnson & Johnson | 0,01 | 25,78 | 1,51 | 15,85 | 0,5229 | 0,0046 | |||
| NKE / NIKE, Inc. | 0,02 | −0,73 | 1,35 | 11,10 | 0,4691 | −0,0158 | |||
| CCJ / Cameco Corporation | 0,02 | 0,00 | 1,32 | 80,33 | 0,4584 | 0,1665 | |||
| GLD / SPDR Gold Trust | 0,00 | 0,00 | 1,31 | 5,74 | 0,4545 | −0,0389 | |||
| GSCE / GS Connect S&P GSCI Enhanced Commodity Total Return ETN | 0,00 | −0,33 | 1,28 | 29,16 | 0,4444 | 0,0493 | |||
| TSLA / Tesla, Inc. | 0,00 | −1,07 | 1,26 | 21,33 | 0,4363 | 0,0231 | |||
| CSCO / Cisco Systems, Inc. | 0,02 | 34,71 | 1,20 | 51,39 | 0,4173 | 0,1009 | |||
| XOM / Exxon Mobil Corporation | 0,01 | 5,78 | 1,18 | −4,13 | 0,4107 | −0,0812 | |||
| PFE / Pfizer Inc. | 0,04 | 11,99 | 1,09 | 7,11 | 0,3768 | −0,0271 | |||
| BABA / Alibaba Group Holding Limited - Depositary Receipt (Common Stock) | 0,01 | −7,40 | 1,08 | −20,58 | 0,3738 | −0,1667 | |||
| VZ / Verizon Communications Inc. | 0,02 | 5,44 | 1,02 | 0,69 | 0,3555 | −0,0499 | |||
| SCHG / Schwab Strategic Trust - Schwab U.S. Large-Cap Growth ETF | 0,03 | 0,00 | 1,01 | 16,69 | 0,3519 | 0,0055 | |||
| BR / Broadridge Financial Solutions, Inc. | 0,00 | −2,20 | 0,97 | −1,92 | 0,3378 | −0,0579 | |||
| VNQ / Vanguard Specialized Funds - Vanguard Real Estate ETF | 0,01 | 9,72 | 0,97 | 7,94 | 0,3351 | −0,0215 | |||
| MCD / McDonald's Corporation | 0,00 | −0,93 | 0,93 | −7,38 | 0,3226 | −0,0772 | |||
| GILD / Gilead Sciences, Inc. | 0,01 | 0,22 | 0,90 | −0,89 | 0,3109 | −0,0492 | |||
| GJR / Strats Trust For Procter & Gambel Security - Preferred Security | 0,01 | 74,21 | 0,89 | 63,07 | 0,3096 | 0,0913 | |||
| PEP / PepsiCo, Inc. | 0,01 | 7,03 | 0,89 | −5,71 | 0,3092 | −0,0676 | |||
| VTI / Vanguard Index Funds - Vanguard Total Stock Market ETF | 0,00 | −28,45 | 0,85 | −20,95 | 0,2963 | −0,1338 | |||
| XLE / The Select Sector SPDR Trust - The Energy Select Sector SPDR Fund | 0,01 | 0,00 | 0,85 | −9,32 | 0,2939 | −0,0780 | |||
| CVNA / Carvana Co. | 0,00 | 0,00 | 0,84 | 61,30 | 0,2923 | 0,0840 | |||
| IBM / International Business Machines Corporation | 0,00 | 12,00 | 0,83 | 32,85 | 0,2864 | 0,0387 | |||
| MRK / Merck & Co., Inc. | 0,01 | 60,15 | 0,82 | 41,25 | 0,2831 | 0,0529 | |||
| SCHV / Schwab Strategic Trust - Schwab U.S. Large-Cap Value ETF | 0,03 | 0,00 | 0,81 | 4,12 | 0,2806 | −0,0290 | |||
| T / AT&T Inc. | 0,03 | 11,27 | 0,77 | 13,97 | 0,2664 | −0,0019 | |||
| BA / The Boeing Company | 0,00 | 88,71 | 0,76 | 131,91 | 0,2650 | 0,1337 | |||
| AMGN / Amgen Inc. | 0,00 | 0,58 | 0,73 | −9,81 | 0,2520 | −0,0691 | |||
| JAAA / Janus Detroit Street Trust - Janus Henderson AAA CLO ETF | 0,01 | 33,18 | 0,68 | 33,33 | 0,2375 | 0,0329 | |||
| V / Visa Inc. | 0,00 | −0,10 | 0,68 | 1,34 | 0,2367 | −0,0319 | |||
| FWONA / Formula One Group | 0,01 | 0,00 | 0,68 | 16,04 | 0,2363 | 0,0026 | |||
| UNH / UnitedHealth Group Incorporated | 0,00 | 73,44 | 0,68 | 3,35 | 0,2354 | −0,0262 | |||
| DD / DuPont de Nemours, Inc. | 0,01 | 0,21 | 0,67 | −8,06 | 0,2339 | −0,0580 | |||
| GBTC / Grayscale Bitcoin Trust (BTC) | 0,01 | 0,00 | 0,67 | 30,08 | 0,2314 | 0,0272 | |||
| AVGO / Broadcom Inc. | 0,00 | 72,22 | 0,64 | 183,19 | 0,2224 | 0,1323 | |||
| VHT / Vanguard World Fund - Vanguard Health Care ETF | 0,00 | −13,98 | 0,62 | −19,27 | 0,2153 | −0,0911 | |||
| C / Citigroup Inc. | 0,01 | 0,01 | 0,61 | 19,96 | 0,2107 | 0,0089 | |||
| PPG / PPG Industries, Inc. | 0,01 | 0,59 | 0,2051 | 0,2051 | |||||
| VEA / Vanguard Tax-Managed Funds - Vanguard FTSE Developed Markets ETF | 0,01 | 0,00 | 0,59 | 12,17 | 0,2051 | −0,0049 | |||
| GE / General Electric Company | 0,00 | 0,00 | 0,59 | 28,60 | 0,2047 | 0,0219 | |||
| KO / The Coca-Cola Company | 0,01 | −3,77 | 0,59 | −5,01 | 0,2043 | −0,0425 | |||
| COST / Costco Wholesale Corporation | 0,00 | 0,00 | 0,56 | 4,72 | 0,1927 | −0,0187 | |||
| TIP / iShares Trust - iShares TIPS Bond ETF | 0,00 | 0,00 | 0,55 | −0,90 | 0,1906 | −0,0304 | |||
| SCHD / Schwab Strategic Trust - Schwab U.S. Dividend Equity ETF | 0,02 | 0,34 | 0,54 | −4,90 | 0,1887 | −0,0392 | |||
| VST / Vistra Corp. | 0,00 | 21,81 | 0,54 | 100,75 | 0,1863 | 0,0799 | |||
| VXUS / Vanguard STAR Funds - Vanguard Total International Stock ETF | 0,01 | 0,00 | 0,53 | 11,27 | 0,1851 | −0,0060 | |||
| TXN / Texas Instruments Incorporated | 0,00 | 0,52 | 0,1809 | 0,1809 | |||||
| IJH / iShares Trust - iShares Core S&P Mid-Cap ETF | 0,01 | 0,00 | 0,51 | 6,47 | 0,1770 | −0,0142 | |||
| VOO / Vanguard Index Funds - Vanguard S&P 500 ETF | 0,00 | 0,51 | 0,1754 | 0,1754 | |||||
| LENZ / LENZ Therapeutics, Inc. | 0,02 | 0,00 | 0,50 | 13,96 | 0,1731 | −0,0013 | |||
| PANW / Palo Alto Networks, Inc. | 0,00 | 18,04 | 0,46 | 41,61 | 0,1584 | 0,0299 | |||
| FLR / Fluor Corporation | 0,01 | 0,00 | 0,45 | 43,27 | 0,1554 | 0,0307 | |||
| OBDC / Blue Owl Capital Corporation | 0,03 | 1,13 | 0,44 | −0,89 | 0,1542 | −0,0247 | |||
| GD / General Dynamics Corporation | 0,00 | −0,39 | 0,44 | 6,75 | 0,1537 | −0,0119 | |||
| ADP / Automatic Data Processing, Inc. | 0,00 | −5,30 | 0,44 | −4,56 | 0,1530 | −0,0308 | |||
| HLT / Hilton Worldwide Holdings Inc. | 0,00 | −1,26 | 0,44 | 15,53 | 0,1525 | 0,0010 | |||
| ABT / Abbott Laboratories | 0,00 | −2,93 | 0,44 | −0,46 | 0,1514 | −0,0233 | |||
| IDXX / IDEXX Laboratories, Inc. | 0,00 | 0,00 | 0,43 | 27,73 | 0,1503 | 0,0151 | |||
| ETN / Eaton Corporation plc | 0,00 | 0,43 | 0,1493 | 0,1493 | |||||
| HON / Honeywell International Inc. | 0,00 | 0,43 | 0,1489 | 0,1489 | |||||
| SYK / Stryker Corporation | 0,00 | −7,68 | 0,43 | −1,83 | 0,1486 | −0,0253 | |||
| RTX / RTX Corporation | 0,00 | 35,38 | 0,42 | 49,64 | 0,1454 | 0,0335 | |||
| QCOM / QUALCOMM Incorporated | 0,00 | 0,00 | 0,41 | 3,78 | 0,1430 | −0,0154 | |||
| CAT / Caterpillar Inc. | 0,00 | −0,09 | 0,41 | 17,53 | 0,1422 | 0,0033 | |||
| GBDC / Golub Capital BDC, Inc. | 0,03 | 1,12 | 0,41 | −1,93 | 0,1414 | −0,0243 | |||
| BP / BP p.l.c. - Depositary Receipt (Common Stock) | 0,01 | 1,70 | 0,40 | −10,04 | 0,1401 | −0,0385 | |||
| DIS / The Walt Disney Company | 0,00 | −32,67 | 0,40 | −15,42 | 0,1371 | −0,0491 | |||
| MMC / Marsh & McLennan Companies, Inc. | 0,00 | 0,39 | 0,1348 | 0,1348 | |||||
| LLY / Eli Lilly and Company | 0,00 | 0,00 | 0,36 | −5,71 | 0,1262 | −0,0274 | |||
| MMM / 3M Company | 0,00 | 0,00 | 0,36 | 3,72 | 0,1259 | −0,0136 | |||
| NFBK / Northfield Bancorp, Inc. (Staten Island, NY) | 0,03 | 0,00 | 0,36 | 5,23 | 0,1259 | −0,0115 | |||
| AVY / Avery Dennison Corporation | 0,00 | 0,36 | 0,1234 | 0,1234 | |||||
| CTVA / Corteva, Inc. | 0,00 | 0,00 | 0,33 | 18,35 | 0,1144 | 0,0035 | |||
| BHP / BHP Group Limited - Depositary Receipt (Common Stock) | 0,01 | 1,47 | 0,31 | 0,64 | 0,1092 | −0,0155 | |||
| RKT / Rocket Companies, Inc. | 0,02 | 0,31 | 0,1089 | 0,1089 | |||||
| NBIS / Nebius Group N.V. | 0,01 | 0,31 | 0,1083 | 0,1083 | |||||
| EXP / Eagle Materials Inc. | 0,00 | 0,30 | 0,1052 | 0,1052 | |||||
| SLRC / SLR Investment Corp. | 0,02 | 0,19 | 0,30 | −4,13 | 0,1050 | −0,0207 | |||
| DE / Deere & Company | 0,00 | 0,00 | 0,30 | 8,70 | 0,1041 | −0,0063 | |||
| AVUV / American Century ETF Trust - Avantis U.S. Small Cap Value ETF | 0,00 | −46,11 | 0,30 | −43,75 | 0,1032 | −0,1073 | |||
| SCHA / Schwab Strategic Trust - Schwab U.S. Small-Cap ETF | 0,01 | 0,00 | 0,29 | 8,15 | 0,1014 | −0,0064 | |||
| IWF / iShares Trust - iShares Russell 1000 Growth ETF | 0,00 | 0,00 | 0,29 | 17,48 | 0,1005 | 0,0023 | |||
| TGT / Target Corporation | 0,00 | −31,39 | 0,29 | −35,20 | 0,1004 | −0,0774 | |||
| BKNG / Booking Holdings Inc. | 0,00 | 0,00 | 0,28 | 25,78 | 0,0984 | 0,0085 | |||
| HUN / Huntsman Corporation | 0,03 | 5,71 | 0,28 | −30,17 | 0,0973 | −0,0629 | |||
| ORCL / Oracle Corporation | 0,00 | 0,28 | 0,0970 | 0,0970 | |||||
| HD / The Home Depot, Inc. | 0,00 | −3,22 | 0,26 | −3,30 | 0,0918 | −0,0171 | |||
| INTC / Intel Corporation | 0,01 | 11,81 | 0,25 | 10,43 | 0,0883 | −0,0037 | |||
| PGR / The Progressive Corporation | 0,00 | 0,00 | 0,25 | −5,60 | 0,0880 | −0,0192 | |||
| PHYL / PGIM ETF Trust - PGIM Active High Yield Bond ETF | 0,01 | −3,51 | 0,25 | 4,17 | 0,0871 | −0,0086 | |||
| ACN / Accenture plc | 0,00 | −12,63 | 0,25 | −16,22 | 0,0861 | −0,0321 | |||
| PM / Philip Morris International Inc. | 0,00 | −1,09 | 0,25 | 13,30 | 0,0859 | −0,0010 | |||
| DHR / Danaher Corporation | 0,00 | 0,24 | 0,0821 | 0,0821 | |||||
| HTGC / Hercules Capital, Inc. | 0,01 | 0,11 | 0,24 | −4,47 | 0,0816 | −0,0168 | |||
| CVX / Chevron Corporation | 0,00 | 32,79 | 0,23 | 13,24 | 0,0805 | −0,0008 | |||
| SCHM / Schwab Strategic Trust - Schwab U.S. Mid-Cap ETF | 0,01 | 0,00 | 0,23 | 7,01 | 0,0796 | −0,0058 | |||
| CMI / Cummins Inc. | 0,00 | 0,00 | 0,23 | 4,57 | 0,0796 | −0,0079 | |||
| DSU / BlackRock Debt Strategies Fund, Inc. | 0,02 | 2,43 | 0,22 | 3,76 | 0,0768 | −0,0082 | |||
| FDX / FedEx Corporation | 0,00 | −49,66 | 0,22 | −53,22 | 0,0760 | −0,1099 | |||
| TD / The Toronto-Dominion Bank | 0,00 | 0,21 | 0,0735 | 0,0735 | |||||
| TMO / Thermo Fisher Scientific Inc. | 0,00 | −0,95 | 0,21 | −19,16 | 0,0733 | −0,0310 | |||
| AZN / AstraZeneca PLC - Depositary Receipt (Common Stock) | 0,00 | 0,21 | 0,0731 | 0,0731 | |||||
| BMY / Bristol-Myers Squibb Company | 0,00 | 22,47 | 0,20 | −7,37 | 0,0700 | −0,0165 | |||
| DSL / DoubleLine Income Solutions Fund | 0,01 | 0,18 | 0,0622 | 0,0622 | |||||
| OCSL / Oaktree Specialty Lending Corporation | 0,01 | 1,55 | 0,17 | −9,68 | 0,0584 | −0,0159 | |||
| HIO / Western Asset High Income Opportunity Fund Inc. | 0,03 | 0,12 | 0,0433 | 0,0433 | |||||
| PCYO / Pure Cycle Corporation | 0,01 | 0,11 | 0,0372 | 0,0372 | |||||
| CLF / Cleveland-Cliffs Inc. | 0,01 | 0,00 | 0,08 | −7,69 | 0,0293 | −0,0071 | |||
| DCGO / DocGo Inc. | 0,01 | 0,00 | 0,02 | −40,00 | 0,0063 | −0,0059 | |||
| IQV / IQVIA Holdings Inc. | 0,00 | −100,00 | 0,00 | 0,0000 | |||||
| MNST / Monster Beverage Corporation | 0,00 | −100,00 | 0,00 | 0,0000 | |||||
| HBI / Hanesbrands Inc. | 0,00 | −100,00 | 0,00 | 0,0000 | |||||
| MA / Mastercard Incorporated | 0,00 | −100,00 | 0,00 | 0,0000 | |||||
| ED / Consolidated Edison, Inc. | 0,00 | −100,00 | 0,00 | 0,0000 | |||||
| KVUE / Kenvue Inc. | 0,00 | −100,00 | 0,00 | 0,0000 |