Grundläggande statistik
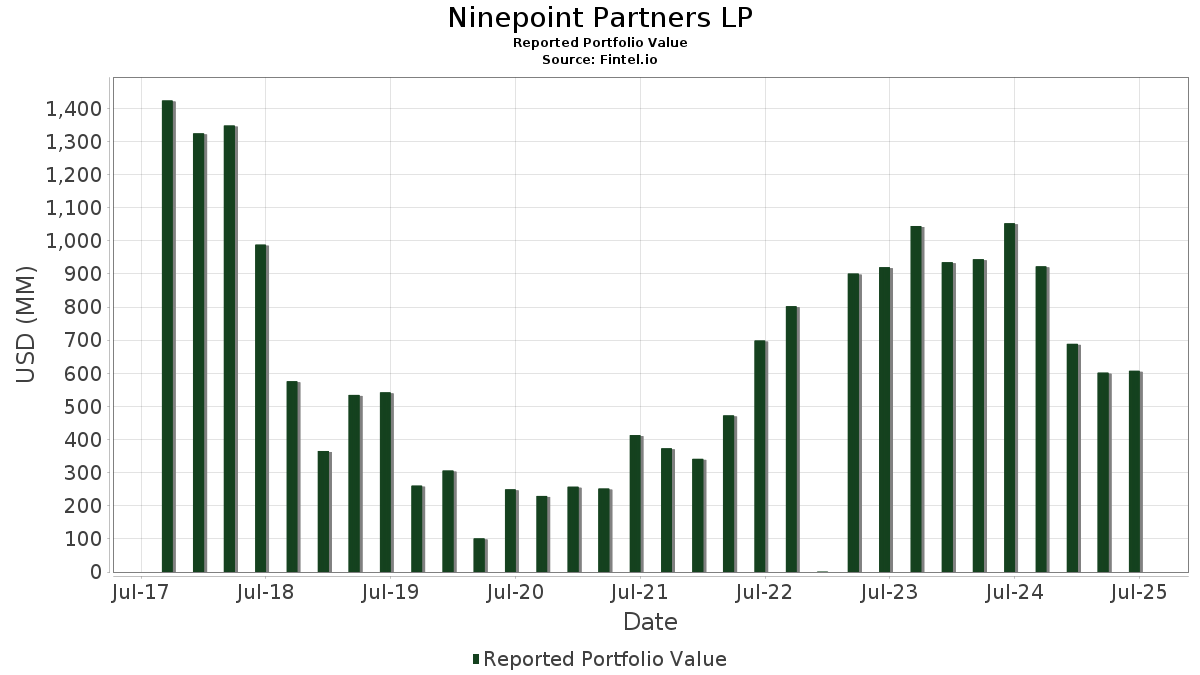
| Portföljvärde | $ 607 364 625 |
| Aktuella positioner | 87 |
Senaste innehav, resultat, förvaltat kapital (från 13F, 13D)
Ninepoint Partners LP har redovisat 87 totala innehav i sina senaste SEC-arkiveringar. Det senaste portföljvärdet beräknas vara $ 607 364 625 USD. Faktiskt förvaltade tillgångar (AUM) är detta värde plus likvida medel (som inte redovisas). Ninepoint Partners LPs största innehav är Expand Energy Corporation (US:EXE) , EQT Corporation (US:EQT) , Range Resources Corporation (US:RRC) , Antero Resources Corporation (US:AR) , and iShares Trust - iShares S&P 100 ETF (US:OEF) . Ninepoint Partners LPs nya positioner inkluderar Eaton Corporation plc (US:ETN) , SAP SE - Depositary Receipt (Common Stock) (US:SAP) , Dell Technologies Inc. (US:DELL) , Equinox Gold Corp. (US:EQX) , and Circle Internet Group, Inc. (US:CRCL) .
Största ökningarna detta kvartal
Vi använder förändringen i portföljallokeringen eftersom det är det mest meningsfulla måttet. Förändringar kan bero på transaktioner eller förändringar i aktiekurser.
| Värdepapper | Aktier (MM) |
Värde (MM$) |
Portfölj % av | ΔPortfölj % av |
|---|---|---|---|---|
| 1,50 | 61,01 | 10,0442 | 10,0442 | |
| 0,60 | 52,95 | 8,7180 | 8,7180 | |
| 1,40 | 56,39 | 9,2847 | 5,9240 | |
| 1,60 | 93,31 | 15,3634 | 2,0429 | |
| 0,30 | 7,77 | 1,2798 | 1,2798 | |
| 0,06 | 37,69 | 6,2053 | 0,8593 | |
| 0,80 | 93,55 | 15,4029 | 0,6014 | |
| 0,33 | 8,76 | 1,4431 | 0,4209 | |
| 0,01 | 1,75 | 0,2886 | 0,2886 | |
| 0,05 | 3,71 | 0,6111 | 0,2690 |
Största minskningarna detta kvartal
Vi använder förändringen i portföljallokeringen eftersom det är det mest meningsfulla måttet. Förändringar kan bero på transaktioner eller förändringar i aktiepriser.
| Värdepapper | Aktier (MM) |
Värde (MM$) |
Portfölj % av | ΔPortfölj % av |
|---|---|---|---|---|
| 0,09 | 2,84 | 0,4670 | −15,3528 | |
| 0,05 | 4,84 | 0,7973 | −1,2635 | |
| 0,00 | 0,00 | −1,0378 | ||
| 0,60 | 8,16 | 1,3435 | −0,9684 | |
| 0,15 | 4,25 | 0,7002 | −0,3047 | |
| 0,00 | 0,15 | 0,0248 | −0,1474 | |
| 0,35 | 4,77 | 0,7849 | −0,1359 | |
| 0,10 | 3,81 | 0,6278 | −0,1226 | |
| 0,05 | 3,23 | 0,5323 | −0,0666 | |
| 0,02 | 0,38 | 0,0626 | −0,0466 |
13F- och fond arkiveringar
Denna blankett lämnades in den 2025-08-05 för rapporteringsperioden 2025-06-30. Klicka på länksymbolen för att se hela transaktionshistoriken.
Uppgradera för att låsa upp premiumdata och exportera till Excel![]() .
.
| Värdepapper | Typ | Genomsnittligt aktiepris | Aktier (MM) |
ΔAktier (%) |
ΔAktier (%) |
Värde ($MM) |
Portfölj (%) |
ΔPortfölj (%) |
|
|---|---|---|---|---|---|---|---|---|---|
| EXE / Expand Energy Corporation | 0,80 | 0,00 | 93,55 | 5,05 | 15,4029 | 0,6014 | |||
| EQT / EQT Corporation | 1,60 | 6,67 | 93,31 | 16,43 | 15,3634 | 2,0429 | |||
| RRC / Range Resources Corporation | 1,50 | 61,01 | 10,0442 | 10,0442 | |||||
| AR / Antero Resources Corporation | 1,40 | 180,00 | 56,39 | 178,89 | 9,2847 | 5,9240 | |||
| OEF / iShares Trust - iShares S&P 100 ETF | Put | 0,60 | 52,95 | 8,7180 | 8,7180 | ||||
| SPY / SPDR S&P 500 ETF | Put | 0,06 | 6,09 | 37,69 | 17,17 | 6,2053 | 0,8593 | ||
| SPY / SPDR S&P 500 ETF | 0,05 | −4,92 | 32,25 | 5,02 | 5,3101 | 0,2059 | |||
| ALG / Alamo Group Inc. | 0,33 | 43,48 | 8,76 | 42,50 | 1,4431 | 0,4209 | |||
| KGCRF / Kinross Gold Corporation - Equity Right | 0,53 | 0,00 | 8,31 | 23,95 | 1,3686 | 0,2540 | |||
| CVE / Cenovus Energy Inc. | 0,60 | −40,00 | 8,16 | −41,34 | 1,3435 | −0,9684 | |||
| SOBO / South Bow Corporation | 0,30 | 7,77 | 1,2798 | 1,2798 | |||||
| AEM / Agnico Eagle Mines Limited | 0,06 | 0,00 | 7,57 | 9,71 | 1,2469 | 0,0995 | |||
| CHRD / Chord Energy Corporation | 0,05 | −54,55 | 4,84 | −60,95 | 0,7973 | −1,2635 | |||
| PR / Permian Resources Corporation | 0,35 | −12,50 | 4,77 | −13,95 | 0,7849 | −0,1359 | |||
| EBGEF / Enbridge Inc. - Preferred Stock | 0,10 | −1,93 | 4,68 | 0,32 | 0,7712 | −0,0049 | |||
| NOG / Northern Oil and Gas, Inc. | 0,15 | −25,00 | 4,25 | −29,67 | 0,7002 | −0,3047 | |||
| CNL / Collective Mining Ltd. | 0,39 | −6,10 | 4,21 | 18,22 | 0,6935 | 0,1013 | |||
| VZLA / Vizsla Silver Corp. | 1,40 | 19,93 | 4,12 | 55,33 | 0,6786 | 0,2376 | |||
| MFC / Manulife Financial Corporation | 0,13 | 20,82 | 4,02 | 23,96 | 0,6619 | 0,1229 | |||
| VNOM / Viper Energy, Inc. | 0,10 | 0,00 | 3,81 | −15,55 | 0,6278 | −0,1226 | |||
| CCJ / Cameco Corporation | 0,05 | 0,00 | 3,71 | 80,32 | 0,6111 | 0,2690 | |||
| CM / Canadian Imperial Bank of Commerce | 0,05 | −2,70 | 3,46 | 22,43 | 0,5697 | 0,0999 | |||
| RY / Royal Bank of Canada | 0,03 | −0,28 | 3,43 | 16,40 | 0,5645 | 0,0748 | |||
| NVDA / NVIDIA Corporation | 0,02 | 23,91 | 3,33 | 80,61 | 0,5490 | 0,2422 | |||
| SLF / Sun Life Financial Inc. | 0,05 | −22,68 | 3,23 | −10,30 | 0,5323 | −0,0666 | |||
| MSFT / Microsoft Corporation | 0,01 | 0,25 | 3,18 | 32,87 | 0,5238 | 0,1257 | |||
| TU / TELUS Corporation | 0,19 | −3,54 | 3,08 | 8,03 | 0,5074 | 0,0333 | |||
| IAG / IAMGOLD Corporation | 0,42 | 0,00 | 3,08 | 17,57 | 0,5069 | 0,0718 | |||
| SU / Suncor Energy Inc. | 0,08 | 5,61 | 3,03 | 2,16 | 0,4994 | 0,0058 | |||
| FTS / Fortis Inc. | 0,06 | −10,80 | 2,91 | −6,57 | 0,4796 | −0,0387 | |||
| CNQ / Canadian Natural Resources Limited | 0,09 | −97,08 | 2,84 | −97,02 | 0,4670 | −15,3528 | |||
| NXE / NexGen Energy Ltd. | 0,38 | 0,00 | 2,64 | 54,57 | 0,4342 | 0,1506 | |||
| FCX / Freeport-McMoRan Inc. | 0,06 | 9,09 | 2,60 | 24,93 | 0,4282 | 0,0822 | |||
| AMT / American Tower Corporation | 0,01 | 0,00 | 2,60 | 1,57 | 0,4273 | 0,0026 | |||
| WCN / Waste Connections, Inc. | 0,01 | 0,00 | 2,24 | −4,32 | 0,3680 | −0,0203 | |||
| WPM / Wheaton Precious Metals Corp. | 0,02 | 0,00 | 2,19 | 15,69 | 0,3606 | 0,0459 | |||
| TRP / TC Energy Corporation | 0,04 | 0,00 | 2,18 | 3,31 | 0,3594 | 0,0083 | |||
| COIN / Coinbase Global, Inc. | 0,01 | −16,28 | 2,16 | 70,37 | 0,3561 | 0,1451 | |||
| UNP / Union Pacific Corporation | 0,01 | 11,20 | 2,00 | 8,30 | 0,3289 | 0,0223 | |||
| SBAC / SBA Communications Corporation | 0,01 | 0,00 | 1,99 | 6,75 | 0,3282 | 0,0178 | |||
| TLN / Talen Energy Corporation | 0,01 | −11,09 | 1,93 | 29,47 | 0,3183 | 0,0701 | |||
| CEG / Constellation Energy Corporation | 0,01 | 1,75 | 0,2886 | 0,2886 | |||||
| AVGO / Broadcom Inc. | 0,01 | 12,03 | 1,67 | 84,50 | 0,2743 | 0,1242 | |||
| TRGP / Targa Resources Corp. | 0,01 | 14,60 | 1,53 | −0,45 | 0,2526 | −0,0036 | |||
| LNG / Cheniere Energy, Inc. | 0,01 | −6,84 | 1,53 | −1,98 | 0,2522 | −0,0075 | |||
| CP / Canadian Pacific Kansas City Limited | 0,02 | 0,00 | 1,52 | 12,94 | 0,2501 | 0,0265 | |||
| DUK / Duke Energy Corporation | 0,01 | 4,30 | 1,48 | 0,88 | 0,2443 | −0,0001 | |||
| AEP / American Electric Power Company, Inc. | 0,01 | 8,21 | 1,48 | 2,77 | 0,2441 | 0,0043 | |||
| PPL / PPL Corporation | 0,04 | 13,09 | 1,46 | 6,10 | 0,2408 | 0,0118 | |||
| NI / NiSource Inc. | 0,04 | −7,29 | 1,45 | −6,74 | 0,2395 | −0,0197 | |||
| HOOD / Robinhood Markets, Inc. | 0,02 | 25,65 | 1,45 | 182,68 | 0,2394 | 0,1539 | |||
| CMS / CMS Energy Corporation | 0,02 | 6,73 | 1,44 | −1,58 | 0,2367 | −0,0060 | |||
| ERO / Ero Copper Corp. | 0,09 | 0,00 | 1,43 | 39,03 | 0,2358 | 0,0646 | |||
| ET / Energy Transfer LP - Limited Partnership | 0,08 | 0,00 | 1,43 | −2,46 | 0,2353 | −0,0083 | |||
| EQIX / Equinix, Inc. | 0,00 | 3,49 | 1,42 | 1,00 | 0,2330 | 0,0000 | |||
| PAASF / Pan American Silver Corp. - Equity Right | 0,05 | 0,00 | 1,35 | 10,00 | 0,2228 | 0,0182 | |||
| AEE / Ameren Corporation | 0,01 | 0,00 | 1,34 | −4,35 | 0,2210 | −0,0122 | |||
| PYPL / PayPal Holdings, Inc. | 0,02 | −14,05 | 1,24 | −2,06 | 0,2038 | −0,0063 | |||
| JPM / JPMorgan Chase & Co. | 0,00 | 2,28 | 1,14 | 20,82 | 0,1884 | 0,0311 | |||
| ORCL / Oracle Corporation | 0,01 | 1,14 | 0,1869 | 0,1869 | |||||
| META / Meta Platforms, Inc. | 0,00 | 3,79 | 1,09 | 32,89 | 0,1797 | 0,0432 | |||
| AMZN / Amazon.com, Inc. | 0,00 | 7,47 | 0,99 | 23,94 | 0,1637 | 0,0304 | |||
| GOOG / Alphabet Inc. | 0,01 | 10,20 | 0,99 | 25,06 | 0,1628 | 0,0315 | |||
| V / Visa Inc. | 0,00 | −6,69 | 0,99 | −5,47 | 0,1623 | −0,0110 | |||
| RBLX / Roblox Corporation | 0,01 | 0,00 | 0,98 | 80,55 | 0,1621 | 0,0714 | |||
| WMT / Walmart Inc. | 0,01 | 3,37 | 0,95 | 15,21 | 0,1560 | 0,0192 | |||
| COST / Costco Wholesale Corporation | 0,00 | 3,53 | 0,90 | 8,32 | 0,1480 | 0,0101 | |||
| GSCE / GS Connect S&P GSCI Enhanced Commodity Total Return ETN | 0,00 | −4,82 | 0,85 | 23,30 | 0,1403 | 0,0254 | |||
| APH / Amphenol Corporation | 0,01 | 0,85 | 0,1402 | 0,1402 | |||||
| BSX / Boston Scientific Corporation | 0,01 | −7,13 | 0,81 | −1,11 | 0,1327 | −0,0028 | |||
| HUT / Hut 8 Corp. | 0,04 | 0,00 | 0,80 | 60,16 | 0,1311 | 0,0484 | |||
| MA / Mastercard Incorporated | 0,00 | 9,46 | 0,78 | 12,09 | 0,1284 | 0,0129 | |||
| UEC / Uranium Energy Corp. | 0,11 | 0,00 | 0,77 | 42,19 | 0,1261 | 0,0366 | |||
| BLK / BlackRock, Inc. | 0,00 | 0,00 | 0,76 | 10,89 | 0,1259 | 0,0113 | |||
| GEV / GE Vernova Inc. | 0,00 | −38,16 | 0,76 | 7,30 | 0,1258 | 0,0073 | |||
| AMD / Advanced Micro Devices, Inc. | 0,01 | 40,84 | 0,76 | 94,85 | 0,1245 | 0,0599 | |||
| TJX / The TJX Companies, Inc. | 0,01 | −2,89 | 0,74 | −1,59 | 0,1224 | −0,0031 | |||
| ETN / Eaton Corporation plc | 0,00 | 0,74 | 0,1224 | 0,1224 | |||||
| SAP / SAP SE - Depositary Receipt (Common Stock) | 0,00 | 0,73 | 0,1207 | 0,1207 | |||||
| DELL / Dell Technologies Inc. | 0,01 | 0,71 | 0,1166 | 0,1166 | |||||
| TMUS / T-Mobile US, Inc. | 0,00 | 0,00 | 0,68 | −10,66 | 0,1119 | −0,0146 | |||
| CME / CME Group Inc. | 0,00 | 0,00 | 0,58 | 3,91 | 0,0962 | 0,0027 | |||
| DNN / Denison Mines Corp. | 0,23 | 0,00 | 0,43 | 40,00 | 0,0704 | 0,0196 | |||
| MAG / MAG Silver Corp. | 0,02 | −58,14 | 0,38 | −42,16 | 0,0626 | −0,0466 | |||
| EQX / Equinox Gold Corp. | 0,05 | 0,38 | 0,0620 | 0,0620 | |||||
| CRCL / Circle Internet Group, Inc. | 0,00 | 0,27 | 0,0448 | 0,0448 | |||||
| AAPL / Apple Inc. | 0,00 | −84,26 | 0,15 | −85,51 | 0,0248 | −0,1474 | |||
| PEG / Public Service Enterprise Group Incorporated | 0,00 | −100,00 | 0,00 | 0,0000 | |||||
| C / Citigroup Inc. | 0,00 | −100,00 | 0,00 | 0,0000 | |||||
| VRN / Veren Inc. | 0,00 | −100,00 | 0,00 | 0,0000 | |||||
| XYZ / Block, Inc. | 0,00 | −100,00 | 0,00 | 0,0000 | |||||
| NSC / Norfolk Southern Corporation | 0,00 | −100,00 | 0,00 | 0,0000 | |||||
| SO / The Southern Company | 0,00 | −100,00 | 0,00 | 0,0000 | |||||
| DVN / Devon Energy Corporation | 0,00 | −100,00 | 0,00 | 0,0000 | |||||
| BTE / Baytex Energy Corp. | 0,00 | −100,00 | 0,00 | −100,00 | −1,0378 | ||||
| BAC / Bank of America Corporation | 0,00 | −100,00 | 0,00 | 0,0000 | |||||
| ABBV / AbbVie Inc. | 0,00 | −100,00 | 0,00 | 0,0000 | |||||
| GFR / Greenfire Resources Ltd. | 0,00 | −100,00 | 0,00 | 0,0000 | |||||
| HD / The Home Depot, Inc. | 0,00 | −100,00 | 0,00 | 0,0000 | |||||
| CIVI / Civitas Resources, Inc. | 0,00 | −100,00 | 0,00 | 0,0000 | |||||
| HWM / Howmet Aerospace Inc. | 0,00 | −100,00 | 0,00 | 0,0000 | |||||
| LLY / Eli Lilly and Company | 0,00 | −100,00 | 0,00 | 0,0000 |