Grundläggande statistik
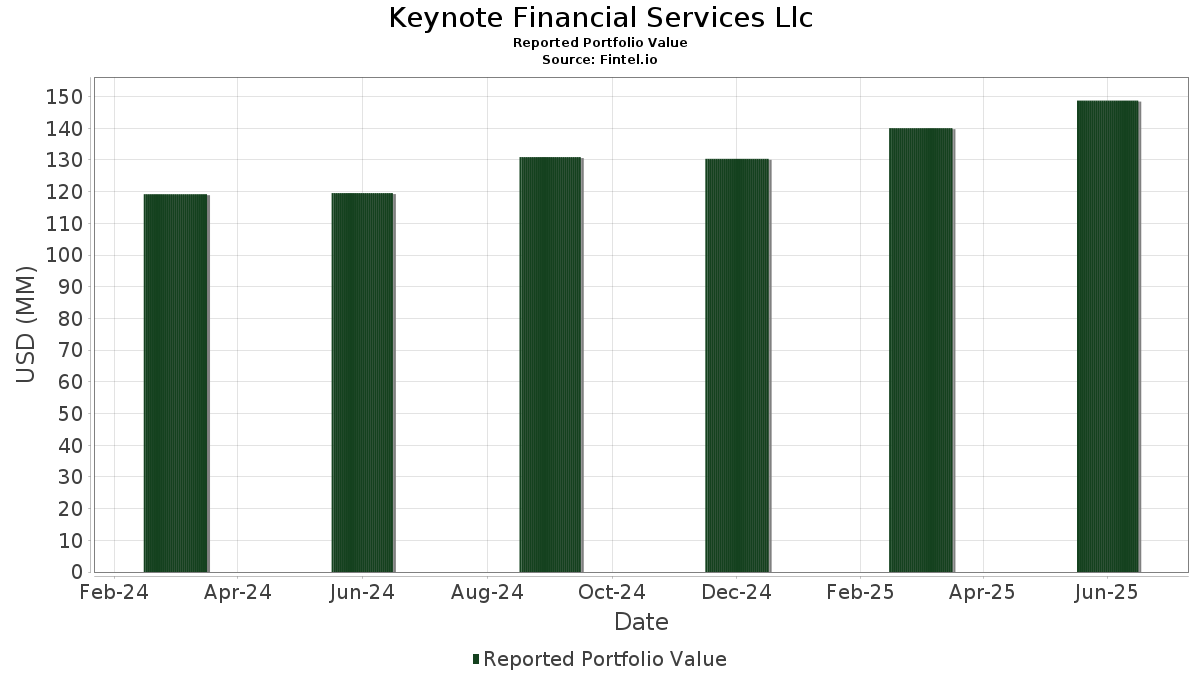
| Portföljvärde | $ 148 748 757 |
| Aktuella positioner | 162 |
Senaste innehav, resultat, förvaltat kapital (från 13F, 13D)
Keynote Financial Services Llc har redovisat 162 totala innehav i sina senaste SEC-arkiveringar. Det senaste portföljvärdet beräknas vara $ 148 748 757 USD. Faktiskt förvaltade tillgångar (AUM) är detta värde plus likvida medel (som inte redovisas). Keynote Financial Services Llcs största innehav är Apple Inc. (US:AAPL) , AbbVie Inc. (US:ABBV) , Microsoft Corporation (US:MSFT) , Berkshire Hathaway Inc. (US:BRK.B) , and RTX Corporation (US:RTX) . Keynote Financial Services Llcs nya positioner inkluderar Howard Hughes Holdings Inc. (US:HHH) , Super Micro Computer, Inc. (US:SMCI) , Lam Research Corporation (US:LRCX) , Easterly Government Properties, Inc. (US:DEA) , and Huntington Ingalls Industries, Inc. (US:HII) .
Största ökningarna detta kvartal
Vi använder förändringen i portföljallokeringen eftersom det är det mest meningsfulla måttet. Förändringar kan bero på transaktioner eller förändringar i aktiekurser.
| Värdepapper | Aktier (MM) |
Värde (MM$) |
Portfölj % av | ΔPortfölj % av |
|---|---|---|---|---|
| 0,06 | 2,78 | 1,8686 | 1,7196 | |
| 0,01 | 5,11 | 3,4371 | 0,6329 | |
| 0,01 | 0,71 | 0,4761 | 0,4761 | |
| 0,02 | 3,07 | 2,0647 | 0,3492 | |
| 0,01 | 1,55 | 1,0428 | 0,3475 | |
| 0,02 | 0,37 | 0,2467 | 0,2467 | |
| 0,01 | 4,59 | 3,0867 | 0,2304 | |
| 0,03 | 1,16 | 0,7788 | 0,1802 | |
| 0,01 | 0,80 | 0,5366 | 0,1694 | |
| 0,01 | 0,73 | 0,4888 | 0,1623 |
Största minskningarna detta kvartal
Vi använder förändringen i portföljallokeringen eftersom det är det mest meningsfulla måttet. Förändringar kan bero på transaktioner eller förändringar i aktiepriser.
| Värdepapper | Aktier (MM) |
Värde (MM$) |
Portfölj % av | ΔPortfölj % av |
|---|---|---|---|---|
| 0,04 | 7,59 | 5,1013 | −0,9932 | |
| 0,04 | 8,28 | 5,5663 | −0,8706 | |
| 0,03 | 1,49 | 0,9995 | −0,3865 | |
| 0,05 | 2,05 | 1,3759 | −0,2944 | |
| 0,01 | 2,16 | 1,4531 | −0,2056 | |
| 0,05 | 2,40 | 1,6118 | −0,1817 | |
| 0,03 | 2,06 | 1,3854 | −0,1809 | |
| 0,01 | 1,95 | 1,3100 | −0,1728 | |
| 0,04 | 1,05 | 0,7026 | −0,1634 | |
| 0,04 | 1,90 | 1,2797 | −0,1561 |
13F- och fond arkiveringar
Denna blankett lämnades in den 2025-08-07 för rapporteringsperioden 2025-06-30. Klicka på länksymbolen för att se hela transaktionshistoriken.
Uppgradera för att låsa upp premiumdata och exportera till Excel![]() .
.
| Värdepapper | Typ | Genomsnittligt aktiepris | Aktier (MM) |
ΔAktier (%) |
ΔAktier (%) |
Värde ($MM) |
Portfölj (%) |
ΔPortfölj (%) |
|
|---|---|---|---|---|---|---|---|---|---|
| AAPL / Apple Inc. | 0,04 | −0,56 | 8,28 | −8,15 | 5,5663 | −0,8706 | |||
| ABBV / AbbVie Inc. | 0,04 | 0,35 | 7,59 | −11,10 | 5,1013 | −0,9932 | |||
| MSFT / Microsoft Corporation | 0,01 | −1,75 | 5,11 | 30,18 | 3,4371 | 0,6329 | |||
| BRK.B / Berkshire Hathaway Inc. | 0,01 | 25,84 | 4,59 | 14,78 | 3,0867 | 0,2304 | |||
| RTX / RTX Corporation | 0,03 | −1,36 | 4,37 | 8,74 | 2,9371 | 0,0682 | |||
| ABT / Abbott Laboratories | 0,03 | −0,72 | 3,62 | 1,80 | 2,4361 | −0,1058 | |||
| T / AT&T Inc. | 0,11 | −2,74 | 3,23 | −0,49 | 2,1699 | −0,1458 | |||
| GOOGL / Alphabet Inc. | 0,02 | 12,17 | 3,07 | 27,85 | 2,0647 | 0,3492 | |||
| VUSB / Vanguard Bond Index Funds - Vanguard Ultra-Short Bond ETF | 0,06 | 1 231,90 | 2,78 | 1 236,06 | 1,8686 | 1,7196 | |||
| HTO / H2O America | 0,05 | 0,45 | 2,40 | −4,54 | 1,6118 | −0,1817 | |||
| PFE / Pfizer Inc. | 0,10 | 8,82 | 2,36 | 4,06 | 1,5844 | −0,0323 | |||
| PG / The Procter & Gamble Company | 0,01 | −0,47 | 2,16 | −6,93 | 1,4531 | −0,2056 | |||
| CVS / CVS Health Corporation | 0,03 | −7,73 | 2,06 | −6,06 | 1,3854 | −0,1809 | |||
| OXY / Occidental Petroleum Corporation | 0,05 | 2,80 | 2,05 | −12,53 | 1,3759 | −0,2944 | |||
| CRK / Comstock Resources, Inc. | 0,07 | −16,88 | 2,00 | 13,09 | 1,3421 | 0,0815 | |||
| INTC / Intel Corporation | 0,09 | 7,80 | 1,99 | 6,32 | 1,3348 | 0,0014 | |||
| MTB / M&T Bank Corporation | 0,01 | −0,97 | 1,98 | 7,48 | 1,3332 | 0,0156 | |||
| JNJ / Johnson & Johnson | 0,01 | 1,88 | 1,95 | −6,17 | 1,3100 | −0,1728 | |||
| VZ / Verizon Communications Inc. | 0,04 | −0,76 | 1,90 | −5,32 | 1,2797 | −0,1561 | |||
| MMM / 3M Company | 0,01 | −0,74 | 1,89 | 2,89 | 1,2676 | −0,0408 | |||
| JPM / JPMorgan Chase & Co. | 0,01 | −1,17 | 1,84 | 16,79 | 1,2394 | 0,1124 | |||
| AMZN / Amazon.com, Inc. | 0,01 | −3,83 | 1,76 | 10,85 | 1,1817 | 0,0499 | |||
| NVDA / NVIDIA Corporation | 0,01 | 9,27 | 1,55 | 59,40 | 1,0428 | 0,3475 | |||
| AMGN / Amgen Inc. | 0,01 | 12,29 | 1,51 | 0,67 | 1,0174 | −0,0565 | |||
| RAVI / FlexShares Trust - FlexShares Ultra-Short Income Fund | 0,02 | −3,10 | 1,51 | −3,21 | 1,0130 | −0,0984 | |||
| MO / Altria Group, Inc. | 0,03 | −1,17 | 1,49 | −3,50 | 1,0022 | −0,1004 | |||
| BMY / Bristol-Myers Squibb Company | 0,03 | 0,92 | 1,49 | −23,44 | 0,9995 | −0,3865 | |||
| LLY / Eli Lilly and Company | 0,00 | 0,79 | 1,48 | −4,88 | 0,9968 | −0,1161 | |||
| QCOM / QUALCOMM Incorporated | 0,01 | −2,99 | 1,48 | 0,55 | 0,9921 | −0,0556 | |||
| GILD / Gilead Sciences, Inc. | 0,01 | 0,00 | 1,37 | −1,08 | 0,9236 | −0,0678 | |||
| UNM / Unum Group | 0,02 | −8,34 | 1,32 | −9,13 | 0,8896 | −0,1501 | |||
| CAT / Caterpillar Inc. | 0,00 | −0,61 | 1,26 | 16,93 | 0,8457 | 0,0780 | |||
| SWKS / Skyworks Solutions, Inc. | 0,02 | −2,03 | 1,24 | 12,96 | 0,8328 | 0,0498 | |||
| PM / Philip Morris International Inc. | 0,01 | 0,75 | 1,22 | 15,57 | 0,8188 | 0,0665 | |||
| XOM / Exxon Mobil Corporation | 0,01 | −1,34 | 1,19 | −10,59 | 0,8005 | −0,1503 | |||
| MPC / Marathon Petroleum Corporation | 0,01 | −1,34 | 1,19 | 12,41 | 0,7986 | 0,0445 | |||
| MCD / McDonald's Corporation | 0,00 | 0,00 | 1,17 | −6,50 | 0,7835 | −0,1062 | |||
| DINO / HF Sinclair Corporation | 0,03 | 10,61 | 1,16 | 38,19 | 0,7788 | 0,1802 | |||
| MRK / Merck & Co., Inc. | 0,01 | 19,30 | 1,13 | 5,21 | 0,7610 | −0,0073 | |||
| BAC / Bank of America Corporation | 0,02 | −2,14 | 1,13 | 10,91 | 0,7590 | 0,0325 | |||
| IBM / International Business Machines Corporation | 0,00 | −3,93 | 1,12 | 13,99 | 0,7503 | 0,0505 | |||
| DUK / Duke Energy Corporation | 0,01 | 0,00 | 1,09 | −3,28 | 0,7341 | −0,0719 | |||
| LNC / Lincoln National Corporation | 0,03 | −2,52 | 1,07 | −6,06 | 0,7195 | −0,0942 | |||
| US9021041085 / II-VI, Inc. | 0,01 | −5,73 | 1,05 | 29,43 | 0,7071 | 0,1271 | |||
| KHC / The Kraft Heinz Company | 0,04 | 1,56 | 1,05 | −13,78 | 0,7026 | −0,1634 | |||
| KO / The Coca-Cola Company | 0,01 | −0,80 | 1,04 | −1,99 | 0,6961 | −0,0584 | |||
| LMT / Lockheed Martin Corporation | 0,00 | 0,55 | 1,02 | 4,31 | 0,6837 | −0,0129 | |||
| AMAT / Applied Materials, Inc. | 0,01 | −0,43 | 0,98 | 25,61 | 0,6565 | 0,1014 | |||
| DIS / The Walt Disney Company | 0,01 | −11,89 | 0,97 | 10,79 | 0,6489 | 0,0263 | |||
| CLF / Cleveland-Cliffs Inc. | 0,12 | 50,95 | 0,94 | 39,70 | 0,6293 | 0,1504 | |||
| ED / Consolidated Edison, Inc. | 0,01 | 0,00 | 0,91 | −9,25 | 0,6136 | −0,1046 | |||
| ULTA / Ulta Beauty, Inc. | 0,00 | −3,11 | 0,90 | 23,56 | 0,6070 | 0,0856 | |||
| MU / Micron Technology, Inc. | 0,01 | −2,23 | 0,89 | 38,69 | 0,5981 | 0,1400 | |||
| ALSN / Allison Transmission Holdings, Inc. | 0,01 | 0,00 | 0,88 | −0,68 | 0,5898 | −0,0411 | |||
| GOOG / Alphabet Inc. | 0,00 | 0,00 | 0,86 | 13,62 | 0,5778 | 0,0373 | |||
| LITE / Lumentum Holdings Inc. | 0,01 | 1,79 | 0,80 | 55,25 | 0,5366 | 0,1694 | |||
| CBOE / Cboe Global Markets, Inc. | 0,00 | 0,00 | 0,77 | 3,08 | 0,5175 | −0,0159 | |||
| CVX / Chevron Corporation | 0,01 | 1,71 | 0,76 | −12,88 | 0,5139 | −0,1130 | |||
| LKQ / LKQ Corporation | 0,02 | 10,39 | 0,74 | −4,04 | 0,4960 | −0,0525 | |||
| LYB / LyondellBasell Industries N.V. | 0,01 | 3,09 | 0,74 | −15,30 | 0,4951 | −0,1255 | |||
| WHR / Whirlpool Corporation | 0,01 | 2,95 | 0,73 | 15,80 | 0,4932 | 0,0410 | |||
| PEP / PepsiCo, Inc. | 0,01 | 80,56 | 0,73 | 59,08 | 0,4888 | 0,1623 | |||
| F / Ford Motor Company | 0,07 | −0,54 | 0,73 | 7,57 | 0,4878 | 0,0062 | |||
| HHH / Howard Hughes Holdings Inc. | 0,01 | 0,71 | 0,4761 | 0,4761 | |||||
| PSX / Phillips 66 | 0,01 | −0,60 | 0,69 | −4,01 | 0,4672 | −0,0495 | |||
| UPS / United Parcel Service, Inc. | 0,01 | 5,87 | 0,68 | −2,87 | 0,4553 | −0,0424 | |||
| MDT / Medtronic plc | 0,01 | −5,25 | 0,67 | −8,12 | 0,4494 | −0,0699 | |||
| AGQ / ProShares Trust II - ProShares Ultra Silver | 0,01 | −17,45 | 0,67 | −15,03 | 0,4486 | −0,1124 | |||
| TSN / Tyson Foods, Inc. | 0,01 | −2,40 | 0,66 | −14,45 | 0,4419 | −0,1067 | |||
| CSCO / Cisco Systems, Inc. | 0,01 | −5,43 | 0,66 | 6,33 | 0,4404 | 0,0005 | |||
| SMCI / Super Micro Computer, Inc. | 0,01 | 0,65 | 0,0000 | ||||||
| TSLA / Tesla, Inc. | 0,00 | −6,95 | 0,65 | 14,13 | 0,4344 | 0,0298 | |||
| CI / The Cigna Group | 0,00 | 0,00 | 0,64 | 0,63 | 0,4296 | −0,0245 | |||
| PYPL / PayPal Holdings, Inc. | 0,01 | 0,18 | 0,64 | 13,98 | 0,4281 | 0,0296 | |||
| WFC.PRZ / Wells Fargo & Company - Preferred Stock | 0,03 | 33,68 | 0,61 | 28,03 | 0,4115 | 0,0696 | |||
| STM / STMicroelectronics N.V. - Depositary Receipt (Common Stock) | 0,02 | −6,46 | 0,56 | 29,56 | 0,3771 | 0,0679 | |||
| LRCX / Lam Research Corporation | 0,01 | 0,56 | 0,0000 | ||||||
| URZ / Uranerz Energy Corp. | 0,31 | 19,13 | 0,56 | 67,17 | 0,3733 | 0,1356 | |||
| ES / Eversource Energy | 0,01 | 12,40 | 0,54 | 15,20 | 0,3618 | 0,0280 | |||
| VRTX / Vertex Pharmaceuticals Incorporated | 0,00 | 3,62 | 0,51 | −4,86 | 0,3427 | −0,0398 | |||
| WMT / Walmart Inc. | 0,00 | −12,64 | 0,49 | −2,80 | 0,3272 | −0,0300 | |||
| NEE / NextEra Energy, Inc. | 0,01 | 0,00 | 0,48 | −2,04 | 0,3226 | −0,0273 | |||
| HRL / Hormel Foods Corporation | 0,02 | 3,80 | 0,48 | 1,50 | 0,3195 | −0,0149 | |||
| O / Realty Income Corporation | 0,01 | 13,26 | 0,47 | 12,38 | 0,3176 | 0,0177 | |||
| TD / The Toronto-Dominion Bank | 0,01 | 0,00 | 0,46 | 22,49 | 0,3117 | 0,0415 | |||
| HIG / The Hartford Insurance Group, Inc. | 0,00 | 0,05 | 0,46 | 2,44 | 0,3111 | −0,0110 | |||
| CARR / Carrier Global Corporation | 0,01 | 0,00 | 0,46 | 15,37 | 0,3083 | 0,0246 | |||
| REGN / Regeneron Pharmaceuticals, Inc. | 0,00 | 39,07 | 0,46 | 15,11 | 0,3078 | 0,0238 | |||
| UL / Unilever PLC - Depositary Receipt (Common Stock) | 0,01 | 0,00 | 0,45 | 2,75 | 0,3023 | −0,0103 | |||
| HD / The Home Depot, Inc. | 0,00 | 0,00 | 0,45 | 0,00 | 0,3022 | −0,0186 | |||
| EMR / Emerson Electric Co. | 0,00 | 0,00 | 0,45 | 21,58 | 0,2998 | 0,0380 | |||
| PII / Polaris Inc. | 0,01 | 0,96 | 0,44 | 0,23 | 0,2955 | −0,0176 | |||
| SBDKP / Stanley Black & Decker Inc - 4.75% PRF PERPETUAL USD 100 | 0,01 | 1,70 | 0,43 | −10,35 | 0,2915 | −0,0540 | |||
| EBGEF / Enbridge Inc. - Preferred Stock | 0,01 | 0,00 | 0,43 | 2,16 | 0,2863 | −0,0110 | |||
| STZ / Constellation Brands, Inc. | 0,00 | 0,31 | 0,42 | −11,11 | 0,2802 | −0,0545 | |||
| SLV / iShares Silver Trust | 0,01 | 0,00 | 0,42 | 5,87 | 0,2790 | −0,0009 | |||
| VALE / Vale S.A. - Depositary Receipt (Common Stock) | 0,04 | −0,92 | 0,41 | −3,77 | 0,2748 | −0,0280 | |||
| GLD / SPDR Gold Trust | 0,00 | 0,00 | 0,41 | 5,73 | 0,2734 | −0,0011 | |||
| APD / Air Products and Chemicals, Inc. | 0,00 | 0,00 | 0,40 | −4,49 | 0,2721 | −0,0301 | |||
| R / Ryder System, Inc. | 0,00 | −2,80 | 0,40 | 7,49 | 0,2709 | 0,0032 | |||
| SFM / Sprouts Farmers Market, Inc. | 0,00 | 0,00 | 0,40 | 7,77 | 0,2705 | 0,0041 | |||
| CME / CME Group Inc. | 0,00 | 0,00 | 0,40 | 3,94 | 0,2665 | −0,0060 | |||
| SO / The Southern Company | 0,00 | 0,00 | 0,39 | 0,00 | 0,2616 | −0,0166 | |||
| PFF / iShares Trust - iShares Preferred and Income Securities ETF | 0,01 | −3,06 | 0,39 | −3,23 | 0,2616 | −0,0255 | |||
| TSCO / Tractor Supply Company | 0,01 | 0,00 | 0,39 | −4,21 | 0,2602 | −0,0284 | |||
| GIS / General Mills, Inc. | 0,01 | 6,02 | 0,38 | −8,15 | 0,2576 | −0,0402 | |||
| UNFI / United Natural Foods, Inc. | 0,02 | 0,00 | 0,38 | −14,92 | 0,2572 | −0,0638 | |||
| NGG / National Grid plc - Depositary Receipt (Common Stock) | 0,01 | 0,00 | 0,38 | 13,55 | 0,2537 | 0,0161 | |||
| COP / ConocoPhillips | 0,00 | 6,36 | 0,38 | −8,98 | 0,2522 | −0,0425 | |||
| DEA / Easterly Government Properties, Inc. | 0,02 | 0,37 | 0,2467 | 0,2467 | |||||
| FLO / Flowers Foods, Inc. | 0,02 | 90,10 | 0,36 | 59,56 | 0,2419 | 0,0811 | |||
| NDAQ / Nasdaq, Inc. | 0,00 | −7,30 | 0,34 | 9,32 | 0,2289 | 0,0064 | |||
| RMD / ResMed Inc. | 0,00 | 0,00 | 0,34 | 15,07 | 0,2263 | 0,0178 | |||
| WFC / Wells Fargo & Company | 0,00 | −2,96 | 0,33 | 8,25 | 0,2208 | 0,0043 | |||
| BA / The Boeing Company | 0,00 | 0,85 | 0,32 | 23,85 | 0,2169 | 0,0310 | |||
| HYGV / FlexShares Trust - FlexShares High Yield Value-Scored Bond Index Fund | 0,01 | −14,77 | 0,32 | −13,48 | 0,2164 | −0,0490 | |||
| PH / Parker-Hannifin Corporation | 0,00 | 0,00 | 0,32 | 15,16 | 0,2146 | 0,0162 | |||
| AMD / Advanced Micro Devices, Inc. | 0,00 | 0,00 | 0,31 | 38,33 | 0,2116 | 0,0489 | |||
| CAPITAL ONE FINL CORP / (14040H600) | 0,00 | 0,31 | 0,0000 | ||||||
| SPGI / S&P Global Inc. | 0,00 | −10,94 | 0,30 | −7,69 | 0,2021 | −0,0301 | |||
| ELV / Elevance Health, Inc. | 0,00 | −2,55 | 0,30 | −12,90 | 0,2000 | −0,0438 | |||
| V / Visa Inc. | 0,00 | −11,01 | 0,29 | −10,06 | 0,1929 | −0,0344 | |||
| KMI / Kinder Morgan, Inc. | 0,01 | 0,00 | 0,29 | 2,88 | 0,1926 | −0,0059 | |||
| WY / Weyerhaeuser Company | 0,01 | −2,86 | 0,27 | −14,83 | 0,1820 | −0,0448 | |||
| GRMN / Garmin Ltd. | 0,00 | 0,00 | 0,27 | −3,62 | 0,1789 | −0,0188 | |||
| AMT / American Tower Corporation | 0,00 | −5,97 | 0,26 | −4,40 | 0,1756 | −0,0197 | |||
| DOC / Healthpeak Properties, Inc. | 0,01 | 0,00 | 0,26 | −13,33 | 0,1750 | −0,0396 | |||
| GLW / Corning Incorporated | 0,00 | −3,57 | 0,26 | 10,87 | 0,1718 | 0,0071 | |||
| RBC / RBC Bearings Incorporated | 0,00 | 0,00 | 0,25 | 19,62 | 0,1687 | 0,0189 | |||
| OTIS / Otis Worldwide Corporation | 0,00 | −14,89 | 0,25 | −18,57 | 0,1686 | −0,0507 | |||
| GPK / Graphic Packaging Holding Company | 0,01 | 22,20 | 0,25 | −0,81 | 0,1659 | −0,0118 | |||
| DE / Deere & Company | 0,00 | 0,00 | 0,24 | 8,48 | 0,1634 | 0,0032 | |||
| AQNA / Algonquin Power & Utilities Corp - FXDFR NT REDEEM 17/10/2078 USD 25 | 0,04 | −3,50 | 0,24 | 7,73 | 0,1594 | 0,0020 | |||
| HII / Huntington Ingalls Industries, Inc. | 0,00 | 0,23 | 0,1573 | 0,1573 | |||||
| CAH / Cardinal Health, Inc. | 0,00 | −18,29 | 0,23 | −0,43 | 0,1569 | −0,0104 | |||
| WPC / W. P. Carey Inc. | 0,00 | 0,00 | 0,23 | −1,28 | 0,1556 | −0,0116 | |||
| GE / General Electric Company | 0,00 | 0,23 | 0,1521 | 0,1521 | |||||
| BGC / BGC Group, Inc. | 0,02 | −17,12 | 0,23 | −7,38 | 0,1520 | −0,0226 | |||
| CALM / Cal-Maine Foods, Inc. | 0,00 | 0,00 | 0,22 | 9,45 | 0,1482 | 0,0046 | |||
| ALLY.PRA / GMAC Capital Trust I | 0,01 | −5,30 | 0,22 | 0,92 | 0,1478 | −0,0074 | |||
| MDLZ / Mondelez International, Inc. | 0,00 | −8,42 | 0,22 | −8,82 | 0,1460 | −0,0244 | |||
| EXPE / Expedia Group, Inc. | 0,00 | −12,36 | 0,22 | −12,20 | 0,1455 | −0,0302 | |||
| DG / Dollar General Corporation | 0,00 | 0,21 | 0,1439 | 0,1439 | |||||
| SOUN / SoundHound AI, Inc. | 0,02 | 50,64 | 0,21 | 99,07 | 0,1438 | 0,0671 | |||
| SITE / SiteOne Landscape Supply, Inc. | 0,00 | 5,39 | 0,21 | 5,00 | 0,1415 | −0,0017 | |||
| RGA / Reinsurance Group of America, Incorporated | 0,00 | 0,21 | 0,1411 | 0,1411 | |||||
| DVN / Devon Energy Corporation | 0,01 | 0,00 | 0,21 | −14,75 | 0,1399 | −0,0348 | |||
| COST / Costco Wholesale Corporation | 0,00 | −19,53 | 0,20 | −16,12 | 0,1371 | −0,0358 | |||
| TFC / Truist Financial Corporation | 0,00 | −8,90 | 0,20 | −5,14 | 0,1370 | −0,0159 | |||
| FDX / FedEx Corporation | 0,00 | −10,05 | 0,20 | −16,12 | 0,1368 | −0,0364 | |||
| IVZ / Invesco Ltd. | 0,01 | −2,87 | 0,19 | 1,09 | 0,1245 | −0,0065 | |||
| BBAI / BigBear.ai Holdings, Inc. | 0,03 | 43,40 | 0,18 | 243,40 | 0,1229 | 0,0846 | |||
| HBI / Hanesbrands Inc. | 0,04 | −17,41 | 0,18 | −34,80 | 0,1203 | −0,0746 | |||
| MVST / Microvast Holdings, Inc. | 0,05 | −2,42 | 0,17 | 203,64 | 0,1128 | 0,0732 | |||
| VTRS / Viatris Inc. | 0,02 | 0,00 | 0,16 | 2,63 | 0,1050 | −0,0038 | |||
| MPW / Medical Properties Trust, Inc. | 0,03 | −8,26 | 0,13 | −34,52 | 0,0871 | −0,0540 | |||
| LYG / Lloyds Banking Group plc - Depositary Receipt (Common Stock) | 0,02 | 0,00 | 0,10 | 10,75 | 0,0697 | 0,0032 | |||
| SENS / Senseonics Holdings, Inc. | 0,21 | 1 120,18 | 0,10 | 800,00 | 0,0667 | 0,0587 | |||
| SWBI / Smith & Wesson Brands, Inc. | 0,01 | 0,00 | 0,10 | −6,86 | 0,0639 | −0,0090 | |||
| NWL / Newell Brands Inc. | 0,01 | −5,31 | 0,08 | −17,89 | 0,0528 | −0,0152 | |||
| CELU / Celularity Inc. | 0,02 | −6,17 | 0,05 | 6,98 | 0,0309 | 0,0000 | |||
| LCID / Lucid Group, Inc. | 0,02 | 0,03 | 0,0234 | 0,0234 | |||||
| FLG / Flagstar Financial, Inc. | 0,00 | −100,00 | 0,00 | 0,0000 | |||||
| KMB / Kimberly-Clark Corporation | 0,00 | −100,00 | 0,00 | 0,0000 | |||||
| DEA / Easterly Government Properties, Inc. | 0,00 | −100,00 | 0,00 | 0,0000 | |||||
| BSV / Vanguard Bond Index Funds - Vanguard Short-Term Bond ETF | 0,00 | −100,00 | 0,00 | 0,0000 |