Grundläggande statistik
| Institutionella ägare | 222 total, 222 long only, 0 short only, 0 long/short - change of 8,25% MRQ |
| Genomsnittlig portföljallokering | 0.4420 % - change of 4,56% MRQ |
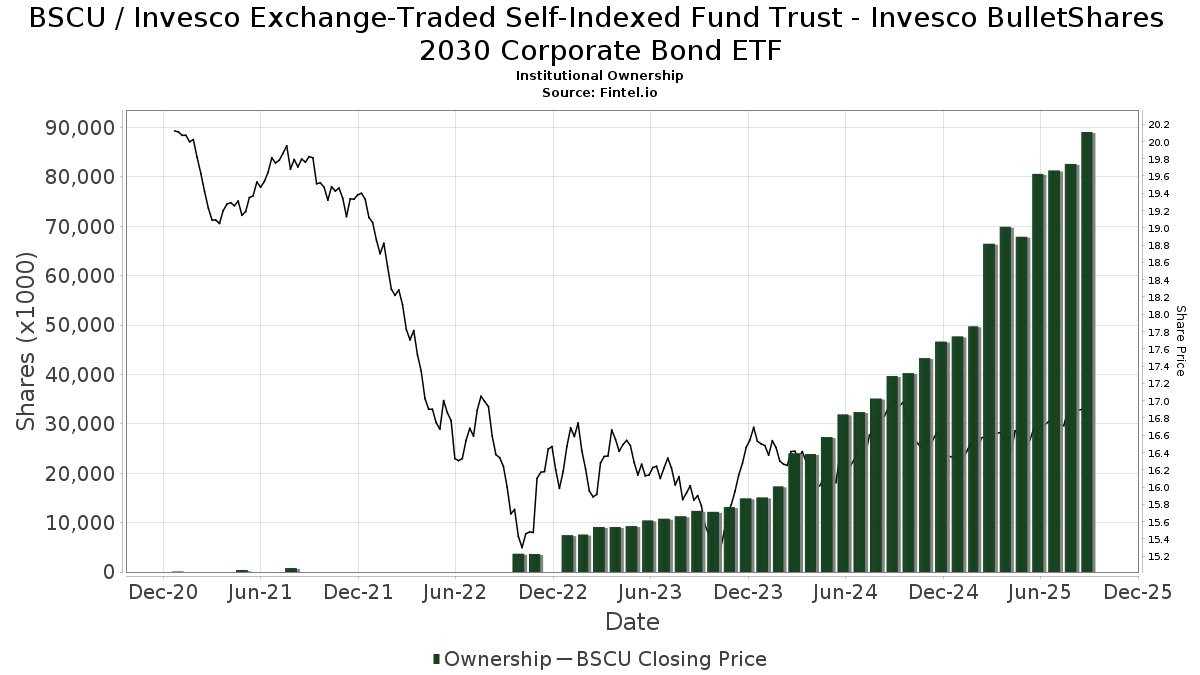
| Institutionella aktier (lång) | 89 113 651 (ex 13D/G) - change of 8,49MM shares 10,53% MRQ |
| Institutionellt värde (lång) | $ 1 439 984 USD ($1000) |
Institutionellt ägande och aktieägare
Invesco Exchange-Traded Self-Indexed Fund Trust - Invesco BulletShares 2030 Corporate Bond ETF (US:BSCU) har 222 Institutionella ägare och aktieägare som har lämnat in 13D/G- eller 13F-formulär till Securities Exchange Commission (SEC). Dessa institut innehar totalt 89,113,651 aktier. Största aktieägare inkluderar Aptus Capital Advisors, LLC, DRSK - Aptus Defined Risk ETF, Morgan Stanley, Lido Advisors, LLC, Raymond James Financial Inc, TruWealth Advisors, LLC, Invesco Ltd., Hartland & Co., LLC, Wells Fargo & Company/mn, and LPL Financial LLC .
Invesco Exchange-Traded Self-Indexed Fund Trust - Invesco BulletShares 2030 Corporate Bond ETF (NasdaqGM:BSCU) Institutionell ägarstruktur visar institutioners och fonders nuvarande positioner i företaget, samt de senaste förändringarna i positionernas storlek. Större aktieägare kan vara enskilda investerare, fonder, hedgefonder eller institutioner. Bilaga 13D visar att investeraren äger (eller ägde) mer än 5% av företaget och avser (eller avsåg) att aktivt eftersträva en förändring av affärsstrategin. Schedule 13G indikerar en passiv investering på över 5%.
The share price as of September 17, 2025 is 17,00 / share. Previously, on September 18, 2024, the share price was 17,02 / share. This represents a decline of 0,12% over that period.
Fondsentimentets poäng
Fondsentimentet poängen(fka Ägarackumulation-poäng) visar vilka aktier som är mest köpta av fonder. Det är resultatet av en sofistikerad kvantitativ flerfaktormodell som identifierar företag med de högsta nivåerna av institutionell ackumulering. Poängsättningsmodellen använder en kombination av den totala ökningen av redovisade ägare, förändringarna i portföljallokeringarna för dessa ägare och andra mått. Siffran sträcker sig från 0 till 100, där högre siffror indikerar en högre nivå av ackumulering i förhållande till sina konkurrenter, och 50 är genomsnittet.
Uppdateringsfrekvens: Dagligen
Se Ownership Explorer, som innehåller en lista över de högst rankade företagen.
Institutionell sälj/köp-kvot
Förutom att rapportera vanliga eget kapital- och skuldemissioner måste institutioner med mer än 100MM tillgångar under förvaltning också avslöja sina innehav av sälj- och köpoptioner. Eftersom säljoptioner i allmänhet indikerar ett negativt sentiment och köpoptioner indikerar ett positivt sentiment, kan vi få en uppfattning om det övergripande institutionella sentimentet genom att plotta förhållandet mellan säljoptioner och köpoptioner. Diagrammet till höger visar det historiska förhållandet mellan sälj- och köpoptioner för detta instrument.
Genom att använda sälj/köp-kvoten som en indikator på aktieägarnas sentiment undviker man en av de största bristerna med att använda det totala institutionella ägandet, nämligen att en betydande del av de förvaltade tillgångarna investeras passivt för att följa index. Passivt förvaltade fonder köper vanligtvis inte optioner, så indikatorn för sälj/köp-kvoten ger en bättre bild av stämningen i aktivt förvaltade fonder.
13F- och NPORT-arkiveringar
Detaljer om 13F-arkiveringar är gratis. Detaljer om NP-arkiveringar kräver ett premiummedlemskap. Gröna rader indikerar nya positioner. Röda rader indikerar stängda positioner. Klicka på länk symbolen för att se hela transaktionshistoriken.
Uppgradera
för att låsa upp premiumdata och exportera till Excel ![]() .
.
| Fil Datum | Källa | Investerare | Typ | Genomsnittligt pris (beräknat) |
Aktier | Δ Aktier (%) |
Rapporterat värde (1000 USD) |
Δ Värde (%) |
Portföljallokering (%) |
|
|---|---|---|---|---|---|---|---|---|---|---|
| 2025-07-24 | 13F | Eastern Bank | 24 500 | −79,62 | 411 | −79,39 | ||||
| 2025-07-23 | 13F | Country Club Bank /gfn | 249 717 | −4,65 | 4 183 | −3,77 | ||||
| 2025-08-12 | 13F | Private Management Group Inc | 31 157 | −1,42 | 523 | −0,38 | ||||
| 2025-08-12 | 13F | Proequities, Inc. | 0 | 0 | ||||||
| 2025-05-13 | 13F | Bokf, Na | 0 | −100,00 | 0 | |||||
| 2025-08-07 | 13F | Davis R M Inc | 370 672 | 55,98 | 6 220 | 57,76 | ||||
| 2025-07-28 | 13F | Harbour Investments, Inc. | 34 774 | 0,99 | 584 | 2,10 | ||||
| 2025-08-01 | 13F | Envestnet Asset Management Inc | 1 601 990 | 4,25 | 26 881 | 5,44 | ||||
| 2025-05-02 | 13F | Cullen/frost Bankers, Inc. | 0 | −100,00 | 0 | |||||
| 2025-08-05 | 13F | Ellevest, Inc. | 99 941 | 1,98 | 1 677 | 3,20 | ||||
| 2025-08-14 | 13F | Integrated Wealth Concepts LLC | 34 368 | −21,27 | 577 | −20,44 | ||||
| 2025-07-14 | 13F | CRA Financial Services, LLC | 49 960 | 2,04 | 838 | 3,20 | ||||
| 2025-08-07 | 13F | Fountainhead AM, LLC | 15 653 | 0,00 | 263 | 1,16 | ||||
| 2025-08-13 | 13F | VestGen Advisors, LLC | 65 154 | 48,12 | 1 099 | 50,75 | ||||
| 2025-08-14 | 13F | Wiley Bros.-aintree Capital, Llc | 160 585 | 48,05 | 2 695 | 49,67 | ||||
| 2025-08-12 | 13F | Wayfinding Financial, LLC | 0 | −100,00 | 0 | |||||
| 2025-08-01 | 13F | Redmond Asset Management, LLC | 17 653 | 15,85 | 296 | 17,46 | ||||
| 2025-08-08 | 13F | Cetera Investment Advisers | 79 831 | 45,24 | 1 340 | 46,98 | ||||
| 2025-07-22 | 13F | Marietta Wealth Management, LLC | 386 136 | 1,77 | 6 479 | 2,94 | ||||
| 2025-05-15 | 13F | Old Mission Capital Llc | 0 | −100,00 | 0 | |||||
| 2025-08-12 | 13F | Allen Capital Group, LLC | 35 087 | 7,83 | 589 | 9,09 | ||||
| 2025-08-14 | 13F | Vista Investment Management | 438 658 | 0,27 | 7 361 | 1,42 | ||||
| 2025-08-14 | 13F | Warren Averett Asset Management, LLC | 23 228 | 3,52 | 390 | 4,57 | ||||
| 2025-08-11 | 13F | HighTower Advisors, LLC | 34 423 | 40,38 | 578 | 42,12 | ||||
| 2025-08-11 | 13F | Aptus Capital Advisors, LLC | 7 931 126 | 6,40 | 133 084 | 7,62 | ||||
| 2025-07-23 | 13F | Sax Wealth Advisors, Llc | 34 812 | 22,04 | 584 | 23,47 | ||||
| 2025-04-28 | 13F | Private Trust Co Na | 0 | −100,00 | 0 | |||||
| 2025-08-12 | 13F | Kohmann Bosshard Financial Services, LLC | 38 077 | 0,67 | 639 | 1,75 | ||||
| 2025-07-29 | 13F | Wingate Wealth Advisors, Inc. | 11 463 | 1,19 | 192 | 2,67 | ||||
| 2025-08-07 | 13F | Kestra Private Wealth Services, Llc | 78 826 | 74,88 | 1 323 | 76,97 | ||||
| 2025-07-23 | 13F | Waycross Investment Management Co | 396 405 | −0,26 | 6 652 | 0,88 | ||||
| 2025-07-17 | 13F | Janney Montgomery Scott LLC | 507 039 | −13,86 | 9 | −11,11 | ||||
| 2025-09-04 | 13F/A | Advisor Group Holdings, Inc. | 471 489 | 3,30 | 7 912 | 4,48 | ||||
| 2025-07-11 | 13F | Farther Finance Advisors, LLC | 11 807 | 1 586,71 | 198 | 1 700,00 | ||||
| 2025-07-21 | 13F | Ameritas Advisory Services, LLC | 326 | 5 | ||||||
| 2025-07-23 | 13F | Opulen Financial Group LLC | 144 540 | 6,67 | 2 425 | 7,92 | ||||
| 2025-07-15 | 13F | Accurate Wealth Management, LLC | 14 708 | 246 | ||||||
| 2025-07-28 | 13F | Tlwm | 1 648 405 | 0,52 | 27 660 | 1,68 | ||||
| 2025-07-22 | 13F | Siligmueller & Norvid Wealth Advisors LLC | 24 955 | −55,75 | 417 | −55,51 | ||||
| 2025-08-12 | 13F | O'shaughnessy Asset Management, Llc | 4 219 | 71 | ||||||
| 2025-08-13 | 13F | Northwestern Mutual Wealth Management Co | 84 223 | 42,64 | 1 413 | 44,33 | ||||
| 2025-07-15 | 13F | Marquette Asset Management, LLC | 5 219 | 0,00 | 88 | 1,16 | ||||
| 2025-07-08 | 13F | Everpar Advisors Llc | 33 154 | 67,61 | 556 | 69,51 | ||||
| 2025-08-08 | 13F | Advisors Capital Management, LLC | 865 124 | 0,05 | 14 517 | 1,20 | ||||
| 2025-08-14 | 13F | Ameriprise Financial Inc | 279 595 | 65,45 | 4 692 | 67,30 | ||||
| 2025-07-16 | 13F | West Branch Capital LLC | 1 060 | 0,00 | 18 | 0,00 | ||||
| 2025-08-14 | 13F | Diversify Advisory Services, LLC | 17 211 | 290 | ||||||
| 2025-08-08 | 13F | Smithfield Trust Co | 1 261 | −6,04 | 0 | |||||
| 2025-08-13 | 13F | Flow Traders U.s. Llc | 0 | −100,00 | 0 | |||||
| 2025-07-23 | 13F | ETF Portfolio Partners, Inc. | 12 191 | 0,00 | 205 | 0,99 | ||||
| 2025-07-09 | 13F | Dynamic Advisor Solutions LLC | 32 264 | 24,74 | 541 | 26,11 | ||||
| 2025-07-15 | 13F | First City Capital Management, Inc. | 33 633 | −0,98 | 564 | 0,18 | ||||
| 2025-08-14 | 13F | EP Wealth Advisors, Inc. | 37 553 | 0,00 | 630 | 1,12 | ||||
| 2025-07-31 | 13F | Darden Wealth Group Inc | 12 000 | 201 | ||||||
| 2025-08-12 | 13F | Jpmorgan Chase & Co | 217 054 | 2 505,69 | 3 642 | 2 539,13 | ||||
| 2025-05-14 | 13F | Oarsman Capital, Inc. | 0 | −100,00 | 0 | |||||
| 2025-08-14 | 13F | Susquehanna International Group, Llp | 72 226 | 1 212 | ||||||
| 2025-04-23 | 13F | Field & Main Bank | 0 | −100,00 | 0 | |||||
| 2025-08-13 | 13F | Colonial Trust Advisors | 142 080 | 20,30 | 2 384 | 21,69 | ||||
| 2025-07-17 | 13F | Nelson, Van Denburg & Campbell Wealth Management Group, LLC | 69 978 | 128,16 | 1 174 | 131,10 | ||||
| 2025-08-08 | 13F | IMA Wealth, Inc. | 1 312 174 | 5,26 | 22 018 | 6,47 | ||||
| 2025-08-01 | 13F | Rossby Financial, LCC | 1 456 | 0,00 | 24 | 0,00 | ||||
| 2025-08-12 | 13F | Waterloo Capital, L.P. | 14 609 | −1,30 | 245 | 0,00 | ||||
| 2025-08-15 | 13F | Kestra Advisory Services, LLC | 26 038 | 24,39 | 437 | 25,65 | ||||
| 2025-08-13 | 13F | Capital Analysts, Inc. | 31 856 | 4,64 | 1 | |||||
| 2025-08-14 | 13F | Comerica Bank | 34 494 | −25,50 | 579 | −24,74 | ||||
| 2025-05-14 | 13F | Richmond Investment Services, LLC | 0 | −100,00 | 0 | |||||
| 2025-07-21 | 13F | Empirical Financial Services, LLC d.b.a. Empirical Wealth Management | 190 900 | 3,23 | 3 203 | 4,43 | ||||
| 2025-08-13 | 13F | Farnam Financial LLC | 161 120 | 36,81 | 2 704 | 38,40 | ||||
| 2025-08-06 | 13F | Prospera Financial Services Inc | 14 157 | 0,79 | 238 | 1,72 | ||||
| 2025-07-10 | 13F | Redhawk Wealth Advisors, Inc. | 24 175 | −3,06 | 406 | −1,94 | ||||
| 2025-08-05 | 13F | Hills Bank & Trust Co | 2 140 405 | 6,34 | 35 916 | 7,56 | ||||
| 2025-05-13 | 13F | United Capital Financial Advisers, Llc | 0 | −100,00 | 0 | |||||
| 2025-08-08 | 13F | Pnc Financial Services Group, Inc. | 3 555 | −14,87 | 60 | −14,49 | ||||
| 2025-07-30 | 13F | Cookson Peirce & Co Inc | 591 861 | 0,31 | 9 931 | 1,46 | ||||
| 2025-08-25 | 13F | Silverlake Wealth Management Llc | 32 858 | 75,06 | 551 | 77,17 | ||||
| 2025-08-05 | 13F | Prosperity Wealth Management, Inc. | 12 430 | 209 | ||||||
| 2025-07-10 | 13F | NorthCrest Asset Manangement, LLC | 300 969 | −1,19 | 5 038 | −0,30 | ||||
| 2025-07-23 | 13F | BankPlus Trust Department | 605 | 0,00 | 10 | 0,00 | ||||
| 2025-08-14 | 13F | UBS Group AG | 1 351 895 | 5,13 | 22 685 | 6,34 | ||||
| 2025-07-24 | 13F | IFP Advisors, Inc | 3 292 | 45,66 | 55 | 48,65 | ||||
| 2025-08-01 | 13F | Paradigm, Strategies in Wealth Management, LLC | 14 958 | 0,00 | 251 | 0,81 | ||||
| 2025-08-01 | 13F | Koss-Olinger Consulting, LLC | 10 409 | 175 | ||||||
| 2025-04-11 | 13F | Davis Capital Management | 12 196 | 0,11 | 202 | 1,51 | ||||
| 2025-08-14 | 13F | Smartleaf Asset Management LLC | 110 973 | −0,42 | 1 859 | 0,49 | ||||
| 2025-07-23 | 13F | Ironwood Financial, llc | 80 552 | 0,00 | 1 336 | 0,00 | ||||
| 2025-08-12 | 13F | Heritage Trust Co | 40 063 | 67,10 | 672 | 69,27 | ||||
| 2025-08-14 | 13F | GWM Advisors LLC | 123 502 | 34,17 | 2 072 | 35,69 | ||||
| 2025-04-17 | 13F | Sagespring Wealth Partners, Llc | 0 | −100,00 | 0 | |||||
| 2025-07-15 | 13F | SJS Investment Consulting Inc. | 3 913 | 0,00 | 66 | 1,56 | ||||
| 2025-08-13 | 13F | Jones Financial Companies Lllp | 247 813 | 44,95 | 4 151 | 46,28 | ||||
| 2025-08-11 | 13F | Nations Financial Group Inc, /ia/ /adv | 11 357 | 0,11 | 191 | 1,06 | ||||
| 2025-07-08 | 13F | Nbc Securities, Inc. | 45 925 | −3,53 | 1 | |||||
| 2025-07-22 | 13F | Knights of Columbus Asset Advisors LLC | 3 974 | 0,00 | 67 | 1,54 | ||||
| 2025-08-12 | 13F | Ameritas Investment Partners, Inc. | 341 | −55,48 | 6 | −58,33 | ||||
| 2025-08-04 | 13F | ArborFi Advisors, LLC | 69 684 | 5,93 | 1 169 | 7,15 | ||||
| 2025-07-29 | 13F | Stephens Inc /ar/ | 198 908 | 6,40 | 3 338 | 7,61 | ||||
| 2025-08-11 | 13F | Private Advisor Group, LLC | 175 398 | −30,89 | 2 943 | −30,10 | ||||
| 2025-03-25 | 13F | Higgins & Schmidt Wealth Strategies LLC | 0 | −100,00 | 0 | −100,00 | ||||
| 2025-08-13 | 13F | Colonial Trust Co / SC | 105 675 | 21,84 | 1 773 | 23,30 | ||||
| 2025-08-13 | 13F | Baird Financial Group, Inc. | 857 374 | 8,67 | 14 387 | 9,91 | ||||
| 2025-07-31 | 13F | Insight Wealth Partners, LLC | 15 523 | 8,48 | 260 | 9,70 | ||||
| 2025-08-19 | 13F | Asset Dedication, LLC | 459 417 | 3,63 | 7 709 | 4,83 | ||||
| 2025-08-13 | 13F | River Wealth Advisors LLC | 69 249 | −1,16 | 1 162 | −0,09 | ||||
| 2025-05-12 | 13F | Aveo Capital Partners, LLC | 0 | −100,00 | 0 | |||||
| 2025-07-31 | 13F | Carnegie Capital Asset Management, LLC | 172 708 | 6,11 | 2 898 | 7,85 | ||||
| 2025-08-08 | 13F | Hartland & Co., LLC | 3 123 056 | 2,37 | 52 405 | 3,54 | ||||
| 2025-07-07 | 13F | Horizons Wealth Management | 217 042 | 0,48 | 3 642 | 1,62 | ||||
| 2025-07-17 | 13F | Sound Income Strategies, LLC | 1 | 0 | ||||||
| 2025-08-08 | 13F | Sawgrass Asset Management Llc | 90 202 | −4,72 | 1 514 | −3,63 | ||||
| 2025-07-29 | 13F | Novare Capital Management Llc | 177 723 | 3,21 | 2 982 | 4,41 | ||||
| 2025-08-07 | 13F | Meridian Financial Partners LLC | 21 905 | 0,00 | 0 | |||||
| 2025-07-22 | 13F | Kickstand Ventures, Llc. | 15 093 | 253 | ||||||
| 2025-07-22 | 13F | Duncan Williams Asset Management, LLC | 15 093 | 253 | ||||||
| 2025-07-24 | 13F | Coordinated Financial Services, Inc. | 57 601 | 75,40 | 967 | 79,89 | ||||
| 2025-07-15 | 13F | Legacy Financial Group LLC | 13 524 | 1,20 | 227 | 2,26 | ||||
| 2025-07-17 | 13F | Independence Bank of Kentucky | 64 421 | 2,69 | 1 081 | 3,85 | ||||
| 2025-08-12 | 13F | Kaye Capital Management | 346 069 | 5,06 | 5 807 | 6,28 | ||||
| 2025-07-15 | 13F | Unified Investment Management | 11 900 | 0,00 | 200 | 1,02 | ||||
| 2025-08-15 | 13F | Equitable Holdings, Inc. | 26 837 | 0,42 | 450 | 1,58 | ||||
| 2025-07-08 | 13F | Dover Advisors, Llc | 47 882 | −2,36 | 803 | −1,23 | ||||
| 2025-08-08 | 13F | Avantax Advisory Services, Inc. | 79 067 | 37,01 | 1 327 | 38,56 | ||||
| 2025-08-08 | 13F | Larson Financial Group LLC | 18 707 | −4,66 | 314 | −3,69 | ||||
| 2025-08-01 | 13F | Capital Investment Counsel, LLC | 671 089 | 55,78 | 11 261 | 57,57 | ||||
| 2025-07-25 | 13F | Bill Few Associates, Inc. | 12 125 | 0,00 | 203 | 1,00 | ||||
| 2025-07-29 | 13F | Latitude Advisors, LLC | 10 328 | −32,01 | 173 | −31,35 | ||||
| 2025-08-12 | 13F | Laurel Wealth Advisors LLC | 164 584 | 1 583,04 | 10 | −94,44 | ||||
| 2025-08-13 | 13F | Lido Advisors, LLC | 4 765 827 | 14,47 | 79 971 | 15,78 | ||||
| 2025-05-16 | 13F | Coordinated Financial Services, Inc./CO | 47 213 | 86,33 | 783 | 90,05 | ||||
| 2025-05-12 | 13F | Independent Advisor Alliance | 0 | −100,00 | 0 | |||||
| 2025-08-12 | 13F | Global Retirement Partners, LLC | 794 | 0,00 | 13 | 8,33 | ||||
| 2025-07-25 | 13F | Cwm, Llc | 807 432 | 0,47 | 14 | 0,00 | ||||
| 2025-08-01 | 13F | Motley Fool Wealth Management, LLC | 1 752 487 | −9,67 | 29 407 | −8,63 | ||||
| 2025-07-08 | 13F | Apella Capital, LLC | 36 060 | −3,92 | 603 | −2,90 | ||||
| 2025-08-06 | 13F | Atlantic Union Bankshares Corp | 1 921 579 | 7,35 | 32 241 | 8,57 | ||||
| 2025-05-13 | 13F | Forefront Analytics, LLC | 0 | −100,00 | 0 | |||||
| 2025-07-01 | 13F | Legacy Wealth Management, LLC / MS | 14 672 | 246 | ||||||
| 2025-07-10 | 13F | Sterling Financial Group, Inc. | 12 441 | −9,70 | 209 | −8,77 | ||||
| 2025-07-17 | 13F | Hengehold Capital Management Llc | 1 981 223 | 27,70 | 33 245 | 29,16 | ||||
| 2025-08-14 | 13F | Modern Wealth Management, LLC | 346 069 | 5 807 | ||||||
| 2025-09-09 | 13F | Cambridge Financial Group, LLC | 15 260 | 0,00 | 256 | 1,19 | ||||
| 2025-06-27 | NP | DRSK - Aptus Defined Risk ETF | 7 587 866 | 9,52 | 126 338 | 11,06 | ||||
| 2025-07-14 | 13F | Oliver Luxxe Assets LLC | 31 437 | 26,76 | 528 | 28,22 | ||||
| 2025-07-29 | 13F | Angeles Wealth Management, Llc | 2 336 | 39 | ||||||
| 2025-08-14 | 13F | Royal Bank Of Canada | 1 287 363 | 12,43 | 21 602 | 13,72 | ||||
| 2025-04-01 | 13F | Cornerstone Planning, LLC | 107 300 | 1 757 | ||||||
| 2025-07-09 | 13F | Sarver Vrooman Wealth Advisors | 3 642 | 0,00 | 61 | 1,67 | ||||
| 2025-07-07 | 13F | TruWealth Advisors, LLC | 3 883 937 | 14,39 | 65 172 | 15,70 | ||||
| 2025-07-08 | 13F | Red Spruce Capital, LLC | 71 935 | 13,80 | 1 207 | 15,17 | ||||
| 2025-08-01 | 13F | Gwn Securities Inc. | 0 | −100,00 | 0 | |||||
| 2025-08-14 | 13F | Goldman Sachs Group Inc | 15 230 | 0,00 | 256 | 1,19 | ||||
| 2025-08-14 | 13F | Wilkins Miller Wealth Management, LLC | 251 492 | 4,10 | 4 220 | 5,32 | ||||
| 2025-08-15 | 13F | Keel Point, LLC | 22 949 | 0,00 | 385 | 1,32 | ||||
| 2025-07-08 | 13F | Legacy Private Trust Co. | 71 176 | −5,21 | 1 194 | −4,10 | ||||
| 2025-08-04 | 13F | Atria Investments Llc | 159 901 | 5,38 | 2 683 | 6,60 | ||||
| 2025-08-07 | 13F | Addison Advisors LLC | 285 094 | 6,86 | 4 784 | 8,07 | ||||
| 2025-07-29 | 13F | Stratos Wealth Partners, LTD. | 0 | −100,00 | 0 | |||||
| 2025-08-12 | 13F | YANKCOM Partnership | 12 200 | 24,49 | 205 | 25,93 | ||||
| 2025-08-14 | 13F | Aqr Capital Management Llc | 38 912 | −4,41 | 653 | −3,41 | ||||
| 2025-08-08 | 13F | Creative Planning | 26 719 | 34,83 | 448 | 36,59 | ||||
| 2025-07-18 | 13F | Truist Financial Corp | 599 214 | 0,99 | 10 055 | 2,14 | ||||
| 2025-08-06 | 13F | Nicholas Hoffman & Company, LLC. | 10 940 | 0,00 | 184 | 1,10 | ||||
| 2025-08-14 | 13F | Citadel Advisors Llc | 184 850 | 197,64 | 3 102 | 201,07 | ||||
| 2025-08-18 | 13F | Geneos Wealth Management Inc. | 270 943 | 974,49 | 4 546 | 987,56 | ||||
| 2025-07-24 | 13F | Reuter James Wealth Management, Llc | 34 453 | 578 | ||||||
| 2025-07-11 | 13F | AA Financial Advisors, LLC | 31 250 | −50,85 | 524 | −50,28 | ||||
| 2025-08-14 | 13F | TCG Advisory Services, LLC | 410 340 | 0,48 | 6 886 | 1,64 | ||||
| 2025-08-14 | 13F | Foronjy Financial Llc | 808 764 | 13 571 | ||||||
| 2025-08-14 | 13F | Jane Street Group, Llc | 86 288 | −75,76 | 1 448 | −75,50 | ||||
| 2025-08-14 | 13F | Wells Fargo & Company/mn | 2 970 811 | 3,21 | 49 850 | 4,39 | ||||
| 2025-07-15 | 13F | BCS Wealth Management | 270 785 | 9,73 | 5 | 0,00 | ||||
| 2025-07-21 | 13F | Crews Bank & Trust | 1 650 | 28 | ||||||
| 2025-07-10 | 13F | Wealth Enhancement Advisory Services, Llc | 164 369 | 7,71 | 2 752 | 8,69 | ||||
| 2025-07-11 | 13F | Butensky & Cohen Financial Security, Inc | 80 101 | 3,38 | 1 344 | 4,59 | ||||
| 2025-08-05 | 13F | Sensible Money, LLC | 19 253 | 0,09 | 323 | 1,25 | ||||
| 2025-07-22 | 13F | Legacy CG, LLC | 154 671 | −1,29 | 2 595 | −0,15 | ||||
| 2025-08-12 | 13F | Steward Partners Investment Advisory, Llc | 3 213 | −0,46 | 54 | 0,00 | ||||
| 2025-08-13 | 13F | Morton Community Bank | 244 718 | 1 466,70 | 4 106 | 1 485,33 | ||||
| 2025-08-07 | 13F | Montag A & Associates Inc | 4 699 | 46,89 | 79 | 47,17 | ||||
| 2025-07-30 | 13F | Greatmark Investment Partners, Inc. | 11 150 | 187 | ||||||
| 2025-07-25 | 13F | G2 Capital Management, Llc / Oh | 90 574 | 1,20 | 1 520 | 2,36 | ||||
| 2025-08-12 | 13F | Hanover Advisors Inc | 44 186 | 8,02 | 741 | 9,29 | ||||
| 2025-07-31 | 13F | Vaughan David Investments Inc/il | 287 637 | 1 005,45 | 5 | |||||
| 2025-04-15 | 13F | Noble Wealth Management PBC | 4 000 | −40,07 | 66 | −39,45 | ||||
| 2025-07-25 | 13F | Hobbs Group Advisors, LLC | 52 940 | 47,09 | 888 | 48,74 | ||||
| 2025-08-06 | 13F | Commonwealth Equity Services, Llc | 105 120 | −22,04 | 2 | −50,00 | ||||
| 2025-08-07 | 13F | SFE Investment Counsel | 185 362 | 40,08 | 3 110 | 41,69 | ||||
| 2025-07-17 | 13F/A | Capital Investment Advisors, LLC | 18 603 | 0,00 | 312 | 1,30 | ||||
| 2025-08-15 | 13F | Morgan Stanley | 5 952 701 | 11,91 | 99 886 | 13,19 | ||||
| 2025-08-01 | 13F | Redwood Park Advisors LLC | 0 | −100,00 | 0 | |||||
| 2025-08-04 | 13F | Arkadios Wealth Advisors | 11 584 | 194 | ||||||
| 2025-07-31 | 13F | Cambridge Investment Research Advisors, Inc. | 521 327 | 5,54 | 9 | 0,00 | ||||
| 2025-08-14 | 13F | Hilltop Holdings Inc. | 14 830 | 249 | ||||||
| 2025-05-15 | 13F | Tower Research Capital LLC (TRC) | 0 | −100,00 | 0 | |||||
| 2025-08-14 | 13F | Fmr Llc | 1 665 | −15,35 | 28 | −15,62 | ||||
| 2025-08-14 | 13F | JPL Wealth Management, LLC | 49 371 | −10,39 | 828 | −9,41 | ||||
| 2025-07-14 | 13F | AdvisorNet Financial, Inc | 1 176 | 0,00 | 20 | 0,00 | ||||
| 2025-08-01 | 13F | First Command Advisory Services, Inc. | 12 999 | 13,11 | 218 | 14,74 | ||||
| 2025-07-14 | 13F | Infinity Wealth Counsel, LLC | 173 066 | 3,38 | 2 904 | 4,57 | ||||
| 2025-08-15 | 13F | Captrust Financial Advisors | 112 281 | 24,51 | 1 884 | 25,94 | ||||
| 2025-07-31 | 13F | United Community Bank | 5 500 | 0,00 | 92 | 1,10 | ||||
| 2025-05-14 | 13F | Van Hulzen Asset Management, LLC | 0 | −100,00 | 0 | −100,00 | ||||
| 2025-08-14 | 13F | Quartz Partners, LLC | 34 562 | 0,00 | 580 | 1,05 | ||||
| 2025-08-14 | 13F | Mariner, LLC | 10 682 | 179 | ||||||
| 2025-08-05 | 13F | Strategic Financial Concepts, LLC | 0 | −100,00 | 0 | |||||
| 2025-07-29 | 13F | Sigma Investment Counselors Inc | 24 428 | −1,61 | 410 | −0,49 | ||||
| 2025-08-05 | 13F | Key FInancial Inc | 11 260 | 93,80 | 189 | 95,83 | ||||
| 2025-08-14 | 13F | Benjamin Edwards Inc | 12 044 | −0,50 | 202 | 1,00 | ||||
| 2025-07-22 | 13F | DAVENPORT & Co LLC | 15 455 | 0,00 | 259 | 1,17 | ||||
| 2025-08-14 | 13F | Colony Group, LLC | 717 320 | 5,92 | 12 037 | 7,14 | ||||
| 2025-04-29 | 13F | Timber Creek Capital Management LLC | 0 | −100,00 | 0 | −100,00 | ||||
| 2025-07-23 | 13F | Evexia Wealth Llc | 185 311 | 100,49 | 3 106 | 103,34 | ||||
| 2025-07-29 | 13F | Straight Path Wealth Management | 184 664 | 29,79 | 3 099 | 31,27 | ||||
| 2025-08-01 | 13F | Clark Asset Management, LLC | 614 529 | 22,81 | 10 312 | 24,21 | ||||
| 2025-08-06 | 13F | Souders Financial Advisors | 211 249 | 13,79 | 3 545 | 15,10 | ||||
| 2025-08-07 | 13F | Allworth Financial LP | 8 730 | 0,00 | 146 | 1,39 | ||||
| 2025-08-14 | 13F | Atomi Financial Group, Inc. | 21 230 | 57,35 | 356 | 59,64 | ||||
| 2025-08-14 | 13F | Bank Of America Corp /de/ | 1 598 949 | 3,53 | 26 830 | 4,72 | ||||
| 2025-08-14 | 13F | Stifel Financial Corp | 187 745 | 16,91 | 3 150 | 18,24 | ||||
| 2025-08-05 | 13F | Sigma Planning Corp | 53 095 | −5,77 | 891 | −4,71 | ||||
| 2025-05-14 | 13F | Monterey Private Wealth, Inc. | 16 191 | 1,12 | 269 | 2,29 | ||||
| 2025-08-14 | 13F | Mml Investors Services, Llc | 464 307 | 8,01 | 8 | 0,00 | ||||
| 2025-07-14 | 13F | Masso Torrence Wealth Management Inc. | 30 508 | 0,00 | 512 | 0,99 | ||||
| 2025-08-14 | 13F | Ancora Advisors, LLC | 12 828 | 0,00 | 215 | 1,42 | ||||
| 2025-08-14 | 13F | Redwood Financial Network Corp | 16 805 | 12,08 | 282 | 13,31 | ||||
| 2025-08-05 | 13F | Huntington National Bank | 1 643 | 29,57 | ||||||
| 2025-08-14 | 13F | Raymond James Financial Inc | 4 621 521 | 2,98 | 77 549 | 4,16 | ||||
| 2025-07-21 | 13F | Segment Wealth Management, LLC | 51 670 | 2,78 | 867 | 4,08 | ||||
| 2025-08-13 | 13F | Invesco Ltd. | 3 159 364 | 16,67 | 53 014 | 18,01 | ||||
| 2025-08-12 | 13F | LPL Financial LLC | 2 302 307 | 6,22 | 38 633 | 7,44 | ||||
| 2025-08-12 | 13F | MAI Capital Management | 1 164 560 | 9,94 | 19 541 | 11,20 | ||||
| 2025-08-06 | 13F | First Horizon Advisors, Inc. | 23 412 | 12,49 | 393 | 13,62 | ||||
| 2025-08-08 | 13F | Kingsview Wealth Management, LLC | 14 112 | 7,96 | 237 | 9,26 | ||||
| 2025-08-12 | 13F | Goepper Burkhardt LLC | 466 523 | 19,58 | 7 828 | 20,95 | ||||
| 2025-07-10 | 13F | CWC Advisors, LLC. | 10 045 | −9,38 | 169 | −8,20 | ||||
| 2025-07-24 | 13F | Us Bancorp \de\ | 10 776 | 56,92 | 181 | 59,29 | ||||
| 2025-08-13 | 13F | MONECO Advisors, LLC | 1 123 513 | 15,95 | 18 853 | 17,28 | ||||
| 2025-07-18 | 13F | Ledgewood Wealth Advisors, LLC | 125 029 | 0,70 | 2 098 | 1,85 | ||||
| 2025-05-22 | 13F | Mattson Financial Services, LLC | 0 | −100,00 | 0 | |||||
| 2025-07-30 | 13F | Eqis Capital Management, Inc. | 13 629 | 0,61 | 229 | 1,79 | ||||
| 2025-07-21 | 13F | Exchange Capital Management, Inc. | 85 197 | −46,83 | 1 430 | −46,24 | ||||
| 2025-07-30 | 13F | Phoenix Holdings Ltd. | 34 199 | 574 | ||||||
| 2025-08-14 | 13F | Mercer Global Advisors Inc /adv | 21 035 | 2,53 | 353 | 3,53 | ||||
| 2025-08-14 | 13F | Hrt Financial Lp | 0 | −100,00 | 0 | |||||
| 2025-09-11 | 13F | Milestones Private Investment Advisors LLC | 132 512 | 2 224 | ||||||
| 2025-07-10 | 13F | Secure Asset Management, LLC | 0 | −100,00 | 0 | |||||
| 2025-07-25 | 13F | Astoria Portfolio Advisors LLC. | 33 133 | 32,24 | 553 | 34,31 | ||||
| 2025-07-31 | 13F | Optimum Investment Advisors | 1 500 | 25 | ||||||
| 2025-08-13 | 13F | AMJ Financial Wealth Management | 469 272 | 0,94 | 7 874 | 2,10 |