Grundläggande statistik
| Institutionella ägare | 329 total, 329 long only, 0 short only, 0 long/short - change of 0,61% MRQ |
| Genomsnittlig portföljallokering | 0.1972 % - change of −9,76% MRQ |
| Institutionella aktier (lång) | 28 678 321 (ex 13D/G) - change of 0,65MM shares 2,33% MRQ |
| Institutionellt värde (lång) | $ 881 770 USD ($1000) |
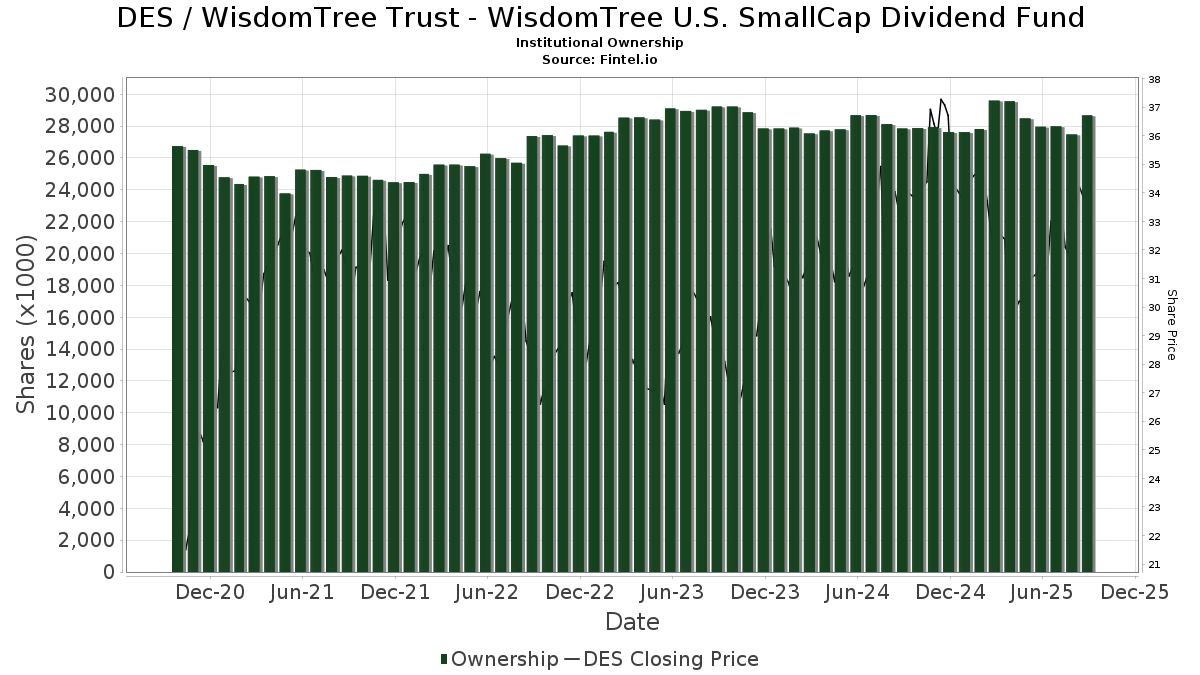
Institutionellt ägande och aktieägare
WisdomTree Trust - WisdomTree U.S. SmallCap Dividend Fund (US:DES) har 329 Institutionella ägare och aktieägare som har lämnat in 13D/G- eller 13F-formulär till Securities Exchange Commission (SEC). Dessa institut innehar totalt 28,678,321 aktier. Största aktieägare inkluderar Morgan Stanley, Bank Of America Corp /de/, UBS Group AG, LPL Financial LLC, Creative Planning, M&t Bank Corp, Raymond James Financial Inc, Royal Bank Of Canada, CI Private Wealth, LLC, and Keybank National Association/oh .
WisdomTree Trust - WisdomTree U.S. SmallCap Dividend Fund (ARCA:DES) Institutionell ägarstruktur visar institutioners och fonders nuvarande positioner i företaget, samt de senaste förändringarna i positionernas storlek. Större aktieägare kan vara enskilda investerare, fonder, hedgefonder eller institutioner. Bilaga 13D visar att investeraren äger (eller ägde) mer än 5% av företaget och avser (eller avsåg) att aktivt eftersträva en förändring av affärsstrategin. Schedule 13G indikerar en passiv investering på över 5%.
The share price as of September 15, 2025 is 34,07 / share. Previously, on September 16, 2024, the share price was 33,89 / share. This represents an increase of 0,53% over that period.
Fondsentimentets poäng
Fondsentimentet poängen(fka Ägarackumulation-poäng) visar vilka aktier som är mest köpta av fonder. Det är resultatet av en sofistikerad kvantitativ flerfaktormodell som identifierar företag med de högsta nivåerna av institutionell ackumulering. Poängsättningsmodellen använder en kombination av den totala ökningen av redovisade ägare, förändringarna i portföljallokeringarna för dessa ägare och andra mått. Siffran sträcker sig från 0 till 100, där högre siffror indikerar en högre nivå av ackumulering i förhållande till sina konkurrenter, och 50 är genomsnittet.
Uppdateringsfrekvens: Dagligen
Se Ownership Explorer, som innehåller en lista över de högst rankade företagen.
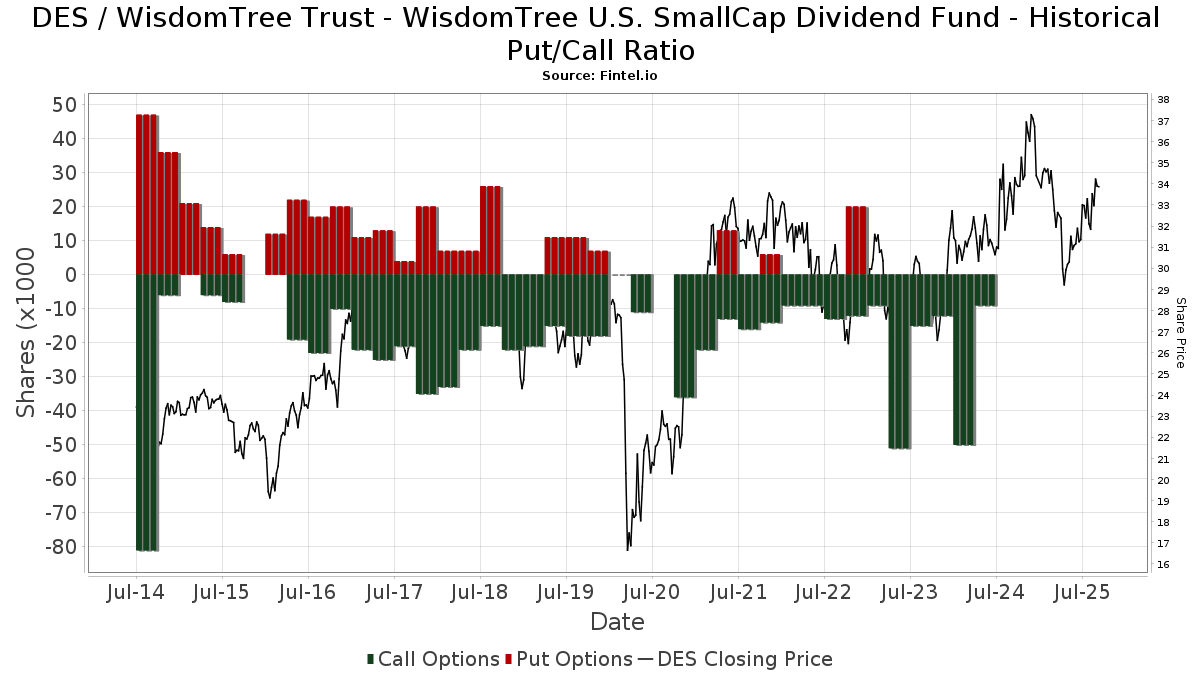
Institutionell sälj/köp-kvot
Förutom att rapportera vanliga eget kapital- och skuldemissioner måste institutioner med mer än 100MM tillgångar under förvaltning också avslöja sina innehav av sälj- och köpoptioner. Eftersom säljoptioner i allmänhet indikerar ett negativt sentiment och köpoptioner indikerar ett positivt sentiment, kan vi få en uppfattning om det övergripande institutionella sentimentet genom att plotta förhållandet mellan säljoptioner och köpoptioner. Diagrammet till höger visar det historiska förhållandet mellan sälj- och köpoptioner för detta instrument.
Genom att använda sälj/köp-kvoten som en indikator på aktieägarnas sentiment undviker man en av de största bristerna med att använda det totala institutionella ägandet, nämligen att en betydande del av de förvaltade tillgångarna investeras passivt för att följa index. Passivt förvaltade fonder köper vanligtvis inte optioner, så indikatorn för sälj/köp-kvoten ger en bättre bild av stämningen i aktivt förvaltade fonder.
13F- och NPORT-arkiveringar
Detaljer om 13F-arkiveringar är gratis. Detaljer om NP-arkiveringar kräver ett premiummedlemskap. Gröna rader indikerar nya positioner. Röda rader indikerar stängda positioner. Klicka på länk symbolen för att se hela transaktionshistoriken.
Uppgradera
för att låsa upp premiumdata och exportera till Excel ![]() .
.
| Fil Datum | Källa | Investerare | Typ | Genomsnittligt pris (beräknat) |
Aktier | Δ Aktier (%) |
Rapporterat värde (1000 USD) |
Δ Värde (%) |
Portföljallokering (%) |
|
|---|---|---|---|---|---|---|---|---|---|---|
| 2025-08-11 | 13F | Cornerstone Planning Group LLC | 499 | 0,81 | 16 | 7,14 | ||||
| 2025-07-29 | 13F | Chicago Partners Investment Group LLC | 14 331 | −6,63 | 477 | 2,58 | ||||
| 2025-05-01 | 13F | Schechter Investment Advisors, LLC | 13 070 | 0,00 | 418 | −6,92 | ||||
| 2025-07-21 | 13F | Ameritas Advisory Services, LLC | 2 687 | 85 | ||||||
| 2025-08-28 | NP | GPMIX - GuidePath(R) Multi-Asset Income Allocation Fund Service Shares | 47 828 | −1,16 | 1 519 | −1,75 | ||||
| 2025-08-06 | 13F | Eukles Asset Management | 234 | 0,00 | 7 | 0,00 | ||||
| 2025-07-10 | 13F | Piscataqua Savings Bank | 258 | 0,00 | 8 | 0,00 | ||||
| 2025-07-23 | 13F | REAP Financial Group, LLC | 92 | 0,00 | 3 | 0,00 | ||||
| 2025-08-13 | 13F | IAG Wealth Partners, LLC | 40 314 | −5,47 | 1 280 | −6,02 | ||||
| 2025-08-13 | 13F | Collar Capital Management, LLC | 15 993 | −5,83 | 508 | −6,46 | ||||
| 2025-08-01 | 13F | Petra Financial Advisors Inc | 26 229 | −0,40 | 833 | −0,95 | ||||
| 2025-08-12 | 13F | Marshall & Sterling Wealth Advisors Inc. | 0 | −100,00 | 0 | |||||
| 2025-07-29 | 13F | Signature Estate & Investment Advisors Llc | 99 407 | 2,66 | 3 157 | 2,04 | ||||
| 2025-07-22 | 13F | Berger Financial Group, Inc | 7 874 | 0,00 | 250 | −0,40 | ||||
| 2025-08-13 | 13F | Neuberger Berman Group LLC | 0 | −100,00 | 0 | |||||
| 2025-07-31 | 13F | New Hampshire Trust | 14 282 | 0,00 | 454 | −0,66 | ||||
| 2025-07-23 | 13F | SGL Investment Advisors, Inc. | 17 967 | 11,54 | 591 | 18,47 | ||||
| 2025-07-22 | 13F | Hickory Asset Management, Inc. | 6 750 | −0,38 | 214 | −0,93 | ||||
| 2025-07-21 | 13F | Empirical Financial Services, LLC d.b.a. Empirical Wealth Management | 120 583 | −10,68 | 3 830 | −11,24 | ||||
| 2025-08-08 | 13F | Better Money Decisions, LLC | 9 648 | 0,71 | 306 | 0,00 | ||||
| 2025-08-13 | 13F | Smith, Moore & Co. | 25 601 | 0,02 | 813 | −0,61 | ||||
| 2025-08-14 | 13F | Smartleaf Asset Management LLC | 56 | 9,80 | 2 | 0,00 | ||||
| 2025-07-15 | 13F | Missouri Trust & Investment Co | 975 | 0,00 | 31 | −3,23 | ||||
| 2025-07-22 | 13F | Iron Horse Wealth Management, LLC | 0 | −100,00 | 0 | |||||
| 2025-08-14 | 13F | Wick Capital Partners, LLC | 17 610 | 123,25 | 251 | −0,79 | ||||
| 2025-07-30 | 13F | Evermay Wealth Management Llc | 1 597 | 0,00 | 51 | −1,96 | ||||
| 2025-08-07 | 13F | HC Advisors, LLC | 198 304 | 2,31 | 6 298 | 1,68 | ||||
| 2025-07-18 | 13F | Vicus Capital | 19 869 | 2,16 | 631 | 1,61 | ||||
| 2025-08-08 | 13F | Cetera Investment Advisers | 260 063 | 5,81 | 8 260 | 5,14 | ||||
| 2025-07-25 | 13F | Verdence Capital Advisors LLC | 11 000 | 0,05 | 349 | −0,57 | ||||
| 2025-07-22 | 13F | VAUGHAN & Co SECURITIES, INC. | 78 205 | −1,76 | 2 484 | −2,40 | ||||
| 2025-07-16 | 13F | Dakota Wealth Management | 9 970 | −9,40 | 317 | −9,97 | ||||
| 2025-08-06 | 13F | SOUTH STATE Corp | 17 682 | 0,00 | 562 | −0,71 | ||||
| 2025-05-20 | 13F | Blue Rock Wealth Management LLC | 48 593 | −3,31 | 1 553 | −10,02 | ||||
| 2025-08-05 | 13F | Sigma Planning Corp | 16 255 | −2,78 | 516 | −3,37 | ||||
| 2025-08-12 | 13F | MAI Capital Management | 10 140 | −3,11 | 322 | −3,59 | ||||
| 2025-08-14 | 13F | Hancock Whitney Corp | 12 207 | −1,41 | 388 | −2,03 | ||||
| 2025-07-18 | 13F | Marino, Stram & Associates Llc | 14 901 | −25,72 | 473 | −26,21 | ||||
| 2025-07-18 | 13F | Truist Financial Corp | 144 488 | −51,48 | 4 589 | −51,79 | ||||
| 2025-07-23 | 13F | Viewpoint Capital Management LLC | 2 856 | 0,00 | 91 | −1,10 | ||||
| 2025-07-25 | 13F | McNamara Financial Services, Inc. | 13 757 | 24,70 | 437 | 23,86 | ||||
| 2025-08-08 | 13F | Croban | 118 690 | −0,13 | 3 768 | −0,74 | ||||
| 2025-07-25 | 13F | Hemington Wealth Management | 250 | 0 | ||||||
| 2025-08-14 | 13F | EP Wealth Advisors, Inc. | 15 215 | 17,35 | 483 | 16,67 | ||||
| 2025-08-06 | 13F | Founders Financial Securities Llc | 15 207 | 2,67 | 483 | 7,59 | ||||
| 2025-08-11 | 13F | Heritage Wealth Advisors | 1 769 | −49,01 | 56 | −49,09 | ||||
| 2025-08-11 | 13F | United Capital Financial Advisers, Llc | 12 672 | −10,27 | 402 | −10,86 | ||||
| 2025-08-01 | 13F | Chilton Capital Management Llc | 0 | −100,00 | 0 | |||||
| 2025-07-23 | 13F | H&H Retirement Design & Management INC | 171 838 | 10,85 | 5 571 | 23,75 | ||||
| 2025-07-24 | 13F | Stonebridge Financial Group, LLC | 0 | −100,00 | 0 | |||||
| 2025-08-07 | 13F | Cascade Financial Partners, LLC | 168 108 | −2,03 | 5 339 | −2,63 | ||||
| 2025-08-15 | 13F | Equitable Holdings, Inc. | 12 804 | 15,17 | 407 | 14,37 | ||||
| 2025-07-16 | 13F | Signaturefd, Llc | 200 | −85,30 | 6 | −86,05 | ||||
| 2025-08-14 | 13F | Sunbelt Securities, Inc. | 22 562 | 12,53 | 775 | 21,09 | ||||
| 2025-07-09 | 13F | Dynamic Advisor Solutions LLC | 10 443 | 0,12 | 332 | −0,60 | ||||
| 2025-07-24 | 13F | Us Bancorp \de\ | 2 574 | −49,45 | 82 | −50,00 | ||||
| 2025-08-04 | 13F | Integrity Alliance, Llc. | 17 003 | −50,00 | 540 | −50,28 | ||||
| 2025-08-07 | 13F | Cahill Financial Advisors Inc | 54 288 | 1,63 | 1 724 | 1,00 | ||||
| 2025-07-15 | 13F | Mather Group, Llc. | 22 387 | −7,25 | 711 | −7,78 | ||||
| 2025-08-14 | 13F | Aqr Capital Management Llc | 8 995 | 286 | ||||||
| 2025-07-14 | 13F | Lee-Kelleher Wealth Management | 143 503 | 4,95 | 4 558 | 4,28 | ||||
| 2025-08-05 | 13F | Strategic Financial Concepts, LLC | 8 421 | −2,16 | 267 | −2,91 | ||||
| 2025-07-14 | 13F | Ridgewood Investments LLC | 114 | 0,00 | 4 | 0,00 | ||||
| 2025-08-04 | 13F | Creative Financial Designs Inc /adv | 145 | −27,14 | 5 | −33,33 | ||||
| 2025-08-18 | 13F | Hollencrest Capital Management | 254 | 0,00 | 8 | 0,00 | ||||
| 2025-07-24 | 13F | Blair William & Co/il | 1 034 | 0,00 | 33 | −3,03 | ||||
| 2025-07-31 | 13F | Buckingham Strategic Partners | 21 859 | −1,58 | 694 | −2,12 | ||||
| 2025-08-13 | 13F | Flow Traders U.s. Llc | 13 986 | 111,84 | 0 | |||||
| 2025-07-30 | NP | ENDW - Cambria Endowment Style ETF | 108 | 3 | ||||||
| 2025-07-17 | 13F | Independence Bank of Kentucky | 37 280 | −1,57 | 1 184 | −2,15 | ||||
| 2025-07-25 | 13F | NorthRock Partners, LLC | 2 105 | −40,70 | 67 | −41,59 | ||||
| 2025-07-31 | 13F | Cambridge Investment Research Advisors, Inc. | 47 826 | −2,20 | 2 | 0,00 | ||||
| 2025-08-25 | 13F | Hilltop Partners LLC | 10 855 | 0,00 | 345 | −0,58 | ||||
| 2025-08-01 | 13F | Gwn Securities Inc. | 0 | −100,00 | 0 | |||||
| 2025-07-07 | 13F | Thurston, Springer, Miller, Herd & Titak, Inc. | 469 | 0,21 | 15 | 0,00 | ||||
| 2025-07-14 | 13F | Southland Equity Partners LLC | 7 684 | −7,44 | 244 | −7,92 | ||||
| 2025-07-16 | 13F | New Insight Wealth Advisors | 11 644 | −25,84 | 370 | −26,35 | ||||
| 2025-05-12 | 13F | Wambolt & Associates, LLC | 0 | −100,00 | 0 | |||||
| 2025-08-14 | 13F | Harwood Advisory Group, LLC | 0 | −100,00 | 0 | |||||
| 2025-08-04 | 13F | Waterfront Wealth Inc. | 34 688 | −0,16 | 1 102 | −0,81 | ||||
| 2025-08-11 | 13F | Private Advisor Group, LLC | 29 467 | −0,59 | 936 | −1,27 | ||||
| 2025-05-16 | 13F | Coppell Advisory Solutions LLC | 0 | −100,00 | 0 | |||||
| 2025-08-06 | 13F | Robinson Smith Wealth Advisors Llc | 14 266 | 0,00 | 453 | −0,44 | ||||
| 2025-07-08 | 13F | Melone Private Wealth, LLC | 141 577 | 0,03 | 4 506 | −0,38 | ||||
| 2025-08-06 | 13F | Aspect Partners, LLC | 1 230 | 0,82 | 39 | 2,63 | ||||
| 2025-05-06 | 13F | JPL Wealth Management, LLC | 132 349 | 4 325 | ||||||
| 2025-07-16 | 13F | Meridian Investment Counsel Inc. | 7 000 | 0,00 | 222 | −0,45 | ||||
| 2025-08-07 | 13F | Pinnacle Wealth Management Advisory Group, LLC | 10 239 | −2,38 | 325 | −2,99 | ||||
| 2025-08-07 | 13F | Midwest Trust Co | 68 460 | 2 174 | ||||||
| 2025-04-29 | 13F | Resources Investment Advisors, LLC. | 0 | −100,00 | 0 | −100,00 | ||||
| 2025-07-22 | 13F | Wealthcare Capital Partners, LLC | 20 222 | 15,92 | 642 | 15,26 | ||||
| 2025-08-06 | 13F | Round Rock Advisors, LLC | 14 836 | −14,62 | 471 | −15,14 | ||||
| 2025-05-13 | 13F | Heck Capital Advisors, LLC | 0 | −100,00 | 0 | −100,00 | ||||
| 2025-07-21 | 13F | Sterling Investment Counsel, LLC | 10 398 | 0,00 | 330 | −0,60 | ||||
| 2025-08-14 | 13F | Glen Eagle Advisors, LLC | 61 757 | −12,00 | 1 961 | −12,53 | ||||
| 2025-08-13 | 13F | Fiduciary Group LLC | 0 | −100,00 | 0 | |||||
| 2025-08-11 | 13F | Principal Securities, Inc. | 32 082 | 4,39 | 1 019 | −3,51 | ||||
| 2025-08-15 | 13F | CI Private Wealth, LLC | 714 782 | 110,65 | 22 701 | 109,34 | ||||
| 2025-07-29 | 13F | Uhlmann Price Securities, Llc | 10 190 | −31,31 | 324 | −31,86 | ||||
| 2025-08-13 | 13F | M&t Bank Corp | 1 071 307 | −0,93 | 34 025 | −1,55 | ||||
| 2025-07-09 | 13F | Bank of New Hampshire | 1 540 | −45,77 | 49 | −46,67 | ||||
| 2025-07-22 | 13F | Wealthcare Advisory Partners LLC | 105 064 | 3,59 | 3 337 | 2,93 | ||||
| 2025-07-24 | 13F | Jfs Wealth Advisors, Llc | 131 | 0,77 | 4 | 0,00 | ||||
| 2025-07-21 | 13F | TFG Advisers LLC | 44 931 | −2,72 | 1 427 | −3,32 | ||||
| 2025-08-12 | 13F | Integrated Advisors Network LLC | 14 250 | −1,81 | 453 | −2,38 | ||||
| 2025-07-25 | 13F | Cwm, Llc | 17 840 | 19,52 | 1 | |||||
| 2025-07-14 | 13F | AdvisorNet Financial, Inc | 73 843 | 128,29 | 2 345 | 127,01 | ||||
| 2025-08-06 | 13F | AE Wealth Management LLC | 3 873 | 12,42 | 123 | 11,82 | ||||
| 2025-08-14 | 13F | Synovus Financial Corp | 0 | −100,00 | 0 | |||||
| 2025-08-14 | 13F | Destination Wealth Management | 324 885 | 5,13 | 10 318 | 4,48 | ||||
| 2025-07-28 | 13F | Founders Grove Wealth Partners, Llc | 64 501 | −5,33 | 2 049 | −5,93 | ||||
| 2025-04-15 | 13F | Noble Wealth Management PBC | 236 | 0,00 | 8 | −12,50 | ||||
| 2025-08-13 | 13F | Capital Analysts, Inc. | 61 335 | 10,04 | 2 | 0,00 | ||||
| 2025-07-24 | 13F | JNBA Financial Advisors | 54 414 | 0,00 | 1 728 | −0,63 | ||||
| 2025-08-14 | 13F | Bank Of America Corp /de/ | 2 299 893 | 21,33 | 73 045 | 20,57 | ||||
| 2025-08-05 | 13F | Prosperity Consulting Group, LLC | 194 328 | −4,92 | 6 172 | −5,51 | ||||
| 2025-07-21 | 13F | DHJJ Financial Advisors, Ltd. | 2 931 | 93 | ||||||
| 2025-08-06 | 13F | Columbia River Financial Group, LLC | 20 062 | −12,29 | 1 | |||||
| 2025-08-12 | 13F | SRS Capital Advisors, Inc. | 13 070 | 415 | ||||||
| 2025-08-12 | 13F | Farmers National Bank | 74 266 | 4,75 | 2 359 | 4,11 | ||||
| 2025-07-21 | 13F | F&V Capital Management, LLC | 35 190 | −29,39 | 1 | 0,00 | ||||
| 2025-08-15 | 13F | Tower Research Capital LLC (TRC) | 306 | 10 | ||||||
| 2025-08-12 | 13F | Proequities, Inc. | 0 | 0 | ||||||
| 2025-08-14 | 13F | Fmr Llc | 11 718 | −23,13 | 372 | −23,61 | ||||
| 2025-07-11 | 13F | Kingstone Capital Partners Texas, LLC | 115 834 | 3 | ||||||
| 2025-08-11 | 13F | United Advisor Group, LLC | 36 906 | 0,94 | 1 172 | 0,34 | ||||
| 2025-08-13 | 13F | Colonial Trust Co / SC | 3 242 | −24,94 | 103 | −24,82 | ||||
| 2025-08-12 | 13F | Cowa, Llc | 22 673 | 6,79 | 720 | 6,19 | ||||
| 2025-08-12 | 13F | Jpmorgan Chase & Co | 141 647 | −2,28 | 4 499 | −2,89 | ||||
| 2025-07-09 | 13F | Beacon Financial Group | 75 013 | −6,95 | 2 382 | −7,53 | ||||
| 2025-08-05 | 13F | Cherry Tree Wealth Management, LLC | 10 379 | 0,00 | 330 | −0,60 | ||||
| 2025-08-14 | 13F | Paragon Private Wealth Management, LLC | 25 233 | 38,83 | 801 | 38,10 | ||||
| 2025-08-14 | 13F/A | Rockefeller Capital Management L.P. | 132 808 | −6,20 | 4 218 | −6,79 | ||||
| 2025-07-21 | 13F | Cape Ann Savings Bank | 0 | −100,00 | 0 | |||||
| 2025-05-14 | 13F | Monterey Private Wealth, Inc. | 0 | −100,00 | 0 | |||||
| 2025-07-21 | 13F | Abundance Wealth Counselors | 14 560 | −0,16 | 0 | |||||
| 2025-08-04 | 13F | Atria Investments Llc | 17 121 | 4,02 | 544 | 3,23 | ||||
| 2025-07-30 | 13F | Parcion Private Wealth LLC | 129 375 | 0,00 | 4 109 | −0,63 | ||||
| 2025-07-09 | 13F | Christopher J. Hasenberg, Inc | 58 | 2 | ||||||
| 2025-07-30 | 13F | Principle Wealth Partners Llc | 0 | −100,00 | 0 | |||||
| 2025-08-14 | 13F | RMB Capital Management, LLC | 216 847 | 25,33 | 6 887 | 24,56 | ||||
| 2025-08-01 | 13F | Pasadena Private Wealth, LLC | 22 353 | 710 | ||||||
| 2025-08-05 | 13F | GHP Investment Advisors, Inc. | 100 | −76,74 | 3 | −76,92 | ||||
| 2025-08-12 | 13F | Bokf, Na | 27 735 | −2,65 | 881 | −3,30 | ||||
| 2025-08-04 | 13F | Creekmur Asset Management LLC | 745 | 170,91 | 24 | 187,50 | ||||
| 2025-08-14 | 13F | CoreCap Advisors, LLC | 2 608 | 12,61 | 83 | 10,81 | ||||
| 2025-07-22 | 13F | Rockingstone Advisors LLC | 9 065 | 0,00 | 288 | −0,69 | ||||
| 2025-04-14 | 13F | Wedmont Private Capital | 0 | −100,00 | 0 | |||||
| 2025-08-08 | 13F | Collaborative Wealth Managment Inc. | 11 617 | −6,19 | 369 | −6,84 | ||||
| 2025-07-24 | 13F | Forefront Analytics, LLC | 118 690 | 3 768 | ||||||
| 2025-07-30 | 13F | Exencial Wealth Advisors, Llc | 11 005 | −2,75 | 350 | −3,32 | ||||
| 2025-08-06 | 13F | Modera Wealth Management, LLC | 55 207 | −0,32 | 1 753 | −0,96 | ||||
| 2025-07-30 | 13F | IMG Wealth Management, Inc. | 30 | 0,00 | 1 | |||||
| 2025-08-14 | 13F | Mercer Global Advisors Inc /adv | 590 173 | −0,60 | 18 751 | −1,06 | ||||
| 2025-08-12 | 13F | O'shaughnessy Asset Management, Llc | 16 762 | 46,21 | 532 | 45,36 | ||||
| 2025-07-18 | 13F | PFG Investments, LLC | 10 302 | 5,45 | 327 | 4,81 | ||||
| 2025-08-05 | 13F | Bank Of Montreal /can/ | 10 979 | −10,18 | 349 | −10,77 | ||||
| 2025-08-14 | 13F | IHT Wealth Management, LLC | 21 913 | −33,90 | 696 | −34,37 | ||||
| 2025-07-11 | 13F | Pinnacle Bancorp, Inc. | 735 | 0,00 | 23 | 0,00 | ||||
| 2025-08-14 | 13F | Wiley Bros.-aintree Capital, Llc | 59 998 | 15,59 | 1 908 | 14,59 | ||||
| 2025-08-18 | 13F | Geneos Wealth Management Inc. | 5 559 | −10,41 | 177 | −11,11 | ||||
| 2025-09-04 | 13F/A | Advisor Group Holdings, Inc. | 219 593 | 8,08 | 6 981 | 7,52 | ||||
| 2025-07-31 | 13F | Oppenheimer & Co Inc | 31 822 | 2,83 | 1 011 | 2,12 | ||||
| 2025-04-29 | 13F | Element Wealth, LLC | 0 | −100,00 | 0 | |||||
| 2025-08-05 | 13F | Huntington National Bank | 17 250 | −1,07 | ||||||
| 2025-08-11 | 13F | Bellwether Advisors, LLC | 170 | 0,00 | 5 | 0,00 | ||||
| 2025-08-13 | 13F | Invesco Ltd. | 8 112 | −6,80 | 258 | −7,55 | ||||
| 2025-08-05 | 13F | NewSquare Capital LLC | 17 817 | 10,02 | 566 | 9,28 | ||||
| 2025-08-14 | 13F | Two Sigma Investments, Lp | 33 500 | −67,41 | 1 064 | −67,64 | ||||
| 2025-08-14 | 13F | Colony Group, LLC | 55 497 | 0,02 | 1 763 | −0,62 | ||||
| 2025-08-14 | 13F | Glenmede Investment Management, LP | 210 | 7 | ||||||
| 2025-07-14 | 13F | Painted Porch Advisors LLC | 2 381 | 0,00 | 76 | −1,32 | ||||
| 2025-08-14 | 13F | Blue Capital, Inc. | 0 | −100,00 | 0 | |||||
| 2025-04-28 | 13F | Redmont Wealth Advisors Llc | 17 | 1 | ||||||
| 2025-07-18 | 13F | Trust Co Of Vermont | 1 580 | 0,00 | 50 | 0,00 | ||||
| 2025-08-11 | 13F | Invenio Wealth Partners Llc | 12 277 | −49,45 | 390 | −49,87 | ||||
| 2025-05-08 | 13F | Armis Advisers, LLC | 0 | −100,00 | 0 | |||||
| 2025-07-31 | 13F | United Community Bank | 662 | 0,00 | 21 | 0,00 | ||||
| 2025-08-13 | 13F | Beacon Pointe Advisors, LLC | 18 639 | −42,62 | 592 | −43,06 | ||||
| 2025-07-28 | 13F | Harbour Investments, Inc. | 5 558 | −4,12 | 177 | −4,86 | ||||
| 2025-08-05 | 13F | Key FInancial Inc | 167 354 | −5,86 | 5 315 | −6,44 | ||||
| 2025-08-08 | 13F | Pnc Financial Services Group, Inc. | 3 604 | 0,00 | 114 | −0,87 | ||||
| 2025-05-15 | 13F | Glenmede Trust Co Na | 318 | 10 | ||||||
| 2025-08-13 | 13F | Natixis Advisors, L.p. | 17 501 | −2,54 | 1 | |||||
| 2025-04-30 | 13F | Sofos Investments, Inc. | 166 | 5 | ||||||
| 2025-08-14 | 13F | Comerica Bank | 24 898 | −2,76 | 791 | −3,42 | ||||
| 2025-08-06 | 13F | Savant Capital, LLC | 10 367 | 329 | ||||||
| 2025-08-12 | 13F | Global Retirement Partners, LLC | 2 096 | 137,64 | 67 | 120,00 | ||||
| 2025-07-15 | 13F | Evanson Asset Management, LLC | 95 087 | 2,86 | 3 020 | 2,20 | ||||
| 2025-07-07 | 13F | Wesbanco Bank Inc | 38 958 | 6,61 | 1 237 | 6,00 | ||||
| 2025-08-08 | 13F | Larson Financial Group LLC | 652 | −27,15 | 21 | −28,57 | ||||
| 2025-08-07 | 13F | BOK Financial Private Wealth, Inc. | 20 797 | 0,76 | 661 | 0,15 | ||||
| 2025-08-13 | 13F | EverSource Wealth Advisors, LLC | 0 | −100,00 | 0 | |||||
| 2025-08-14 | 13F | Dagco, Inc. | 0 | −100,00 | 0 | |||||
| 2025-07-29 | 13F | Salomon & Ludwin, LLC | 57 916 | −1,32 | 1 911 | 1,92 | ||||
| 2025-07-10 | 13F | Exchange Traded Concepts, Llc | 112 | 4 | ||||||
| 2025-07-29 | 13F | AssuredPartners Investment Advisors, LLC | 0 | −100,00 | 0 | |||||
| 2025-08-13 | 13F | Holos Integrated Wealth LLC | 810 | 0,00 | 26 | 0,00 | ||||
| 2025-08-14 | 13F | C M Bidwell & Associates Ltd | 1 278 | 0,00 | 41 | 0,00 | ||||
| 2025-08-04 | 13F | Spinnaker Trust | 26 411 | 0,00 | 839 | −0,71 | ||||
| 2025-08-14 | 13F | Gallagher Fiduciary Advisors, LLC | 9 793 | 0,82 | 311 | 0,32 | ||||
| 2025-07-24 | 13F | Costello Asset Management, INC | 103 | −11,21 | 3 | 0,00 | ||||
| 2025-08-14 | 13F | Beaird Harris Wealth Management, LLC | 107 | 3 | ||||||
| 2025-07-16 | 13F | ORG Partners LLC | 1 475 | 0,00 | 48 | 0,00 | ||||
| 2025-08-11 | 13F | Platform Technology Partners | 39 781 | 0,00 | 1 263 | −0,63 | ||||
| 2025-07-15 | 13F | Axis Wealth Partners, LLC | 6 344 | −5,03 | 201 | −5,63 | ||||
| 2025-08-11 | 13F | Bradley Foster & Sargent Inc/ct | 6 692 | 213 | ||||||
| 2025-07-14 | 13F | Park Avenue Securities Llc | 10 621 | 0 | ||||||
| 2025-08-04 | 13F | Spire Wealth Management | 0 | −100,00 | 0 | |||||
| 2025-08-05 | 13F | Simplex Trading, Llc | 30 | 0 | ||||||
| 2025-07-10 | 13F | Wealth Enhancement Advisory Services, Llc | 152 742 | −0,32 | 5 066 | 3,45 | ||||
| 2025-08-11 | 13F | Aspen Investment Management Inc | 58 570 | −0,50 | 2 | 0,00 | ||||
| 2025-07-25 | 13F | Hazlett, Burt & Watson, Inc. | 2 524 | 0,84 | 0 | |||||
| 2025-05-14 | 13F | Oarsman Capital, Inc. | 0 | −100,00 | 0 | −100,00 | ||||
| 2025-08-12 | 13F | Steward Partners Investment Advisory, Llc | 86 169 | 35,23 | 2 737 | 34,38 | ||||
| 2025-08-15 | 13F | Kestra Advisory Services, LLC | 444 967 | 3,01 | 14 132 | 2,37 | ||||
| 2025-07-28 | 13F | Fairman Group, LLC | 1 518 | 0,00 | 48 | −7,69 | ||||
| 2025-08-14 | 13F | UBS Group AG | 1 732 436 | −0,02 | 55 022 | −0,65 | ||||
| 2025-08-08 | 13F | Creative Planning | 1 439 254 | −0,43 | 45 711 | −1,05 | ||||
| 2025-08-14 | 13F | Mariner, LLC | 26 933 | −28,78 | 855 | −29,22 | ||||
| 2025-04-09 | 13F | Milestone Asset Management, Llc | 0 | −100,00 | 0 | |||||
| 2025-08-08 | 13F | SBI Securities Co., Ltd. | 1 422 | 0,92 | 45 | 0,00 | ||||
| 2025-08-01 | 13F | Capital Investment Counsel, LLC | 6 750 | −28,04 | 214 | −28,43 | ||||
| 2025-08-19 | 13F | National Asset Management, Inc. | 0 | −100,00 | 0 | |||||
| 2025-07-14 | 13F/A | Seek First Inc. | 17 028 | 1,28 | 541 | 0,56 | ||||
| 2025-07-29 | 13F | Kondo Wealth Advisors, Inc. | 25 001 | 1,98 | 813 | 3,83 | ||||
| 2025-07-29 | 13F | Empirical Asset Management, LLC | 16 157 | 0,62 | 513 | 0,00 | ||||
| 2025-08-04 | 13F | Keybank National Association/oh | 711 068 | 3,52 | 22 584 | 2,87 | ||||
| 2025-08-07 | 13F | Midland Wealth Advisors Llc | 7 247 | −39,51 | 230 | −39,79 | ||||
| 2025-08-12 | 13F | CIBC Private Wealth Group, LLC | 6 485 | 13,83 | 206 | 28,93 | ||||
| 2025-07-08 | 13F | Nbc Securities, Inc. | 9 843 | −2,71 | 0 | |||||
| 2025-07-23 | 13F | Nbt Bank N A /ny | 48 807 | 1,08 | 1 550 | 0,45 | ||||
| 2025-08-05 | 13F | GPS Wealth Strategies Group, LLC | 5 276 | 1,38 | 168 | 0,60 | ||||
| 2025-08-27 | 13F/A | Brinker Capital Investments, LLC | 31 619 | −10,89 | 1 004 | −11,46 | ||||
| 2025-08-04 | 13F | Bristlecone Advisors, LLC | 19 128 | −18,18 | 608 | −18,74 | ||||
| 2025-08-19 | 13F | Wealth Group, Ltd. | 0 | −100,00 | 0 | |||||
| 2025-07-10 | 13F | Brady Family Wealth, Llc | 10 174 | 0,00 | 323 | −0,62 | ||||
| 2025-07-29 | 13F | Marathon Strategic Advisors, LLC | 61 793 | 3,97 | 1 963 | 3,32 | ||||
| 2025-08-13 | 13F | Trustmark National Bank Trust Department | 9 536 | −1,65 | 303 | −2,27 | ||||
| 2025-07-15 | 13F | Main Street Group, LTD | 1 510 | 0,73 | 48 | 0,00 | ||||
| 2025-05-07 | 13F | Mitchell Sinkler & Starr/pa | 0 | −100,00 | 0 | |||||
| 2025-07-24 | 13F | Capital Advisors, Ltd. LLC | 186 | 0,00 | 0 | |||||
| 2025-08-01 | 13F | First National Trust Co | 9 405 | −12,40 | 299 | −13,12 | ||||
| 2025-08-04 | 13F | HBK Sorce Advisory LLC | 29 871 | −10,10 | 949 | −10,65 | ||||
| 2025-08-12 | 13F | LPL Financial LLC | 1 651 760 | 2,39 | 52 460 | 1,74 | ||||
| 2025-04-17 | 13F | Janney Montgomery Scott LLC | 0 | −100,00 | 0 | |||||
| 2025-07-01 | 13F | Harbor Investment Advisory, Llc | 34 022 | 1,43 | 1 081 | 0,75 | ||||
| 2025-07-22 | 13F | Plimoth Trust Co Llc | 8 900 | −4,62 | 283 | −5,37 | ||||
| 2025-08-04 | 13F | Assetmark, Inc | 218 860 | −2,04 | 6 951 | −2,66 | ||||
| 2025-08-12 | 13F | Clearwater Capital Advisors, LLC | 23 144 | −0,15 | 735 | −0,68 | ||||
| 2025-08-29 | 13F | Evolution Wealth Management Inc. | 5 130 | 163 | ||||||
| 2025-05-08 | 13F | BRYN MAWR TRUST Co | 0 | −100,00 | 0 | |||||
| 2025-08-14 | 13F | Citadel Advisors Llc | 90 215 | 2 865 | ||||||
| 2025-07-17 | 13F | Halbert Hargrove Global Advisors, Llc | 36 235 | 0,00 | 1 151 | −0,69 | ||||
| 2025-07-21 | 13F | Kennebec Savings Bank | 1 030 | 33 | ||||||
| 2025-07-15 | 13F | MCF Advisors LLC | 3 621 | 0,00 | 115 | 0,00 | ||||
| 2025-08-01 | 13F | Financial Counselors Inc | 0 | −100,00 | 0 | |||||
| 2025-08-13 | 13F | Navis Wealth Advisors, LLC | 7 175 | −47,96 | 228 | −48,41 | ||||
| 2025-07-30 | 13F | Insight Advisors, LLC/ PA | 16 387 | −3,80 | 520 | −4,41 | ||||
| 2025-07-21 | 13F | Stock Yards Bank & Trust Co | 69 787 | 15,64 | 2 216 | 14,94 | ||||
| 2025-07-22 | 13F | Inlight Wealth Management, LLC | 150 | 0,00 | 5 | 0,00 | ||||
| 2025-08-06 | 13F | Csenge Advisory Group | 16 587 | 0,00 | 516 | 5,31 | ||||
| 2025-07-29 | 13F | Huntleigh Advisors, Inc. | 7 796 | −12,37 | 248 | −13,03 | ||||
| 2025-08-14 | 13F | GWM Advisors LLC | 34 668 | 5,36 | 1 101 | 4,76 | ||||
| 2025-04-17 | 13F | Montecito Bank & Trust | 40 645 | 2,58 | 1 299 | −4,56 | ||||
| 2025-07-16 | 13F | TigerOak Management, L.L.C. | 10 392 | 0,00 | 330 | −0,60 | ||||
| 2025-08-01 | 13F | Integral Investment Advisors, Inc. | 11 580 | 0,00 | 368 | −0,81 | ||||
| 2025-08-04 | 13F | IFG Advisory, LLC | 28 420 | 2,06 | 903 | 1,46 | ||||
| 2025-08-13 | 13F | Continuum Advisory, LLC | 0 | −100,00 | 0 | |||||
| 2025-07-11 | 13F | Farther Finance Advisors, LLC | 12 100 | 590,25 | 384 | 585,71 | ||||
| 2025-08-14 | 13F | Susquehanna International Group, Llp | 146 072 | 373,57 | 4 639 | 370,96 | ||||
| 2025-08-07 | 13F | Allworth Financial LP | 6 871 | 0,00 | 218 | 4,81 | ||||
| 2025-07-22 | 13F | Miracle Mile Advisors, LLC | 18 405 | 9,31 | 585 | 8,55 | ||||
| 2025-07-09 | 13F | Inspirion Wealth Advisors, Llc | 41 250 | −5,74 | 1 310 | −6,29 | ||||
| 2025-07-28 | 13F | Frazier Financial Advisors, LLC | 119 744 | 0,25 | 3 803 | −0,37 | ||||
| 2025-08-14 | 13F | Mml Investors Services, Llc | 54 656 | 3,54 | 2 | 0,00 | ||||
| 2025-07-31 | 13F | Optimum Investment Advisors | 5 670 | 0,00 | 180 | −0,55 | ||||
| 2025-08-15 | 13F | Semmax Financial Advisors Inc. | 2 | 0,00 | 0 | |||||
| 2025-08-15 | 13F | Captrust Financial Advisors | 29 410 | 2,67 | 934 | 2,08 | ||||
| 2025-04-24 | 13F/A | Golden State Wealth Management, LLC | 0 | −100,00 | 0 | |||||
| 2025-08-15 | 13F | Morgan Stanley | 2 574 892 | 6,19 | 81 779 | 5,52 | ||||
| 2025-08-13 | 13F | Vance Wealth, Inc. | 7 728 | 0,00 | 245 | −0,41 | ||||
| 2025-07-18 | 13F | Powers Advisory Group, LLC | 48 998 | 2,21 | 1 556 | 1,57 | ||||
| 2025-07-25 | 13F | Asset Planning,Inc | 1 050 | 0,00 | 33 | 0,00 | ||||
| 2025-08-08 | 13F | Hartland & Co., LLC | 21 005 | −6,30 | 667 | −6,84 | ||||
| 2025-08-19 | 13F | Asset Dedication, LLC | 561 | 0,00 | 18 | 0,00 | ||||
| 2025-07-17 | 13F | SC&H Financial Advisors, Inc. | 46 281 | 12,84 | 1 470 | 12,14 | ||||
| 2025-08-14 | 13F | Royal Bank Of Canada | 822 035 | −14,24 | 26 108 | −14,78 | ||||
| 2025-05-15 | 13F/A | Orion Portfolio Solutions, LLC | 35 483 | −13,90 | 1 134 | −19,86 | ||||
| 2025-07-30 | 13F | Rehmann Capital Advisory Group | 17 378 | 0,00 | 552 | −0,72 | ||||
| 2025-07-30 | 13F | Capstone Triton Financial Group, LLC | 0 | −100,00 | 0 | |||||
| 2025-08-13 | 13F | JT Stratford LLC | 11 972 | 1,15 | 380 | 0,53 | ||||
| 2025-05-12 | 13F | Kohmann Bosshard Financial Services, LLC | 0 | −100,00 | 0 | |||||
| 2025-07-31 | 13F | 180 Wealth Advisors, Llc | 57 614 | −0,92 | 1 830 | −1,56 | ||||
| 2025-07-21 | 13F | Ascent Group, LLC | 58 966 | −3,97 | 1 873 | −4,59 | ||||
| 2025-07-25 | 13F | Atria Wealth Solutions, Inc. | 0 | −100,00 | 0 | |||||
| 2025-08-13 | 13F | Brown Advisory Inc | 16 151 | 0,00 | 513 | −0,78 | ||||
| 2025-08-13 | 13F | Jones Financial Companies Lllp | 664 924 | 78,97 | 21 162 | 78,45 | ||||
| 2025-08-11 | 13F | HighTower Advisors, LLC | 114 661 | 1,56 | 3 642 | 0,91 | ||||
| 2025-08-01 | 13F | Envestnet Asset Management Inc | 551 706 | −12,28 | 17 520 | −12,84 | ||||
| 2025-08-14 | 13F | Ameriprise Financial Inc | 577 142 | −7,93 | 18 363 | −8,35 | ||||
| 2025-07-09 | 13F | Mirador Capital Partners LP | 0 | −100,00 | 0 | |||||
| 2025-07-10 | 13F | Moller Financial Services | 9 086 | 0,00 | 289 | −0,69 | ||||
| 2025-08-11 | 13F | Rothschild Investment Llc | 150 | 0,67 | 5 | 0,00 | ||||
| 2025-08-11 | 13F | Aptus Capital Advisors, LLC | 519 | 0,58 | 16 | 0,00 | ||||
| 2025-08-14 | 13F | Connecticut Wealth Management, LLC | 27 545 | −1,35 | 875 | −2,02 | ||||
| 2025-08-08 | 13F | Atlantic Trust, LLC | 21 | 0,00 | 1 | |||||
| 2025-08-12 | 13F | Founders Financial Alliance, LLC | 12 496 | 2 374,46 | 397 | 2 375,00 | ||||
| 2025-07-25 | 13F | Apollon Wealth Management, LLC | 49 458 | −2,50 | 1 571 | −3,15 | ||||
| 2025-08-06 | 13F | Commonwealth Equity Services, Llc | 335 967 | −2,98 | 11 | −9,09 | ||||
| 2025-04-04 | 13F | Legacy Private Trust Co. | 0 | −100,00 | 0 | |||||
| 2025-07-23 | 13F | Valmark Advisers, Inc. | 322 988 | 6,55 | 10 258 | 5,88 | ||||
| 2025-08-13 | 13F | Baird Financial Group, Inc. | 152 415 | −10,09 | 4 841 | −10,65 | ||||
| 2025-08-13 | 13F | Ally Invest Advisors Inc. | 7 106 | −5,05 | 226 | −5,86 | ||||
| 2025-08-12 | 13F | J.w. Cole Advisors, Inc. | 6 959 | 221 | ||||||
| 2025-07-30 | 13F | Pacific Sun Financial Corp | 9 510 | −3,26 | 302 | −3,82 | ||||
| 2025-08-08 | 13F | Capital Investment Advisory Services, LLC | 2 168 | −2,12 | 69 | −2,86 | ||||
| 2025-08-08 | 13F | Emerald Investment Partners, Llc | 28 063 | −3,89 | 891 | −4,50 | ||||
| 2025-07-17 | 13F | Hengehold Capital Management Llc | 23 991 | 59,31 | 762 | 58,21 | ||||
| 2025-07-24 | 13F | IFP Advisors, Inc | 25 330 | −87,22 | 804 | −87,31 | ||||
| 2025-08-13 | 13F | M Holdings Securities, Inc. | 15 200 | 0 | ||||||
| 2025-08-14 | 13F | Stifel Financial Corp | 142 762 | −38,86 | 4 534 | −39,25 | ||||
| 2025-08-04 | 13F | Pensionmark Financial Group, Llc | 26 584 | 5,35 | 844 | 4,71 | ||||
| 2025-08-12 | 13F | Park Square Financial Group, LLC | 41 | 10,81 | 1 | 0,00 | ||||
| 2025-07-16 | 13F | Moisand Fitzgerald Tamayo, LLC | 3 249 | 0,00 | 103 | 0,00 | ||||
| 2025-07-14 | 13F | Financial Advisory Partners, Llc | 47 837 | 11,00 | 1 519 | 10,31 | ||||
| 2025-08-12 | 13F | Gladstone Institutional Advisory LLC | 34 586 | 5,68 | 1 098 | 5,07 | ||||
| 2025-08-01 | 13F | Anson Capital, Inc. | 7 357 | 5,93 | 234 | 5,43 | ||||
| 2025-07-11 | 13F | SILVER OAK SECURITIES, Inc | 10 670 | −1,66 | 339 | −2,31 | ||||
| 2025-07-07 | 13F | Versant Capital Management, Inc | 1 944 | 0,00 | 62 | −1,61 | ||||
| 2025-08-13 | 13F | Russell Investments Group, Ltd. | 81 | 3 | ||||||
| 2025-05-06 | 13F | Accredited Investors Inc. | 0 | −100,00 | 0 | |||||
| 2025-07-16 | 13F | Investment Partners Asset Management, Inc. | 17 213 | 0,67 | 547 | 0,00 | ||||
| 2025-08-14 | 13F | Wells Fargo & Company/mn | 589 206 | −7,65 | 18 713 | −8,22 | ||||
| 2025-08-12 | 13F | Accredited Wealth Management, LLC | 0 | −100,00 | 0 | |||||
| 2025-08-13 | 13F | Wrenne Financial Planning LLC | 6 504 | 0,00 | 207 | −0,48 | ||||
| 2025-08-11 | 13F | Tidemark, LLC | 793 | −16,88 | 25 | −16,67 | ||||
| 2025-08-05 | 13F | Bank of New York Mellon Corp | 149 640 | 22,55 | 4 753 | 21,78 | ||||
| 2025-08-14 | 13F | Jane Street Group, Llc | 11 249 | 357 | ||||||
| 2025-08-08 | 13F | Financial Gravity Companies, Inc. | 166 | 0,00 | 5 | 0,00 | ||||
| 2025-08-11 | 13F | Brown Brothers Harriman & Co | 20 | −85,19 | 1 | −100,00 | ||||
| 2025-08-13 | 13F | Cerity Partners LLC | 64 072 | −8,14 | 2 035 | −8,75 | ||||
| 2025-07-08 | 13F | Webster Bank, N. A. | 2 604 | 0,00 | 83 | −1,20 | ||||
| 2025-07-17 | 13F | Prepared Retirement Institute LLC | 15 496 | −33,71 | 492 | −34,14 | ||||
| 2025-07-22 | 13F | Ffg Retirement Advisors Llc | 49 926 | 4,19 | 1 586 | 3,53 | ||||
| 2025-08-04 | 13F | Pinnacle Associates Ltd | 13 839 | −1,77 | 440 | −2,44 | ||||
| 2025-07-14 | 13F | Infinity Wealth Counsel, LLC | 12 660 | 13,75 | 402 | 13,24 | ||||
| 2025-07-29 | 13F | Harbor Asset Planning, Inc. | 548 | 17 | ||||||
| 2025-05-15 | 13F | Two Sigma Securities, Llc | 0 | −100,00 | 0 | −100,00 | ||||
| 2025-07-16 | 13F | Diversified Enterprises, LLC | 12 457 | −5,63 | 396 | −6,18 | ||||
| 2025-08-14 | 13F | Warren Averett Asset Management, LLC | 96 673 | −5,17 | 3 070 | −5,77 | ||||
| 2025-07-18 | 13F | Bartlett & Co. Wealth Management Llc | 44 | 0,00 | 1 | 0,00 | ||||
| 2025-07-08 | 13F | Apella Capital, LLC | 25 742 | −7,34 | 841 | 1,08 | ||||
| 2025-08-14 | 13F | Great Valley Advisor Group, Inc. | 21 804 | 27,35 | 692 | 26,51 | ||||
| 2025-08-13 | 13F | Northwestern Mutual Wealth Management Co | 58 506 | −2,25 | 1 858 | −2,82 | ||||
| 2025-08-27 | 13F | Stonebridge Wealth Management, LLC | 228 427 | 7 255 | ||||||
| 2025-07-29 | 13F | Private Trust Co Na | 1 296 | −39,97 | 41 | −40,58 | ||||
| 2025-07-10 | 13F | Focus Financial Network, Inc. | 13 006 | 2,46 | 413 | 1,98 | ||||
| 2025-07-16 | 13F | Old North State Wealth Management, LLC | 41 811 | −0,19 | 1 328 | −0,75 | ||||
| 2025-07-31 | 13F | Sharper & Granite LLC | 22 760 | −1,39 | 751 | 1,90 | ||||
| 2025-08-14 | 13F | Raymond James Financial Inc | 940 510 | −2,65 | 29 871 | −3,26 | ||||
| 2025-07-24 | 13F | Cyndeo Wealth Partners, LLC | 0 | −100,00 | 0 | |||||
| 2025-08-12 | 13F | Vestor Capital, Llc | 1 243 | −98,20 | 0 | −100,00 | ||||
| 2025-08-12 | 13F | AlphaCore Capital LLC | 525 | 17 | ||||||
| 2025-05-02 | 13F | Napatree Capital Llc | 6 692 | −2,76 | 214 | −9,75 | ||||
| 2025-08-08 | 13F | Crossmark Global Holdings, Inc. | 7 951 | −23,30 | 253 | −23,87 | ||||
| 2025-08-12 | 13F | Del-Sette Capital Management, LLC | 164 390 | −0,34 | 5 221 | −0,95 | ||||
| 2025-08-07 | 13F | LOM Asset Management Ltd | 11 000 | 0 | ||||||
| 2025-08-12 | 13F | PSI Advisors, LLC | 0 | −100,00 | 0 | |||||
| 2025-07-31 | 13F | BIP Wealth, LLC | 250 797 | 2,56 | 7 965 | 1,92 | ||||
| 2025-08-08 | 13F | Avantax Advisory Services, Inc. | 100 168 | −6,96 | 3 181 | −7,53 | ||||
| 2025-08-26 | 13F/A | Thrivent Financial For Lutherans | 68 484 | 2 | ||||||
| 2025-08-14 | 13F | Archetype Wealth Partners | 14 119 | 0,68 | 0 | |||||
| 2025-08-19 | 13F | Advisory Services Network, LLC | 13 292 | 34,62 | 424 | 34,29 | ||||
| 2025-08-14 | 13F | Goldman Sachs Group Inc | 19 653 | 18,66 | 624 | 17,96 |