Grundläggande statistik
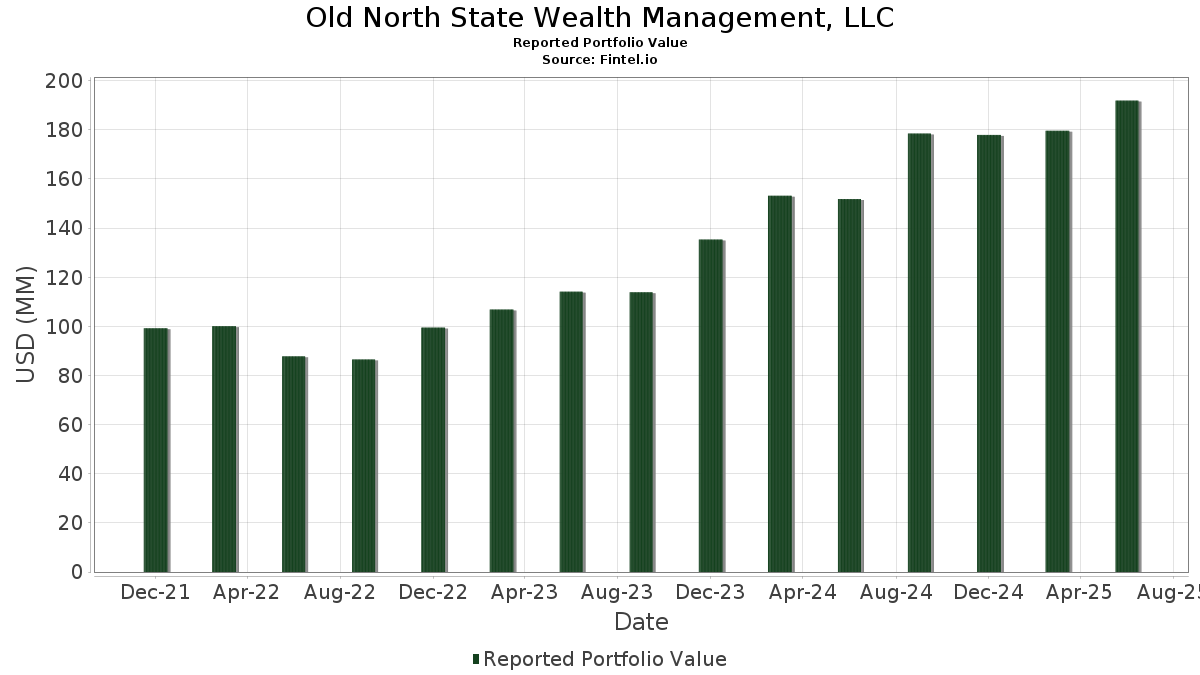
| Portföljvärde | $ 191 922 226 |
| Aktuella positioner | 120 |
Senaste innehav, resultat, förvaltat kapital (från 13F, 13D)
Old North State Wealth Management, LLC har redovisat 120 totala innehav i sina senaste SEC-arkiveringar. Det senaste portföljvärdet beräknas vara $ 191 922 226 USD. Faktiskt förvaltade tillgångar (AUM) är detta värde plus likvida medel (som inte redovisas). Old North State Wealth Management, LLCs största innehav är Berkshire Hathaway Inc. (US:BRK.B) , Amazon.com, Inc. (US:AMZN) , CVS Health Corporation (US:CVS) , Apple Inc. (US:AAPL) , and Gilead Sciences, Inc. (US:GILD) . Old North State Wealth Management, LLCs nya positioner inkluderar GE Vernova Inc. (US:GEV) , Vanguard Index Funds - Vanguard Small-Cap Value ETF (US:VBR) , Abbott Laboratories (US:ABT) , EOG Resources, Inc. (US:EOG) , and UnitedHealth Group Incorporated (US:UNH) .
Största ökningarna detta kvartal
Vi använder förändringen i portföljallokeringen eftersom det är det mest meningsfulla måttet. Förändringar kan bero på transaktioner eller förändringar i aktiekurser.
| Värdepapper | Aktier (MM) |
Värde (MM$) |
Portfölj % av | ΔPortfölj % av |
|---|---|---|---|---|
| 0,04 | 5,62 | 2,9271 | 1,1129 | |
| 0,00 | 1,65 | 0,8572 | 0,5491 | |
| 0,00 | 0,75 | 0,3906 | 0,3906 | |
| 0,01 | 3,89 | 2,0271 | 0,3854 | |
| 0,01 | 3,11 | 1,6224 | 0,3641 | |
| 0,04 | 8,08 | 4,2105 | 0,3492 | |
| 0,02 | 4,39 | 2,2871 | 0,3218 | |
| 0,02 | 4,48 | 2,3360 | 0,3198 | |
| 0,01 | 2,13 | 1,1112 | 0,2631 | |
| 0,02 | 3,80 | 1,9789 | 0,2301 |
Största minskningarna detta kvartal
Vi använder förändringen i portföljallokeringen eftersom det är det mest meningsfulla måttet. Förändringar kan bero på transaktioner eller förändringar i aktiepriser.
| Värdepapper | Aktier (MM) |
Värde (MM$) |
Portfölj % av | ΔPortfölj % av |
|---|---|---|---|---|
| 0,03 | 12,30 | 6,4069 | −1,5701 | |
| 0,02 | 1,38 | 0,7191 | −0,7907 | |
| 0,02 | 3,78 | 1,9711 | −0,6478 | |
| 0,01 | 1,36 | 0,7062 | −0,5335 | |
| 0,04 | 4,99 | 2,6006 | −0,3394 | |
| 0,06 | 6,21 | 3,2344 | −0,3197 | |
| 0,03 | 6,42 | 3,3462 | −0,2842 | |
| 0,29 | 5,22 | 2,7222 | −0,2203 | |
| 0,08 | 3,45 | 1,7988 | −0,1930 | |
| 0,02 | 2,54 | 1,3235 | −0,1927 |
13F- och fond arkiveringar
Denna blankett lämnades in den 2025-07-16 för rapporteringsperioden 2025-06-30. Klicka på länksymbolen för att se hela transaktionshistoriken.
Uppgradera för att låsa upp premiumdata och exportera till Excel![]() .
.
| Värdepapper | Typ | Genomsnittligt aktiepris | Aktier (MM) |
ΔAktier (%) |
ΔAktier (%) |
Värde ($MM) |
Portfölj (%) |
ΔPortfölj (%) |
|
|---|---|---|---|---|---|---|---|---|---|
| BRK.B / Berkshire Hathaway Inc. | 0,03 | −5,92 | 12,30 | −14,19 | 6,4069 | −1,5701 | |||
| AMZN / Amazon.com, Inc. | 0,04 | 1,03 | 8,08 | 16,49 | 4,2105 | 0,3492 | |||
| CVS / CVS Health Corporation | 0,10 | 2,37 | 6,69 | 4,22 | 3,4853 | −0,0875 | |||
| AAPL / Apple Inc. | 0,03 | 6,61 | 6,42 | −1,52 | 3,3462 | −0,2842 | |||
| GILD / Gilead Sciences, Inc. | 0,06 | −1,73 | 6,21 | −2,77 | 3,2344 | −0,3197 | |||
| F / Ford Motor Company | 0,54 | −2,92 | 5,90 | 5,02 | 3,0767 | −0,0531 | |||
| NVDA / NVIDIA Corporation | 0,04 | 18,24 | 5,62 | 72,35 | 2,9271 | 1,1129 | |||
| ET / Energy Transfer LP - Limited Partnership | 0,29 | 1,34 | 5,22 | −1,15 | 2,7222 | −0,2203 | |||
| MHO / M/I Homes, Inc. | 0,04 | −3,76 | 4,99 | −5,49 | 2,6006 | −0,3394 | |||
| FMC / FMC Corporation | 0,12 | 5,09 | 4,84 | 4,04 | 2,5237 | −0,0678 | |||
| BA / The Boeing Company | 0,02 | 0,75 | 4,48 | 23,77 | 2,3360 | 0,3198 | |||
| VEEV / Veeva Systems Inc. | 0,02 | 0,00 | 4,39 | 24,33 | 2,2871 | 0,3218 | |||
| ENB / Enbridge Inc. | 0,09 | −1,74 | 4,24 | 0,50 | 2,2111 | −0,1397 | |||
| SWK / Stanley Black & Decker, Inc. | 0,06 | 27,19 | 4,06 | 12,01 | 2,1136 | 0,0978 | |||
| MSFT / Microsoft Corporation | 0,01 | −0,46 | 3,89 | 31,91 | 2,0271 | 0,3854 | |||
| HII / Huntington Ingalls Industries, Inc. | 0,02 | 2,15 | 3,80 | 20,89 | 1,9789 | 0,2301 | |||
| BDX / Becton, Dickinson and Company | 0,02 | 6,92 | 3,78 | −19,58 | 1,9711 | −0,6478 | |||
| VTV / Vanguard Index Funds - Vanguard Value ETF | 0,02 | 3,88 | 3,72 | 6,28 | 1,9394 | −0,0101 | |||
| MDT / Medtronic plc | 0,04 | 4,70 | 3,60 | 1,55 | 1,8741 | −0,0971 | |||
| SW / Smurfit Westrock Plc | 0,08 | 0,75 | 3,45 | −3,52 | 1,7988 | −0,1930 | |||
| PYPL / PayPal Holdings, Inc. | 0,04 | 1,66 | 3,30 | 15,81 | 1,7183 | 0,1329 | |||
| DUK / Duke Energy Corporation | 0,03 | 4,19 | 3,28 | 0,77 | 1,7084 | −0,1025 | |||
| TSM / Taiwan Semiconductor Manufacturing Company Limited - Depositary Receipt (Common Stock) | 0,01 | 0,96 | 3,11 | 37,74 | 1,6224 | 0,3641 | |||
| VB / Vanguard Index Funds - Vanguard Small-Cap ETF | 0,01 | −4,82 | 3,07 | 1,72 | 1,5998 | −0,0806 | |||
| BWA / BorgWarner Inc. | 0,09 | 1,49 | 2,96 | 18,58 | 1,5433 | 0,1530 | |||
| LYB / LyondellBasell Industries N.V. | 0,05 | 16,47 | 2,65 | −4,30 | 1,3788 | −0,1605 | |||
| KHC / The Kraft Heinz Company | 0,10 | 13,18 | 2,60 | −3,98 | 1,3569 | −0,1528 | |||
| BIIB / Biogen Inc. | 0,02 | 1,61 | 2,54 | −6,72 | 1,3235 | −0,1927 | |||
| PFE / Pfizer Inc. | 0,10 | 14,13 | 2,44 | 9,16 | 1,2727 | 0,0272 | |||
| KMI / Kinder Morgan, Inc. | 0,08 | 3,85 | 2,31 | 6,98 | 1,2057 | 0,0020 | |||
| GOOGL / Alphabet Inc. | 0,01 | 22,82 | 2,13 | 39,99 | 1,1112 | 0,2631 | |||
| GLW / Corning Incorporated | 0,04 | 0,54 | 2,12 | 15,47 | 1,1051 | 0,0829 | |||
| VZ / Verizon Communications Inc. | 0,05 | 5,40 | 2,02 | 0,55 | 1,0515 | −0,0658 | |||
| ALB / Albemarle Corporation | 0,03 | 17,68 | 1,86 | 2,36 | 0,9714 | −0,0423 | |||
| RTX / RTX Corporation | 0,01 | 0,47 | 1,75 | 10,72 | 0,9096 | 0,0322 | |||
| VTI / Vanguard Index Funds - Vanguard Total Stock Market ETF | 0,01 | 14,52 | 1,70 | 26,64 | 0,8872 | 0,1387 | |||
| OMC / Omnicom Group Inc. | 0,02 | 7,28 | 1,67 | −6,92 | 0,8688 | −0,1283 | |||
| VOO / Vanguard Index Funds - Vanguard S&P 500 ETF | 0,00 | 169,37 | 1,65 | 197,47 | 0,8572 | 0,5491 | |||
| MAR / Marriott International, Inc. | 0,01 | 0,02 | 1,54 | 14,71 | 0,8047 | 0,0552 | |||
| VIG / Vanguard Specialized Funds - Vanguard Dividend Appreciation ETF | 0,01 | −0,67 | 1,52 | 4,81 | 0,7942 | −0,0154 | |||
| MRK / Merck & Co., Inc. | 0,02 | 8,21 | 1,45 | −4,54 | 0,7568 | −0,0904 | |||
| VTR / Ventas, Inc. | 0,02 | −44,61 | 1,38 | −49,12 | 0,7191 | −0,7907 | |||
| XOM / Exxon Mobil Corporation | 0,01 | −32,88 | 1,36 | −39,16 | 0,7062 | −0,5335 | |||
| THO / THOR Industries, Inc. | 0,01 | 12,14 | 1,33 | 31,36 | 0,6923 | 0,1291 | |||
| DES / WisdomTree Trust - WisdomTree U.S. SmallCap Dividend Fund | 0,04 | −0,19 | 1,33 | −0,75 | 0,6920 | −0,0533 | |||
| JPM / JPMorgan Chase & Co. | 0,00 | 9,96 | 0,96 | 30,00 | 0,5014 | 0,0891 | |||
| JNJ / Johnson & Johnson | 0,01 | −7,29 | 0,92 | −14,59 | 0,4790 | −0,1201 | |||
| VXUS / Vanguard STAR Funds - Vanguard Total International Stock ETF | 0,01 | 0,72 | 0,83 | 11,99 | 0,4333 | 0,0202 | |||
| GSLC / Goldman Sachs ETF Trust - Goldman Sachs ActiveBeta U.S. Large Cap Equity ETF | 0,01 | 0,21 | 0,82 | 10,53 | 0,4270 | 0,0142 | |||
| META / Meta Platforms, Inc. | 0,00 | 29,27 | 0,82 | 65,52 | 0,4256 | 0,1510 | |||
| ICSH / iShares U.S. ETF Trust - iShares Ultra Short Duration Bond Active ETF | 0,02 | −19,44 | 0,79 | −19,36 | 0,4101 | −0,1337 | |||
| IWB / iShares Trust - iShares Russell 1000 ETF | 0,00 | 0,27 | 0,77 | 10,98 | 0,4004 | 0,0150 | |||
| HSY / The Hershey Company | 0,00 | 18,78 | 0,77 | 15,21 | 0,3988 | 0,0289 | |||
| GEV / GE Vernova Inc. | 0,00 | 0,75 | 0,3906 | 0,3906 | |||||
| GIS / General Mills, Inc. | 0,01 | 19,11 | 0,72 | 3,28 | 0,3775 | −0,0133 | |||
| VTRS / Viatris Inc. | 0,08 | −4,14 | 0,70 | −1,68 | 0,3669 | −0,0319 | |||
| CTVA / Corteva, Inc. | 0,01 | 9,33 | 0,67 | 29,38 | 0,3468 | 0,0605 | |||
| NOC / Northrop Grumman Corporation | 0,00 | 2,39 | 0,65 | 0,31 | 0,3369 | −0,0219 | |||
| EPD / Enterprise Products Partners L.P. - Limited Partnership | 0,02 | 1,58 | 0,58 | −7,74 | 0,3047 | −0,0481 | |||
| VOE / Vanguard Index Funds - Vanguard Mid-Cap Value ETF | 0,00 | 7,55 | 0,58 | 10,19 | 0,3045 | 0,0091 | |||
| PEP / PepsiCo, Inc. | 0,00 | 10,56 | 0,58 | −2,67 | 0,3038 | −0,0299 | |||
| ADBE / Adobe Inc. | 0,00 | −0,40 | 0,58 | 0,52 | 0,3030 | −0,0192 | |||
| CVX / Chevron Corporation | 0,00 | 5,98 | 0,57 | −9,32 | 0,2993 | −0,0533 | |||
| IYW / iShares Trust - iShares U.S. Technology ETF | 0,00 | −1,85 | 0,57 | 21,23 | 0,2979 | 0,0352 | |||
| NXPI / NXP Semiconductors N.V. | 0,00 | 3,47 | 0,57 | 19,08 | 0,2963 | 0,0302 | |||
| GSK / GSK plc - Depositary Receipt (Common Stock) | 0,01 | 2,95 | 0,57 | 1,98 | 0,2958 | −0,0138 | |||
| TT / Trane Technologies plc | 0,00 | 5,18 | 0,56 | 36,50 | 0,2924 | 0,0634 | |||
| TSLA / Tesla, Inc. | 0,00 | 11,72 | 0,55 | 37,13 | 0,2889 | 0,0635 | |||
| GE / General Electric Company | 0,00 | 1,89 | 0,54 | 31,23 | 0,2825 | 0,0523 | |||
| VOT / Vanguard Index Funds - Vanguard Mid-Cap Growth ETF | 0,00 | 11,62 | 0,53 | 29,58 | 0,2767 | 0,0487 | |||
| BUD / Anheuser-Busch InBev SA/NV - Depositary Receipt (Common Stock) | 0,01 | −4,35 | 0,51 | 6,88 | 0,2674 | 0,0001 | |||
| AVGO / Broadcom Inc. | 0,00 | 27,18 | 0,50 | 109,75 | 0,2583 | 0,1264 | |||
| LMT / Lockheed Martin Corporation | 0,00 | 2,73 | 0,49 | 6,52 | 0,2555 | −0,0010 | |||
| AJG / Arthur J. Gallagher & Co. | 0,00 | 14,47 | 0,48 | 6,26 | 0,2476 | −0,0015 | |||
| FE / FirstEnergy Corp. | 0,01 | 1,76 | 0,45 | 1,57 | 0,2366 | −0,0128 | |||
| DTE / DTE Energy Company | 0,00 | 0,74 | 0,45 | −3,41 | 0,2361 | −0,0254 | |||
| ES / Eversource Energy | 0,01 | 3,86 | 0,45 | 6,38 | 0,2348 | −0,0010 | |||
| BMY / Bristol-Myers Squibb Company | 0,01 | 4,01 | 0,45 | −21,06 | 0,2329 | −0,0821 | |||
| PHIN / PHINIA Inc. | 0,01 | 1,62 | 0,44 | 6,75 | 0,2309 | −0,0007 | |||
| SCHB / Schwab Strategic Trust - Schwab U.S. Broad Market ETF | 0,02 | 1,10 | 0,42 | 11,97 | 0,2198 | 0,0100 | |||
| NFLX / Netflix, Inc. | 0,00 | 20,00 | 0,40 | 72,10 | 0,2093 | 0,0795 | |||
| NUE / Nucor Corporation | 0,00 | 0,33 | 0,40 | 7,90 | 0,2067 | 0,0022 | |||
| BAC / Bank of America Corporation | 0,01 | 0,55 | 0,39 | 14,29 | 0,2044 | 0,0129 | |||
| IPG / The Interpublic Group of Companies, Inc. | 0,02 | 9,02 | 0,38 | −1,80 | 0,1989 | −0,0173 | |||
| SPY / SPDR S&P 500 ETF | 0,00 | 48,77 | 0,38 | 64,19 | 0,1961 | 0,0681 | |||
| VBR / Vanguard Index Funds - Vanguard Small-Cap Value ETF | 0,00 | 0,37 | 0,1913 | 0,1913 | |||||
| MA / Mastercard Incorporated | 0,00 | 2,38 | 0,36 | 4,91 | 0,1895 | −0,0032 | |||
| AXSM / Axsome Therapeutics, Inc. | 0,00 | 0,00 | 0,36 | −10,45 | 0,1877 | −0,0363 | |||
| VONG / Vanguard Scottsdale Funds - Vanguard Russell 1000 Growth ETF | 0,00 | 0,09 | 0,35 | 18,06 | 0,1841 | 0,0172 | |||
| WEC / WEC Energy Group, Inc. | 0,00 | 4,10 | 0,35 | −0,28 | 0,1836 | −0,0134 | |||
| BLD / TopBuild Corp. | 0,00 | 0,35 | 0,1822 | 0,1822 | |||||
| SCHD / Schwab Strategic Trust - Schwab U.S. Dividend Equity ETF | 0,01 | −1,66 | 0,35 | −7,01 | 0,1802 | −0,0264 | |||
| TMO / Thermo Fisher Scientific Inc. | 0,00 | 24,07 | 0,33 | 1,24 | 0,1702 | −0,0096 | |||
| CTRA / Coterra Energy Inc. | 0,01 | 4,67 | 0,32 | −8,02 | 0,1676 | −0,0272 | |||
| PLTR / Palantir Technologies Inc. | 0,00 | −22,07 | 0,32 | 25,79 | 0,1655 | 0,0250 | |||
| SLB / Schlumberger Limited | 0,01 | 24,06 | 0,31 | 0,32 | 0,1622 | −0,0106 | |||
| WHR / Whirlpool Corporation | 0,00 | 20,04 | 0,30 | 35,14 | 0,1563 | 0,0327 | |||
| T / AT&T Inc. | 0,01 | −11,71 | 0,30 | −9,73 | 0,1550 | −0,0283 | |||
| QQQ / Invesco QQQ Trust, Series 1 | 0,00 | 3,30 | 0,30 | 21,90 | 0,1537 | 0,0185 | |||
| LOW / Lowe's Companies, Inc. | 0,00 | 13,44 | 0,28 | 8,08 | 0,1466 | 0,0015 | |||
| XHB / SPDR Series Trust - SPDR S&P Homebuilders ETF | 0,00 | 0,15 | 0,27 | 1,89 | 0,1411 | −0,0069 | |||
| TD / The Toronto-Dominion Bank | 0,00 | −9,62 | 0,27 | 10,88 | 0,1382 | 0,0049 | |||
| SDY / SPDR Series Trust - SPDR S&P Dividend ETF | 0,00 | 0,69 | 0,26 | 0,78 | 0,1350 | −0,0082 | |||
| KMB / Kimberly-Clark Corporation | 0,00 | 10,36 | 0,26 | 0,00 | 0,1346 | −0,0091 | |||
| IVV / iShares Trust - iShares Core S&P 500 ETF | 0,00 | 0,50 | 0,25 | 11,01 | 0,1313 | 0,0047 | |||
| COST / Costco Wholesale Corporation | 0,00 | 0,00 | 0,25 | 5,15 | 0,1277 | −0,0025 | |||
| SPGP / Invesco Exchange-Traded Fund Trust - Invesco S&P 500 GARP ETF | 0,00 | 0,36 | 0,24 | 8,04 | 0,1265 | 0,0016 | |||
| IR / Ingersoll Rand Inc. | 0,00 | −2,67 | 0,24 | 1,27 | 0,1247 | −0,0070 | |||
| CRM / Salesforce, Inc. | 0,00 | 2,01 | 0,24 | 3,96 | 0,1232 | −0,0036 | |||
| WMT / Walmart Inc. | 0,00 | 0,24 | 0,1229 | 0,1229 | |||||
| ABT / Abbott Laboratories | 0,00 | 0,23 | 0,1205 | 0,1205 | |||||
| COKE / Coca-Cola Consolidated, Inc. | 0,00 | 905,08 | 0,22 | −16,92 | 0,1152 | −0,0333 | |||
| VOOV / Vanguard Admiral Funds - Vanguard S&P 500 Value ETF | 0,00 | 0,44 | 0,22 | 2,84 | 0,1134 | −0,0043 | |||
| HON / Honeywell International Inc. | 0,00 | 0,22 | 0,1134 | 0,1134 | |||||
| OXY / Occidental Petroleum Corporation | 0,01 | 15,72 | 0,22 | −1,36 | 0,1131 | −0,0096 | |||
| VO / Vanguard Index Funds - Vanguard Mid-Cap ETF | 0,00 | 0,22 | 0,1121 | 0,1121 | |||||
| EOG / EOG Resources, Inc. | 0,00 | 0,21 | 0,1109 | 0,1109 | |||||
| UNH / UnitedHealth Group Incorporated | 0,00 | 0,21 | 0,1068 | 0,1068 | |||||
| IBM / International Business Machines Corporation | 0,00 | 0,20 | 0,1056 | 0,1056 | |||||
| TRI N / Thomson Reuters Corporation | 0,00 | 0,20 | 0,1054 | 0,1054 | |||||
| CI / The Cigna Group | 0,00 | −100,00 | 0,00 | 0,0000 |