Grundläggande statistik
| Institutionella ägare | 338 total, 337 long only, 0 short only, 1 long/short - change of 5,59% MRQ |
| Genomsnittlig portföljallokering | 0.6592 % - change of −3,22% MRQ |
| Institutionella aktier (lång) | 12 569 951 (ex 13D/G) - change of 1,15MM shares 9,95% MRQ |
| Institutionellt värde (lång) | $ 3 437 942 USD ($1000) |
Institutionellt ägande och aktieägare
Vanguard Scottsdale Funds - Vanguard Russell 1000 ETF (US:VONE) har 338 Institutionella ägare och aktieägare som har lämnat in 13D/G- eller 13F-formulär till Securities Exchange Commission (SEC). Dessa institut innehar totalt 12,569,951 aktier. Största aktieägare inkluderar Morgan Stanley, Fmr Llc, Ameriprise Financial Inc, UBS Group AG, Red Cedar Investment Management, Llc, Bank of New York Mellon Corp, Stifel Financial Corp, Bank Of America Corp /de/, Warren Averett Asset Management, LLC, and Raymond James Financial Inc .
Vanguard Scottsdale Funds - Vanguard Russell 1000 ETF (NasdaqGM:VONE) Institutionell ägarstruktur visar institutioners och fonders nuvarande positioner i företaget, samt de senaste förändringarna i positionernas storlek. Större aktieägare kan vara enskilda investerare, fonder, hedgefonder eller institutioner. Bilaga 13D visar att investeraren äger (eller ägde) mer än 5% av företaget och avser (eller avsåg) att aktivt eftersträva en förändring av affärsstrategin. Schedule 13G indikerar en passiv investering på över 5%.
The share price as of September 12, 2025 is 299,12 / share. Previously, on September 16, 2024, the share price was 254,87 / share. This represents an increase of 17,36% over that period.

Fondsentimentets poäng
Fondsentimentet poängen(fka Ägarackumulation-poäng) visar vilka aktier som är mest köpta av fonder. Det är resultatet av en sofistikerad kvantitativ flerfaktormodell som identifierar företag med de högsta nivåerna av institutionell ackumulering. Poängsättningsmodellen använder en kombination av den totala ökningen av redovisade ägare, förändringarna i portföljallokeringarna för dessa ägare och andra mått. Siffran sträcker sig från 0 till 100, där högre siffror indikerar en högre nivå av ackumulering i förhållande till sina konkurrenter, och 50 är genomsnittet.
Uppdateringsfrekvens: Dagligen
Se Ownership Explorer, som innehåller en lista över de högst rankade företagen.
Institutionell sälj/köp-kvot
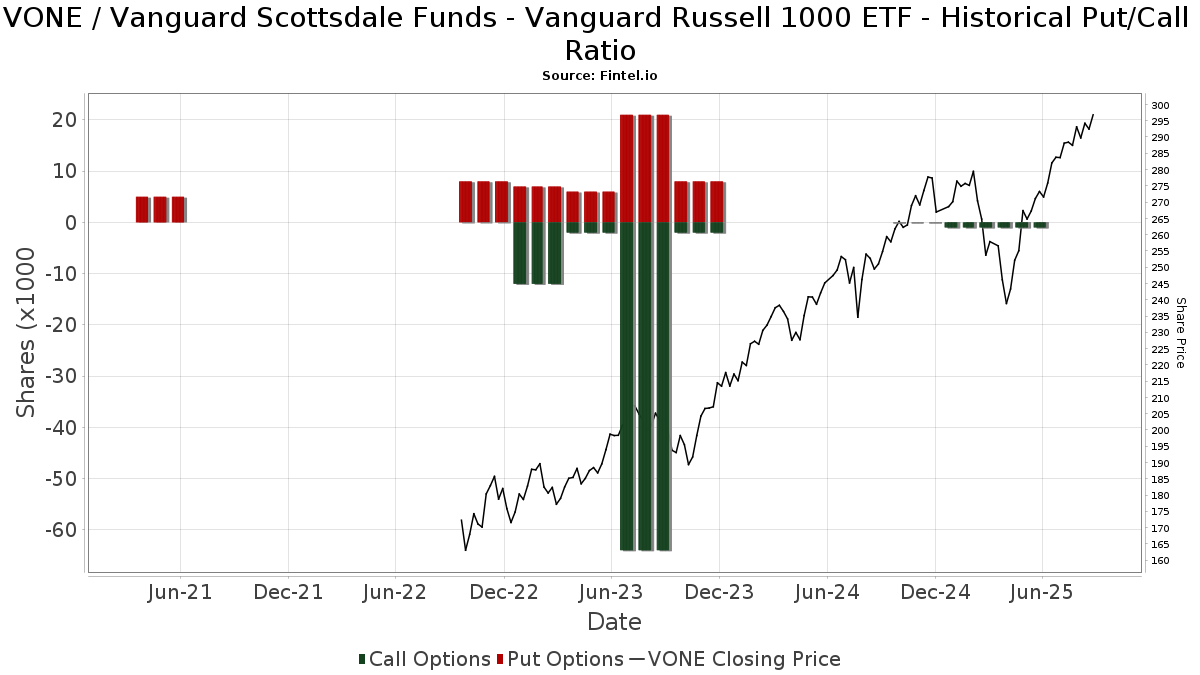
Förutom att rapportera vanliga eget kapital- och skuldemissioner måste institutioner med mer än 100MM tillgångar under förvaltning också avslöja sina innehav av sälj- och köpoptioner. Eftersom säljoptioner i allmänhet indikerar ett negativt sentiment och köpoptioner indikerar ett positivt sentiment, kan vi få en uppfattning om det övergripande institutionella sentimentet genom att plotta förhållandet mellan säljoptioner och köpoptioner. Diagrammet till höger visar det historiska förhållandet mellan sälj- och köpoptioner för detta instrument.
Genom att använda sälj/köp-kvoten som en indikator på aktieägarnas sentiment undviker man en av de största bristerna med att använda det totala institutionella ägandet, nämligen att en betydande del av de förvaltade tillgångarna investeras passivt för att följa index. Passivt förvaltade fonder köper vanligtvis inte optioner, så indikatorn för sälj/köp-kvoten ger en bättre bild av stämningen i aktivt förvaltade fonder.
13D/G-Arkiveringar
Vi presenterar 13D/G-arkiveringar separat från 13F-arkiveringar på grund av att de behandlas olika av SEC. 13D/G-arkiveringar kan lämnas in av grupper av investerare (med en ledare), medan 13F-arkiveringar inte kan det. Detta leder till situationer där en investerare kan lämna in en 13D/G-ansökan med ett värde för de totala aktierna (vilket motsvarar alla aktier som ägs av investerargruppen), men sedan lämna in en 13F-ansökan med ett annat värde för de totala aktierna (vilket motsvarar enbart deras eget ägande). Detta innebär att aktieägandet i 13D/G-arkiveringar och 13F-arkiveringar ofta inte är direkt jämförbara, så vi presenterar dem separat.
Notera: Från och med den 16 maj 2021 visar vi inte längre ägare som inte har lämnat in en 13D/G under det senaste året. Tidigare visade vi hela historiken för 13D/G-arkiveringar. I allmänhet måste enheter som är skyldiga att lämna in 13D/G-arkiveringar lämna in minst en gång per år innan de lämnar in en stängningsarkivering. Fonder avslutar dock ibland positioner utan att lämna in en avslutande arkivering (dvs. de avvecklar), så att visa hela historiken resulterade ibland i förvirring om det nuvarande ägandet. För att förhindra förvirring visar vi nu endast "nuvarande" ägare - det vill säga ägare som har lämnat in en ansökan under det senaste året.
Upgrade to unlock premium data.
13F- och NPORT-arkiveringar
Detaljer om 13F-arkiveringar är gratis. Detaljer om NP-arkiveringar kräver ett premiummedlemskap. Gröna rader indikerar nya positioner. Röda rader indikerar stängda positioner. Klicka på länk symbolen för att se hela transaktionshistoriken.
Uppgradera
för att låsa upp premiumdata och exportera till Excel ![]() .
.
| Fil Datum | Källa | Investerare | Typ | Genomsnittligt pris (beräknat) |
Aktier | Δ Aktier (%) |
Rapporterat värde (1000 USD) |
Δ Värde (%) |
Portföljallokering (%) |
|
|---|---|---|---|---|---|---|---|---|---|---|
| 2025-08-07 | 13F | Kestra Private Wealth Services, Llc | 2 105 | 0,10 | 591 | 10,88 | ||||
| 2025-08-07 | 13F | Midwest Trust Co | 2 760 | 775 | ||||||
| 2025-08-01 | 13F | Zhang Financial LLC | 15 490 | −3,87 | 4 351 | 6,36 | ||||
| 2025-08-07 | 13F | W Advisors, Llc | 1 377 | 387 | ||||||
| 2025-08-14 | 13F | Wick Capital Partners, LLC | 2 857 | −8,66 | 859 | 8,06 | ||||
| 2025-08-15 | 13F | Kestra Advisory Services, LLC | 9 131 | −0,58 | 2 565 | 10,00 | ||||
| 2025-05-08 | 13F | Us Financial Advisors, Llc | 18 181 | −1,28 | 4 616 | −6,03 | ||||
| 2025-07-14 | 13F | Park Avenue Securities Llc | 2 155 | 0,94 | 1 | |||||
| 2025-07-22 | 13F | Grimes & Company, Inc. | 834 | 234 | ||||||
| 2025-07-31 | 13F | Buckingham Strategic Partners | 1 280 | 0,31 | 360 | 10,80 | ||||
| 2025-08-11 | 13F | Wealthspire Advisors, LLC | 5 446 | 0,29 | 1 530 | 10,96 | ||||
| 2025-08-14 | 13F | Glenmede Investment Management, LP | 6 880 | 1 932 | ||||||
| 2025-08-14 | 13F | Citadel Advisors Llc | 10 479 | 2 943 | ||||||
| 2025-08-05 | 13F | American Capital Advisory, LLC | 1 105 | −0,81 | 310 | 9,93 | ||||
| 2025-08-14 | 13F | Mariner, LLC | 26 421 | −0,09 | 7 418 | 10,49 | ||||
| 2025-07-25 | 13F | NorthRock Partners, LLC | 265 | 0,00 | 74 | 10,45 | ||||
| 2025-07-18 | 13F | Bartlett & Co. Wealth Management Llc | 0 | −100,00 | 0 | |||||
| 2025-08-13 | 13F | Northern Trust Corp | 44 273 | −0,83 | 12 435 | 9,71 | ||||
| 2025-07-23 | 13F | Indiana Trust & Investment Management CO | 4 571 | −14,64 | 1 284 | −5,59 | ||||
| 2025-08-14 | 13F | Raymond James Financial Inc | 289 764 | 7,76 | 81 383 | 19,22 | ||||
| 2025-08-14 | 13F | Integrated Wealth Concepts LLC | 3 383 | −0,94 | 950 | 9,57 | ||||
| 2025-08-08 | 13F | Pnc Financial Services Group, Inc. | 1 055 | 0,00 | 296 | 10,86 | ||||
| 2025-07-28 | 13F | Tlwm | 1 309 | −16,89 | 368 | −8,02 | ||||
| 2025-08-13 | 13F | Solidarilty Wealth, LLC | 824 | 0,00 | 231 | 10,53 | ||||
| 2025-08-08 | 13F | Kingsview Wealth Management, LLC | 1 413 | −0,35 | 397 | 10,31 | ||||
| 2025-07-08 | 13F | Heartwood Wealth Advisors LLC | 140 494 | 0,22 | 39 459 | 10,87 | ||||
| 2025-04-02 | 13F | Clark Asset Management, LLC | 0 | −100,00 | 0 | −100,00 | ||||
| 2025-08-07 | 13F | Evoke Wealth, Llc | 94 005 | −2,94 | 26 402 | 7,38 | ||||
| 2025-07-31 | 13F | Schoolcraft Capital LLC | 8 985 | 23,34 | 2 523 | 36,45 | ||||
| 2025-05-06 | 13F | MCF Advisors LLC | 0 | −100,00 | 0 | |||||
| 2025-07-28 | 13F | Brown Financial Advisory | 11 985 | −0,10 | 3 366 | 10,54 | ||||
| 2025-07-24 | 13F | IFP Advisors, Inc | 0 | −100,00 | 0 | −100,00 | ||||
| 2025-08-11 | 13F | FSC Wealth Advisors, LLC | 125 | 0,81 | 35 | 12,90 | ||||
| 2025-08-14 | 13F | CoreCap Advisors, LLC | 632 | 0,00 | 178 | 10,63 | ||||
| 2025-08-11 | 13F | Vanguard Group Inc | 92 406 | 80,04 | 25 953 | 99,19 | ||||
| 2025-08-14 | 13F | Quantum Capital Management, LLC / NJ | 9 354 | 2 627 | ||||||
| 2025-07-22 | 13F | Berkshire Money Management, Inc. | 5 516 | 1 549 | ||||||
| 2025-08-13 | 13F | Congress Wealth Management LLC / DE / | 919 | 258 | ||||||
| 2025-08-11 | 13F | CBIZ Investment Advisory Services, LLC | 19 041 | 0,74 | 5 348 | 11,44 | ||||
| 2025-08-05 | 13F | Huntington National Bank | 0 | |||||||
| 2025-08-13 | 13F | Beacon Pointe Advisors, LLC | 114 232 | −1,53 | 32 083 | 8,94 | ||||
| 2025-07-15 | 13F | Fifth Third Bancorp | 1 740 | 0,00 | 489 | 10,66 | ||||
| 2025-08-12 | 13F | Howe & Rusling Inc | 80 | 0,00 | 23 | 10,00 | ||||
| 2025-08-13 | 13F | Jones Financial Companies Lllp | 67 038 | 137,59 | 18 736 | 162,91 | ||||
| 2025-08-14 | 13F | Wells Fargo & Company/mn | 221 773 | 0,01 | 62 287 | 10,65 | ||||
| 2025-08-14 | 13F | Monograph Wealth Advisors, Llc | 1 855 | 521 | ||||||
| 2025-07-18 | 13F | Centricity Wealth Management, LLC | 2 722 | 0,00 | 765 | 10,72 | ||||
| 2025-07-23 | 13F | ETF Portfolio Partners, Inc. | 6 540 | 0,00 | 1 837 | 10,60 | ||||
| 2025-08-14 | 13F | Betterment LLC | 2 464 | 1 | ||||||
| 2025-07-31 | 13F | Jordan Park Group LLC | 86 323 | 24 245 | ||||||
| 2025-08-14 | 13F | GWM Advisors LLC | 8 983 | 4,58 | 2 523 | 15,69 | ||||
| 2025-07-15 | 13F | Mather Group, Llc. | 1 168 | 0,00 | 328 | 10,47 | ||||
| 2025-07-24 | 13F | Ronald Blue Trust, Inc. | 2 778 | 7,13 | 780 | 18,54 | ||||
| 2025-07-15 | 13F | Financial Management Professionals, Inc. | 743 | 0,00 | 209 | 10,64 | ||||
| 2025-07-08 | 13F | Parallel Advisors, LLC | 9 635 | 0,00 | 2 706 | 10,67 | ||||
| 2025-07-25 | 13F | Astoria Portfolio Advisors LLC. | 1 717 | −8,28 | 495 | 8,79 | ||||
| 2025-08-06 | 13F | Savant Capital, LLC | 23 089 | −2,12 | 6 485 | 8,28 | ||||
| 2025-08-19 | 13F | National Asset Management, Inc. | 1 534 | 0,26 | 431 | 5,39 | ||||
| 2025-07-15 | 13F | Highland Financial Advisors, LLC | 0 | −100,00 | 0 | |||||
| 2025-08-14 | 13F/A | Skopos Labs, Inc. | 1 460 | 410 | ||||||
| 2025-07-21 | 13F | Precedent Wealth Partners, Llc | 6 278 | −3,96 | 1 763 | 6,27 | ||||
| 2025-07-22 | 13F | Kickstand Ventures, Llc. | 0 | −100,00 | 0 | |||||
| 2025-08-08 | 13F | Brogan Financial, Inc. | 1 260 | −1,95 | 354 | 8,28 | ||||
| 2025-08-07 | 13F | Allworth Financial LP | 22 553 | 1,28 | 6 334 | 14,66 | ||||
| 2025-08-08 | 13F | Comprehensive Financial Planning, Inc./PA | 51 | 0,00 | 14 | 16,67 | ||||
| 2025-08-05 | 13F | Bank Of Montreal /can/ | 216 413 | 3 660,43 | 60 782 | 4 063,08 | ||||
| 2025-08-13 | 13F | Lido Advisors, LLC | 935 | 0,11 | 263 | 10,55 | ||||
| 2025-08-18 | 13F/A | National Bank Of Canada /fi/ | 100 | −28,57 | 28 | −20,00 | ||||
| 2025-08-13 | 13F | SageView Advisory Group, LLC | 1 658 | 0,00 | 480 | 14,29 | ||||
| 2025-07-25 | 13F | Retirement Planning Group, Llc / Ny | 8 250 | −1,81 | 2 317 | 8,68 | ||||
| 2025-08-11 | 13F | TD Waterhouse Canada Inc. | 628 | −61,16 | 176 | −57,18 | ||||
| 2025-08-01 | 13F | Belvedere Trading LLC | Call | 1 600 | 0,00 | 449 | 10,59 | |||
| 2025-08-01 | 13F | Belvedere Trading LLC | Put | 200 | −66,67 | 56 | −63,16 | |||
| 2025-08-19 | 13F | Newbridge Financial Services Group, Inc. | 20 | 0,00 | 6 | 0,00 | ||||
| 2025-07-18 | 13F | Parsons Capital Management Inc/ri | 3 596 | −10,68 | 1 010 | −1,27 | ||||
| 2025-08-11 | 13F | Mill Creek Capital Advisors, LLC | 1 533 | 0,00 | 431 | 10,54 | ||||
| 2025-07-28 | 13F | Nadler Financial Group, Inc. | 15 860 | −8,72 | 4 455 | 1,00 | ||||
| 2025-07-30 | 13F | Arbor Investment Advisors, LLC | 67 202 | 8,20 | 18 874 | 19,71 | ||||
| 2025-04-09 | 13F | McLean Asset Management Corp | 0 | −100,00 | 0 | |||||
| 2025-08-11 | 13F | Berkeley, Inc | 845 | 0,00 | 237 | 10,75 | ||||
| 2025-07-02 | 13F | Central Pacific Bank - Trust Division | 31 | 0,00 | 9 | 14,29 | ||||
| 2025-07-28 | 13F | Stegner Investment Associates Inc. | 64 771 | 2,97 | 18 192 | 13,92 | ||||
| 2025-07-25 | 13F | Johnson Investment Counsel Inc | 1 955 | 0,00 | 549 | 10,69 | ||||
| 2025-08-13 | 13F | IAG Wealth Partners, LLC | 158 | 0,00 | 44 | 10,00 | ||||
| 2025-08-19 | 13F/A | Pitcairn Co | 43 749 | 0,00 | 12 287 | 10,63 | ||||
| 2025-07-17 | 13F | Tritonpoint Wealth, Llc | 0 | −100,00 | 0 | |||||
| 2025-08-13 | 13F | Colonial Trust Advisors | 1 | 0 | ||||||
| 2025-08-05 | 13F | Carolinas Wealth Consulting Llc | 0 | −100,00 | 0 | −100,00 | ||||
| 2025-07-09 | 13F | Aaron Wealth Advisors LLC | 28 101 | 0,09 | 7 893 | 10,73 | ||||
| 2025-08-06 | 13F | Modera Wealth Management, LLC | 2 319 | 0,00 | 651 | 10,71 | ||||
| 2025-08-14 | 13F | Wiley Bros.-aintree Capital, Llc | 1 574 | 1,68 | 458 | 13,68 | ||||
| 2025-08-12 | 13F | Charles Schwab Investment Management Inc | 823 | 231 | ||||||
| 2025-07-28 | 13F | Harbour Investments, Inc. | 1 526 | 3 079,17 | 429 | 3 466,67 | ||||
| 2025-08-07 | 13F | Resources Investment Advisors, LLC. | 805 | 0,12 | 226 | 10,78 | ||||
| 2025-08-13 | 13F | Continuum Advisory, LLC | 3 788 | −11,04 | 1 064 | −1,57 | ||||
| 2025-07-29 | 13F | Stratos Wealth Advisors, LLC | 22 781 | −0,68 | 6 398 | 9,87 | ||||
| 2025-08-01 | 13F | Austin Private Wealth, LLC | 138 928 | −25,23 | 39 019 | −17,28 | ||||
| 2025-08-13 | 13F | Green Harvest Asset Management LLC | 7 361 | 0,00 | 2 067 | 10,65 | ||||
| 2025-07-17 | 13F | Crane Advisory, LLC | 3 471 | −0,57 | 984 | 16,33 | ||||
| 2025-07-23 | 13F | Spectrum Asset Management, Inc. (NB/CA) | 2 163 | 1,17 | 608 | 11,99 | ||||
| 2025-07-30 | 13F | Studio Investment Management Llc | 5 133 | −6,16 | 1 442 | 3,82 | ||||
| 2025-08-12 | 13F | TCTC Holdings, LLC | 93 | 0,00 | 26 | 13,04 | ||||
| 2025-08-13 | 13F | Transce3nd, LLC | 31 | 3,33 | 9 | 14,29 | ||||
| 2025-07-11 | 13F | Farther Finance Advisors, LLC | 160 | 0,00 | 45 | 10,00 | ||||
| 2025-08-04 | 13F | Flagship Harbor Advisors, Llc | 8 109 | 1,49 | 2 277 | 12,28 | ||||
| 2025-07-16 | 13F | Flower City Capital | 218 984 | −2,72 | 61 504 | 7,63 | ||||
| 2025-08-08 | 13F | Financial Gravity Companies, Inc. | 0 | −100,00 | 0 | |||||
| 2025-08-14 | 13F | Mml Investors Services, Llc | 92 004 | 17,94 | 26 | 31,58 | ||||
| 2025-04-29 | 13F | Jackson Wealth Management, LLC | 0 | −100,00 | 0 | |||||
| 2025-07-07 | 13F | Kings Path Partners LLC | 52 | 0,00 | 15 | 7,69 | ||||
| 2025-08-07 | 13F | Wilkins Investment Counsel Inc | 1 340 | 0,00 | 376 | 10,59 | ||||
| 2025-08-14 | 13F | EP Wealth Advisors, Inc. | 1 450 | 0,00 | 407 | 10,60 | ||||
| 2025-08-21 | 13F | Aveo Capital Partners, LLC | 0 | −100,00 | 0 | |||||
| 2025-05-15 | 13F | Cambridge Associates Llc /ma/ /adv | 0 | −100,00 | 0 | |||||
| 2025-07-15 | 13F | Td Private Client Wealth Llc | 5 392 | 1,72 | 1 514 | 12,57 | ||||
| 2025-08-05 | 13F | Simplex Trading, Llc | 100 | −19,35 | 0 | |||||
| 2025-08-01 | 13F | Strategic Financial Services, Inc, | 1 425 | 23,91 | 400 | 37,46 | ||||
| 2025-08-15 | 13F | Morgan Stanley | 1 128 271 | 26,95 | 316 886 | 40,46 | ||||
| 2025-08-14 | 13F | Royal Bank Of Canada | 27 741 | −1,56 | 7 791 | 8,92 | ||||
| 2025-08-08 | 13F | Francis Financial, Inc. | 16 051 | 4 508 | ||||||
| 2025-08-15 | 13F | Captrust Financial Advisors | 11 323 | 9,04 | 3 180 | 20,64 | ||||
| 2025-05-15 | 13F | Two Sigma Investments, Lp | 0 | −100,00 | 0 | |||||
| 2025-08-07 | 13F | Brio Consultants, LLC | 7 708 | 2 165 | ||||||
| 2025-08-12 | 13F | SRS Capital Advisors, Inc. | 115 | 32 | ||||||
| 2025-08-13 | 13F | Russell Investments Group, Ltd. | 26 | −42,22 | 7 | −36,36 | ||||
| 2025-08-14 | 13F | Principia Wealth Advisory, LLC | 0 | −100,00 | 0 | |||||
| 2025-08-01 | 13F | Pasadena Private Wealth, LLC | 979 | −98,53 | 275 | −98,37 | ||||
| 2025-08-06 | 13F | AE Wealth Management LLC | 5 591 | −8,25 | 1 570 | 1,49 | ||||
| 2025-04-22 | 13F | Synergy Financial Management, LLC | 0 | −100,00 | 0 | |||||
| 2025-08-25 | 13F/A | Neuberger Berman Group LLC | 7 143 | 0,00 | 2 006 | 10,65 | ||||
| 2025-07-18 | 13F | Vigilare Wealth Management | 7 742 | −20,35 | 2 174 | −11,88 | ||||
| 2025-08-12 | 13F | O'shaughnessy Asset Management, Llc | 230 | 7 566,67 | 65 | |||||
| 2025-07-31 | 13F | CVA Family Office, LLC | 1 136 | 0,00 | 319 | 10,76 | ||||
| 2025-08-11 | 13F | Citigroup Inc | 1 642 | 1,80 | 461 | 12,71 | ||||
| 2025-05-15 | 13F | Human Investing LLC | 0 | −100,00 | 0 | |||||
| 2025-08-08 | 13F | Capstone Financial Advisors, Inc. | 23 279 | 14,72 | 6 538 | 26,93 | ||||
| 2025-08-12 | 13F | Real Talk Capital, LLC | 784 | 220 | 5,26 | |||||
| 2025-07-09 | 13F | Sapient Capital Llc | 13 166 | 0,00 | 3 698 | 10,62 | ||||
| 2025-08-13 | 13F | Northwestern Mutual Wealth Management Co | 47 003 | 5,06 | 13 201 | 16,24 | ||||
| 2025-07-17 | 13F | HB Wealth Management, LLC | 1 191 | 0,00 | 335 | 10,60 | ||||
| 2025-07-23 | 13F | Beaumont Asset Management, L.L.C. | 748 | 210 | ||||||
| 2025-07-23 | 13F | Next Level Wealth Planning, LLC | 1 904 | 19,52 | 535 | 32,18 | ||||
| 2025-07-29 | 13F | Salomon & Ludwin, LLC | 100 | 28 | ||||||
| 2025-07-31 | 13F | Oppenheimer & Co Inc | 1 086 | −40,03 | 305 | −33,55 | ||||
| 2025-08-08 | 13F | Glassman Wealth Services | 1 655 | 0,00 | 465 | 10,48 | ||||
| 2025-08-12 | 13F/A | Cozad Asset Management Inc | 36 523 | 1,03 | 10 258 | 11,77 | ||||
| 2025-08-12 | 13F | Steward Partners Investment Advisory, Llc | 2 045 | 0,59 | 574 | 11,24 | ||||
| 2025-08-07 | 13F | Blackston Financial Advisory Group, LLC | 8 154 | −6,09 | 2 290 | 3,86 | ||||
| 2025-04-30 | 13F | Sofos Investments, Inc. | 80 | 0,00 | 20 | 5,26 | ||||
| 2025-07-24 | 13F | 3Chopt Investment Partners, LLC | 0 | −100,00 | 0 | |||||
| 2025-08-11 | 13F | HighTower Advisors, LLC | 117 588 | 5,41 | 33 026 | 16,62 | ||||
| 2025-08-11 | 13F | Retirement Capital Strategies | 0 | −100,00 | 0 | |||||
| 2025-08-14 | 13F | SWAN Capital LLC | 2 | 0,00 | 1 | |||||
| 2025-07-22 | 13F | Global Strategic Investment Solutions, LLC | 1 020 | −0,78 | 286 | 10,00 | ||||
| 2025-08-14 | 13F | Mercer Global Advisors Inc /adv | 69 130 | −19,20 | 19 416 | −10,60 | ||||
| 2025-07-14 | 13F | Farmers & Merchants Investments Inc | 100 | 0,00 | 28 | 12,00 | ||||
| 2025-07-24 | 13F | Callan Family Office, LLC | 1 840 | 517 | ||||||
| 2025-08-14 | 13F | Mairs & Power Inc | 1 031 | 0,00 | 289 | 10,34 | ||||
| 2025-08-13 | 13F | Renaissance Technologies Llc | 6 100 | −20,78 | 1 713 | −12,33 | ||||
| 2025-07-22 | 13F | Verus Wealth Management, Llc | 5 828 | 143,04 | 1 637 | 169,08 | ||||
| 2025-08-04 | 13F | Assetmark, Inc | 693 | −16,81 | 195 | −8,06 | ||||
| 2025-08-14 | 13F | Goldman Sachs Group Inc | 264 550 | 34,28 | 74 302 | 48,56 | ||||
| 2025-08-13 | 13F | Royal Fund Management, LLC | 5 832 | −3,95 | 1 640 | 5,61 | ||||
| 2025-08-13 | 13F | Amundi | 0 | −100,00 | 0 | |||||
| 2025-07-10 | 13F | Wealth Enhancement Advisory Services, Llc | 101 207 | −0,71 | 28 757 | 11,13 | ||||
| 2025-07-11 | 13F | Sherrill & Hutchins Financial Advisory, Inc | 164 904 | 1,56 | 46 315 | 12,36 | ||||
| 2025-07-25 | 13F | Hazlett, Burt & Watson, Inc. | 901 | 0,00 | 0 | |||||
| 2025-07-25 | 13F | Envestnet Portfolio Solutions, Inc. | 11 771 | −15,29 | 3 306 | −6,29 | ||||
| 2025-08-12 | 13F | Coldstream Capital Management Inc | 34 346 | 0,03 | 9 646 | 10,67 | ||||
| 2025-08-14 | 13F | IHT Wealth Management, LLC | 877 | 246 | ||||||
| 2025-08-07 | 13F | Parkside Financial Bank & Trust | 58 129 | 11,57 | 16 326 | 23,43 | ||||
| 2025-08-15 | 13F | Tower Research Capital LLC (TRC) | 4 | 1 | ||||||
| 2025-08-01 | 13F | Envestnet Asset Management Inc | 279 250 | 14,86 | 78 430 | 27,08 | ||||
| 2025-08-08 | 13F | Hartland & Co., LLC | 10 831 | −6,51 | 3 042 | 3,47 | ||||
| 2025-08-11 | 13F | VSM Wealth Advisory, LLC | 10 | 0,00 | 3 | 0,00 | ||||
| 2025-08-12 | 13F | Private Management Group Inc | 844 | 237 | ||||||
| 2025-07-21 | 13F | Matauro, Llc | 736 | 207 | ||||||
| 2025-08-06 | 13F | Prospera Financial Services Inc | 2 103 | −49,40 | 593 | −43,99 | ||||
| 2025-05-15 | 13F | Vident Advisory, LLC | 0 | −100,00 | 0 | −100,00 | ||||
| 2025-08-12 | 13F | Pathstone Holdings, LLC | 66 576 | 0,00 | 18 699 | 10,64 | ||||
| 2025-07-25 | 13F | Sequoia Financial Advisors, LLC | 3 245 | −13,40 | 911 | −4,21 | ||||
| 2025-08-08 | 13F | Creative Planning | 26 101 | −0,23 | 7 331 | 10,37 | ||||
| 2025-08-14 | 13F | RMB Capital Management, LLC | 8 820 | 97,62 | 2 477 | 118,82 | ||||
| 2025-08-05 | 13F | GPS Wealth Strategies Group, LLC | 52 | −5,45 | 15 | 7,69 | ||||
| 2025-08-04 | 13F | Keybank National Association/oh | 65 199 | −4,26 | 18 312 | 5,92 | ||||
| 2025-08-06 | 13F | Commonwealth Equity Services, Llc | 28 914 | 18,48 | 8 | 33,33 | ||||
| 2025-07-29 | 13F | Oxbow Advisors, LLC | 1 306 | 0,00 | 367 | 10,57 | ||||
| 2025-07-17 | 13F | XY Planning Network, Inc. | 1 025 | 288 | ||||||
| 2025-04-02 | 13F | Marcum Wealth, LLC | 1 049 | 0,00 | 266 | −4,66 | ||||
| 2025-07-31 | 13F | Moser Wealth Advisors, LLC | 1 663 | 1,53 | 467 | 12,53 | ||||
| 2025-08-19 | 13F | Advisory Services Network, LLC | 2 302 | −6,76 | 662 | 5,59 | ||||
| 2025-08-04 | 13F | Roble, Belko & Company, Inc | 0 | −100,00 | 0 | |||||
| 2025-07-15 | 13F | Retirement Income Solutions, Inc | 2 870 | −15,01 | 806 | −5,95 | ||||
| 2025-07-22 | 13F | Compass Financial Group, INC/SD | 4 069 | 0,00 | 1 143 | 10,66 | ||||
| 2025-07-25 | 13F | Welch Group, LLC | 4 237 | 0,00 | 1 190 | 11,21 | ||||
| 2025-07-31 | 13F | SoundView Advisors Inc. | 25 031 | 0,02 | 7 | 16,67 | ||||
| 2025-07-25 | 13F | Landmark Wealth Management, LLC | 5 394 | −1,48 | 2 | 0,00 | ||||
| 2025-08-15 | 13F | Cooksen Wealth, LLC | 278 | 78 | ||||||
| 2025-07-21 | 13F | Monticello Wealth Management, Llc | 68 468 | 6 113,07 | 19 230 | 6 792,11 | ||||
| 2025-07-10 | 13F | Redhawk Wealth Advisors, Inc. | 905 | 0,22 | 254 | 10,92 | ||||
| 2025-07-10 | 13F | Brooklyn FI, LLC | 8 377 | 2 353 | 604,19 | |||||
| 2025-04-28 | 13F | Pinnacle Financial Partners Inc | 3 901 | 0,00 | 990 | −4,81 | ||||
| 2025-08-01 | 13F | Fort Vancouver Investment Management, LLC | 234 | −1,68 | 66 | 8,33 | ||||
| 2025-08-14 | 13F | Aqr Capital Management Llc | 35 325 | 159,53 | 9 921 | 187,15 | ||||
| 2025-08-05 | 13F | Tiaa Trust, National Association | 872 | 0,00 | 245 | 10,41 | ||||
| 2025-08-14 | 13F | Warren Averett Asset Management, LLC | 297 817 | 0,01 | 83 645 | 10,65 | ||||
| 2025-07-10 | 13F | Fulton Bank, N.a. | 1 646 | 462 | ||||||
| 2025-07-14 | 13F | Founders Capital Management, Llc | 30 204 | 0,00 | 8 483 | 10,64 | ||||
| 2025-08-14 | 13F | Hirtle Callaghan & Co LLC | 103 008 | 29,75 | 28 931 | 43,54 | ||||
| 2025-05-15 | 13F | Glenmede Trust Co Na | 6 880 | 0,00 | 1 747 | −4,85 | ||||
| 2025-05-14 | 13F | Ieq Capital, Llc | 0 | −100,00 | 0 | |||||
| 2025-08-13 | 13F | Vermillion & White Wealth Management Group, LLC | 1 544 | 434 | ||||||
| 2025-08-05 | 13F | Snider Financial Group | 4 208 | −3,55 | 1 182 | 6,68 | ||||
| 2025-08-06 | 13F | Ethos Financial Group, LLC | 2 781 | −33,08 | 781 | −29,51 | ||||
| 2025-08-14 | 13F | Gotham Asset Management, LLC | 20 049 | 5 631 | ||||||
| 2025-07-08 | 13F | Zrc Wealth Management, Llc | 60 | 0,00 | 17 | 6,67 | ||||
| 2025-08-08 | 13F | SBI Securities Co., Ltd. | 182 | 30,00 | 51 | 45,71 | ||||
| 2025-08-12 | 13F | Proequities, Inc. | 0 | 0 | ||||||
| 2025-08-14 | 13F | Main Street Financial Solutions, LLC | 6 011 | 1 688 | ||||||
| 2025-08-05 | 13F | Bank of New York Mellon Corp | 520 090 | 106,01 | 146 072 | 127,92 | ||||
| 2025-08-05 | 13F | Retirement Financial Solutions, Llc | 2 466 | 0,28 | 693 | 10,90 | ||||
| 2025-07-25 | 13F | Atria Wealth Solutions, Inc. | 19 962 | −72,68 | 5 651 | −69,54 | ||||
| 2025-07-28 | NP | VCGAX - Growth & Income Fund | 53 023 | 2 842,45 | 14 211 | 2 818,07 | ||||
| 2025-07-22 | 13F | DT Investment Partners, LLC | 621 | 0,00 | 174 | 10,83 | ||||
| 2025-08-14 | 13F | Ancora Advisors, LLC | 845 | 0,00 | 237 | 10,75 | ||||
| 2025-07-16 | 13F | ORG Partners LLC | 171 | 10,32 | 48 | 20,51 | ||||
| 2025-08-13 | 13F | Brown Advisory Inc | 800 | 0,00 | 225 | 10,34 | ||||
| 2025-07-30 | 13F | Strategic Blueprint, LLC | 0 | −100,00 | 0 | |||||
| 2025-08-14 | 13F | Bank Of America Corp /de/ | 414 066 | −27,68 | 116 294 | −19,98 | ||||
| 2025-09-04 | 13F/A | Advisor Group Holdings, Inc. | 11 625 | −52,76 | 3 276 | −47,66 | ||||
| 2025-07-17 | 13F | Nova R Wealth, Inc. | 16 722 | −0,43 | 4 697 | 10,16 | ||||
| 2025-04-21 | 13F | PUREfi Wealth, LLC | 0 | −100,00 | 0 | |||||
| 2025-07-17 | 13F | Enclave Advisors LLC | 9 976 | 0,00 | 2 802 | 10,62 | ||||
| 2025-07-22 | 13F | Wealthcare Advisory Partners LLC | 8 105 | 5,88 | 2 276 | 17,14 | ||||
| 2025-07-25 | 13F | Lodestar Private Asset Management Llc | 909 | 12,78 | 255 | 25,00 | ||||
| 2025-08-14 | 13F | Modern Wealth Management, LLC | 97 062 | 0,67 | 27 261 | 11,37 | ||||
| 2025-08-26 | 13F/A | Thrivent Financial For Lutherans | 9 377 | 583,45 | 3 | |||||
| 2025-05-02 | 13F | Signaturefd, Llc | 0 | −100,00 | 0 | |||||
| 2025-07-30 | 13F | Brookstone Capital Management | 820 | −98,00 | 230 | −97,79 | ||||
| 2025-08-08 | 13F | Emerald Investment Partners, Llc | 2 369 | 6,71 | 665 | 18,12 | ||||
| 2025-07-17 | 13F | Michels Family Financial, LLC | 2 605 | −0,15 | 732 | 10,42 | ||||
| 2025-07-22 | 13F | Warwick Investment Management, Inc. | 0 | −100,00 | 0 | |||||
| 2025-07-22 | 13F | Red Tortoise LLC | 1 290 | 0,00 | 362 | 10,70 | ||||
| 2025-07-25 | 13F | Tranquility Partners, LLC | 1 202 | 8,78 | 338 | 20,36 | ||||
| 2025-07-17 | 13F | Halbert Hargrove Global Advisors, Llc | 36 927 | 7,82 | 10 371 | 19,29 | ||||
| 2025-08-08 | 13F | Citizens Financial Group Inc/ri | 2 406 | 0,04 | 676 | 10,66 | ||||
| 2025-08-14 | 13F | Jane Street Group, Llc | 9 574 | 2 689 | ||||||
| 2025-08-11 | 13F | Aptus Capital Advisors, LLC | 1 401 | 5,66 | 394 | 16,96 | ||||
| 2025-08-12 | 13F | Ameritas Investment Partners, Inc. | 2 953 | −1,20 | 829 | 9,37 | ||||
| 2025-07-16 | 13F | West Branch Capital LLC | 179 | 0,00 | 50 | 11,11 | ||||
| 2025-08-14 | 13F | Susquehanna International Group, Llp | 5 146 | −26,60 | 1 445 | −18,77 | ||||
| 2025-07-09 | 13F | Goelzer Investment Management, Inc. | 1 892 | 3,16 | 531 | 14,19 | ||||
| 2025-08-04 | 13F | HBK Sorce Advisory LLC | 1 885 | −0,21 | 529 | 10,44 | ||||
| 2025-07-14 | 13F | Opal Wealth Advisors, LLC | 215 | 60 | ||||||
| 2025-08-06 | 13F | Rialto Wealth Management, LLC | 35 535 | −0,97 | 9 980 | 9,56 | ||||
| 2025-08-12 | 13F | Argent Trust Co | 1 250 | 0,00 | 351 | 10,73 | ||||
| 2025-08-05 | 13F | Mma Asset Management Llc | 900 | 0,00 | 253 | 10,53 | ||||
| 2025-08-08 | 13F | Cetera Investment Advisers | 65 437 | 20,20 | 18 379 | 32,99 | ||||
| 2025-08-11 | 13F | Outlook Wealth Advisors, LLC | 741 | 208 | ||||||
| 2025-08-12 | 13F | MAI Capital Management | 151 668 | 7,79 | 42 597 | 19,26 | ||||
| 2025-08-12 | 13F | Gladstone Institutional Advisory LLC | 735 | 206 | ||||||
| 2025-07-09 | 13F | PFW Advisors LLC | 4 596 | −15,87 | 1 291 | −6,93 | ||||
| 2025-07-22 | 13F | Old National Bancorp /in/ | 88 151 | 6,70 | 24 758 | 18,05 | ||||
| 2025-08-08 | 13F | Compass Wealth Management LLC | 3 125 | 0,00 | 878 | 10,59 | ||||
| 2025-08-08 | 13F | Capital Investment Advisory Services, LLC | 1 027 | 0,00 | 289 | 10,77 | ||||
| 2025-08-13 | 13F | Cerity Partners LLC | 186 028 | −11,03 | 52 248 | −1,57 | ||||
| 2025-08-14 | 13F | Ameriprise Financial Inc | 786 779 | 1,95 | 220 974 | 12,78 | ||||
| 2025-07-28 | 13F | Mitchell Mcleod Pugh & Williams Inc | 6 296 | −1,10 | 1 768 | 9,47 | ||||
| 2025-04-18 | 13F | Cornerstone Wealth Management, LLC | 0 | −100,00 | 0 | −100,00 | ||||
| 2025-08-12 | 13F | J.w. Cole Advisors, Inc. | 1 073 | 2,68 | 301 | 13,58 | ||||
| 2025-08-01 | 13F | Financial Counselors Inc | 0 | −100,00 | 0 | |||||
| 2025-07-09 | 13F | Alesco Advisors Llc | 17 827 | −1,57 | 5 007 | 8,90 | ||||
| 2025-08-18 | 13F | Geneos Wealth Management Inc. | 145 | 0,00 | 41 | 11,11 | ||||
| 2025-08-14 | 13F | Guardian Wealth Advisors, Llc / Nc | 1 325 | 6,00 | 372 | 17,35 | ||||
| 2025-07-09 | 13F | Inspirion Wealth Advisors, Llc | 887 | 0,00 | 249 | 10,67 | ||||
| 2025-07-10 | 13F | Peoples Bank/KS | 0 | −100,00 | 0 | |||||
| 2025-07-22 | 13F | Clarius Group, LLC | 3 741 | 0,00 | 1 051 | 10,64 | ||||
| 2025-08-04 | 13F | Golden Road Advisors Llc | 3 520 | 0,00 | 989 | 10,64 | ||||
| 2025-08-08 | 13F | Sawgrass Asset Management Llc | 49 012 | −0,86 | 13 766 | 9,68 | ||||
| 2025-07-29 | 13F | BXM Wealth LLC | 2 600 | −1,89 | 730 | 8,63 | ||||
| 2025-07-09 | 13F | Heritage Family Offices, LLP | 1 002 | 0,00 | 253 | −0,39 | ||||
| 2025-08-08 | 13F | Avantax Advisory Services, Inc. | 27 426 | −20,00 | 7 703 | −11,49 | ||||
| 2025-08-18 | 13F | Hershey Financial Advisers, LLC | 4 279 | −10,98 | 1 202 | −6,32 | ||||
| 2025-08-04 | 13F | Pensionmark Financial Group, Llc | 865 | −0,12 | 243 | 10,50 | ||||
| 2025-07-08 | 13F | Lpwm Llc | 15 564 | −1,41 | 4 371 | 9,08 | ||||
| 2025-07-21 | 13F/A | Abacus Planning Group, Inc. | 4 535 | 0,00 | 1 274 | 10,60 | ||||
| 2025-07-23 | 13F | Madden Advisory Services, Inc. | 2 599 | −3,13 | 730 | 7,05 | ||||
| 2025-08-08 | 13F | Red Cedar Investment Management, Llc | 561 002 | −4,60 | 157 563 | 5,55 | ||||
| 2025-08-14 | 13F | Colony Group, LLC | 41 589 | 0,74 | 11 681 | 11,45 | ||||
| 2025-05-06 | 13F | Venturi Wealth Management, LLC | 0 | −100,00 | 0 | |||||
| 2025-07-23 | 13F | Litman Gregory Asset Management LLC | 67 658 | 6,63 | 19 002 | 17,97 | ||||
| 2025-08-14 | 13F | Federation des caisses Desjardins du Quebec | 10 | 0,00 | 3 | 0,00 | ||||
| 2025-07-28 | 13F | Mutual Advisors, LLC | 5 362 | 0,04 | 1 553 | 15,82 | ||||
| 2025-07-23 | 13F | Valmark Advisers, Inc. | 957 | 0,00 | 269 | 10,74 | ||||
| 2025-08-14 | 13F | First Manhattan Co | 18 176 | −0,44 | 5 105 | 10,14 | ||||
| 2025-07-14 | 13F | Cherrydale Wealth Management, Llc | 57 909 | −10,77 | 16 264 | −1,28 | ||||
| 2025-08-04 | 13F | AMG National Trust Bank | 4 952 | 3,38 | 1 391 | 14,40 | ||||
| 2025-07-17 | 13F | Nicholson Meyer Capital Management, Inc. | 820 | 0,00 | 230 | 10,58 | ||||
| 2025-08-08 | 13F | Intrua Financial, LLC | 1 028 | 0,00 | 289 | 10,77 | ||||
| 2025-08-14 | 13F | Fmr Llc | 789 235 | 0,86 | 221 665 | 11,58 | ||||
| 2025-07-17 | 13F | Beacon Capital Management, LLC | 222 | 0,45 | 62 | 10,71 | ||||
| 2025-08-14 | 13F | Smartleaf Asset Management LLC | 12 | −92,41 | 3 | −92,31 | ||||
| 2025-08-14 | 13F | Qube Research & Technologies Ltd | 392 | 24,05 | 110 | 37,50 | ||||
| 2025-08-14 | 13F | Becker Capital Management Inc | 3 480 | 1,16 | 977 | 11,91 | ||||
| 2025-08-04 | 13F | Daymark Wealth Partners, Llc | 3 358 | 0,00 | 943 | 10,68 | ||||
| 2025-07-16 | 13F | Vestia Personal Wealth Advisors | 973 | 0,21 | 273 | 10,98 | ||||
| 2025-04-21 | 13F | O'Dell Group, LLC | 0 | −100,00 | 0 | |||||
| 2025-07-21 | 13F | Ameritas Advisory Services, LLC | 486 | 136 | ||||||
| 2025-07-25 | 13F | Endowment Wealth Management, Inc. | 9 710 | 2,65 | 2 727 | 13,58 | ||||
| 2025-07-29 | 13F | Foster & Motley Inc | 8 626 | −18,01 | 2 | 0,00 | ||||
| 2025-08-12 | 13F | AlphaCore Capital LLC | 254 | 122,81 | 71 | 153,57 | ||||
| 2025-07-09 | 13F | Thrive Wealth Management, LLC | 31 743 | 2,07 | 8 915 | 12,93 | ||||
| 2025-04-21 | 13F | Nelson, Van Denburg & Campbell Wealth Management Group, LLC | 0 | −100,00 | 0 | |||||
| 2025-07-29 | 13F | Regions Financial Corp | 15 571 | −0,41 | 4 373 | 10,18 | ||||
| 2025-08-13 | 13F | M&t Bank Corp | 34 268 | 7,04 | 9 625 | 18,42 | ||||
| 2025-08-25 | 13F | Hilltop Partners LLC | 246 576 | 34,91 | 69 253 | 49,26 | ||||
| 2025-08-14 | 13F | Comerica Bank | 27 343 | −2,46 | 7 680 | 7,91 | ||||
| 2025-08-14 | 13F | Headinvest, Llc | 990 | 0,00 | 278 | 10,76 | ||||
| 2025-07-31 | 13F | Opus Capital Group, LLC | 62 725 | 8,64 | 18 | 21,43 | ||||
| 2025-08-12 | 13F | Global Retirement Partners, LLC | 2 342 | −22,17 | 658 | −18,08 | ||||
| 2025-07-14 | 13F | U.S. Capital Wealth Advisors, LLC | 1 574 | 30,08 | 442 | 43,97 | ||||
| 2025-08-14 | 13F | Arete Wealth Advisors, LLC | 18 882 | −4,39 | 5 | 0,00 | ||||
| 2025-07-18 | 13F | Truist Financial Corp | 11 689 | 7,53 | 3 283 | 18,99 | ||||
| 2025-07-30 | 13F | Rehmann Capital Advisory Group | 7 146 | 786,60 | 2 007 | 883,82 | ||||
| 2025-07-28 | 13F | Delap Wealth Advisory, Llc | 1 130 | 0,00 | 317 | 10,84 | ||||
| 2025-08-13 | 13F | M Holdings Securities, Inc. | 17 627 | 1,11 | 5 | 0,00 | ||||
| 2025-07-24 | 13F | Us Bancorp \de\ | 876 | 0,81 | 246 | 11,82 | ||||
| 2025-08-04 | 13F | Atria Investments Llc | 3 997 | 1,22 | 1 123 | 11,98 | ||||
| 2025-07-11 | 13F | AA Financial Advisors, LLC | 1 387 | 0,00 | 390 | 10,51 | ||||
| 2025-07-24 | 13F | Williams & Novak, LLC | 4 586 | 1 288 | ||||||
| 2025-08-12 | 13F | Nemes Rush Group LLC | 1 118 | 0,36 | 314 | 10,99 | ||||
| 2025-08-12 | 13F | BlackRock, Inc. | 1 358 | 0,00 | 381 | 10,76 | ||||
| 2025-07-14 | 13F | AdvisorNet Financial, Inc | 8 813 | 17,60 | 2 475 | 30,13 | ||||
| 2025-08-12 | 13F | Jpmorgan Chase & Co | 44 213 | 4,26 | 12 418 | 15,35 | ||||
| 2025-07-08 | 13F | Apella Capital, LLC | 209 360 | 66,16 | 59 113 | 90,60 | ||||
| 2025-07-28 | 13F | Private Wealth Asset Management, LLC | 348 | 0,00 | 98 | 10,23 | ||||
| 2025-08-11 | 13F | Wbi Investments, Inc. | 794 | 223 | ||||||
| 2025-07-29 | 13F | Chicago Partners Investment Group LLC | 2 269 | 0,22 | 654 | 13,17 | ||||
| 2025-08-12 | 13F | LPL Financial LLC | 104 724 | 0,83 | 29 413 | 11,55 | ||||
| 2025-08-13 | 13F | Baird Financial Group, Inc. | 111 335 | −13,70 | 31 270 | −4,52 | ||||
| 2025-07-23 | 13F | Hardy Reed LLC | 1 342 | −3,45 | 377 | 6,82 | ||||
| 2025-08-12 | 13F | FourThought Financial Partners, LLC | 33 134 | 12,39 | 9 306 | 24,35 | ||||
| 2025-07-25 | 13F | Fifth Third Wealth Advisors LLC | 7 735 | 54,92 | 2 172 | 71,43 | ||||
| 2025-08-13 | 13F | American Investment Services, Inc. | 4 576 | 0,99 | 1 285 | 11,74 | ||||
| 2025-08-05 | 13F | Hapanowicz & Associates Financial Services, Inc | 20 360 | 18,31 | 5 719 | 30,91 | ||||
| 2025-08-05 | 13F | Sigma Planning Corp | 10 010 | 91,80 | 2 812 | 112,31 | ||||
| 2025-08-11 | 13F | Independent Advisor Alliance | 1 119 | 0,00 | 314 | 10,56 | ||||
| 2025-08-13 | 13F | Keystone Financial Group | 8 965 | 12,55 | 2 518 | 24,48 | ||||
| 2025-06-24 | 13F | Rainier Family Wealth Inc | 0 | −100,00 | 0 | −100,00 | ||||
| 2025-08-14 | 13F | Matrix Private Capital Group Llc | 17 | 5 | ||||||
| 2025-08-01 | 13F | Anson Capital, Inc. | 4 489 | −1,69 | 1 261 | 8,71 | ||||
| 2025-08-06 | 13F | SOUTH STATE Corp | 61 304 | −18,59 | 17 218 | −9,93 | ||||
| 2025-05-12 | 13F | JFG Wealth Management, LLC | 0 | −100,00 | 0 | |||||
| 2025-08-15 | 13F | CI Private Wealth, LLC | 13 596 | 112,50 | 3 818 | 135,10 | ||||
| 2025-07-23 | 13F | Friedenthal Financial | 2 | 100,00 | 1 | |||||
| 2025-07-31 | 13F | Cambridge Investment Research Advisors, Inc. | 52 246 | 6,13 | 15 | 16,67 | ||||
| 2025-07-21 | 13F | Pflug Koory, LLC | 25 | 7 | ||||||
| 2025-08-07 | 13F | Commerce Bank | 15 601 | −6,72 | 4 382 | 3,20 | ||||
| 2025-08-07 | 13F | Topel & Distasi Wealth Management, LLC | 9 367 | 0,00 | 2 631 | 10,64 | ||||
| 2025-08-12 | 13F | Franklin Resources Inc | 350 | 98 | ||||||
| 2025-08-13 | 13F | Twin Peaks Wealth Advisors, LLC | 2 708 | −1,81 | 791 | 17,56 | ||||
| 2025-08-05 | 13F | Strategic Financial Concepts, LLC | 0 | −100,00 | 0 | |||||
| 2025-08-14 | 13F | Stifel Financial Corp | 416 572 | 5,59 | 116 998 | 16,82 | ||||
| 2025-08-11 | 13F | Private Advisor Group, LLC | 3 726 | 71,78 | 1 047 | 90,18 | ||||
| 2025-07-24 | 13F | Cyndeo Wealth Partners, LLC | 1 087 | 0,00 | 305 | 10,91 | ||||
| 2025-08-14 | 13F | Bragg Financial Advisors, Inc | 5 238 | 412,02 | 1 471 | 467,95 | ||||
| 2025-07-23 | 13F | Narwhal Capital Management | 1 568 | 0,00 | 440 | 10,55 | ||||
| 2025-07-24 | 13F | Jfs Wealth Advisors, Llc | 8 595 | 0,00 | 2 414 | 10,64 | ||||
| 2025-07-24 | 13F | Blair William & Co/il | 752 | 7,43 | 211 | 19,21 | ||||
| 2025-08-13 | 13F | Rsm Us Wealth Management Llc | 59 646 | 18,65 | 16 752 | 31,27 | ||||
| 2025-08-14 | 13F | Camden Capital, LLC | 3 076 | 0,59 | 864 | 11,79 | ||||
| 2025-05-01 | 13F | Fort Sheridan Advisors Llc | 0 | −100,00 | 0 | |||||
| 2025-07-30 | 13F | Retirement Planning Group | 1 910 | 0,00 | 536 | 10,74 | ||||
| 2025-07-11 | 13F | CMH Wealth Management LLC | 14 940 | −3,11 | 4 196 | 7,20 | ||||
| 2025-08-14 | 13F | Note Advisors, LLC | 23 771 | −1,98 | 6 676 | 8,45 | ||||
| 2025-05-07 | 13F | Mitchell Sinkler & Starr/pa | 0 | −100,00 | 0 | |||||
| 2025-08-14 | 13F | UBS Group AG | 785 817 | 16,65 | 220 705 | 29,06 | ||||
| 2025-07-25 | 13F | Cwm, Llc | 0 | −100,00 | 0 | |||||
| 2025-08-11 | 13F | Teachers Insurance & Annuity Association Of America | 1 295 | −0,99 | 364 | 9,34 | ||||
| 2025-08-14 | 13F | Kovitz Investment Group Partners, LLC | 6 565 | −4,92 | 1 844 | 5,19 |
Other Listings
| GB:0LNF |