Grundläggande statistik
| Institutionella ägare | 223 total, 220 long only, 1 short only, 2 long/short - change of 0,00% MRQ |
| Genomsnittlig portföljallokering | 0.2213 % - change of −14,76% MRQ |
| Institutionella aktier (lång) | 36 527 265 (ex 13D/G) - change of 2,83MM shares 8,40% MRQ |
| Institutionellt värde (lång) | $ 434 074 USD ($1000) |
Institutionellt ägande och aktieägare
Oaktree Specialty Lending Corporation (US:OCSL) har 223 Institutionella ägare och aktieägare som har lämnat in 13D/G- eller 13F-formulär till Securities Exchange Commission (SEC). Dessa institut innehar totalt 36,527,265 aktier. Största aktieägare inkluderar Morgan Stanley, Private Management Group Inc, Bruni J V & Co /co, Van Eck Associates Corp, Ares Management Llc, Generali Asset Management SPA SGR, Oaktree Capital Management Lp, BIZD - VanEck Vectors BDC Income ETF, CLARET ASSET MANAGEMENT Corp, and Melia Wealth LLC .
Oaktree Specialty Lending Corporation (NasdaqGS:OCSL) Institutionell ägarstruktur visar institutioners och fonders nuvarande positioner i företaget, samt de senaste förändringarna i positionernas storlek. Större aktieägare kan vara enskilda investerare, fonder, hedgefonder eller institutioner. Bilaga 13D visar att investeraren äger (eller ägde) mer än 5% av företaget och avser (eller avsåg) att aktivt eftersträva en förändring av affärsstrategin. Schedule 13G indikerar en passiv investering på över 5%.
The share price as of September 12, 2025 is 13,79 / share. Previously, on September 13, 2024, the share price was 16,54 / share. This represents a decline of 16,63% over that period.

Fondsentimentets poäng
Fondsentimentet poängen(fka Ägarackumulation-poäng) visar vilka aktier som är mest köpta av fonder. Det är resultatet av en sofistikerad kvantitativ flerfaktormodell som identifierar företag med de högsta nivåerna av institutionell ackumulering. Poängsättningsmodellen använder en kombination av den totala ökningen av redovisade ägare, förändringarna i portföljallokeringarna för dessa ägare och andra mått. Siffran sträcker sig från 0 till 100, där högre siffror indikerar en högre nivå av ackumulering i förhållande till sina konkurrenter, och 50 är genomsnittet.
Uppdateringsfrekvens: Dagligen
Se Ownership Explorer, som innehåller en lista över de högst rankade företagen.
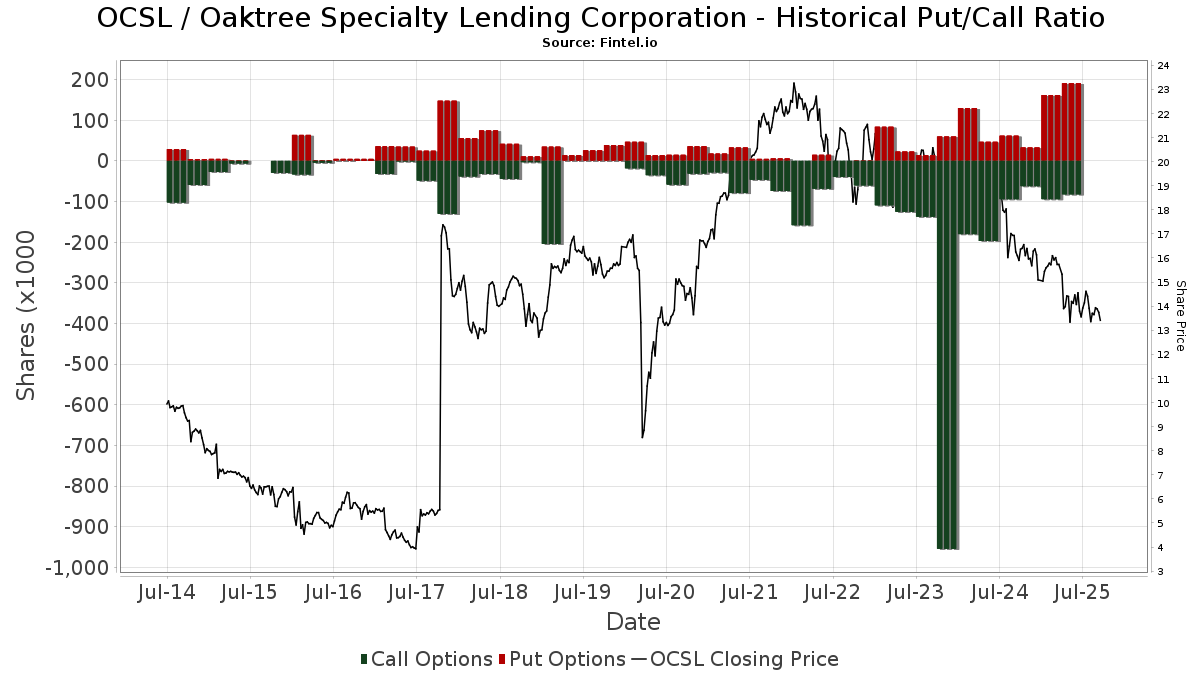
Institutionell sälj/köp-kvot
Förutom att rapportera vanliga eget kapital- och skuldemissioner måste institutioner med mer än 100MM tillgångar under förvaltning också avslöja sina innehav av sälj- och köpoptioner. Eftersom säljoptioner i allmänhet indikerar ett negativt sentiment och köpoptioner indikerar ett positivt sentiment, kan vi få en uppfattning om det övergripande institutionella sentimentet genom att plotta förhållandet mellan säljoptioner och köpoptioner. Diagrammet till höger visar det historiska förhållandet mellan sälj- och köpoptioner för detta instrument.
Genom att använda sälj/köp-kvoten som en indikator på aktieägarnas sentiment undviker man en av de största bristerna med att använda det totala institutionella ägandet, nämligen att en betydande del av de förvaltade tillgångarna investeras passivt för att följa index. Passivt förvaltade fonder köper vanligtvis inte optioner, så indikatorn för sälj/köp-kvoten ger en bättre bild av stämningen i aktivt förvaltade fonder.
13D/G-Arkiveringar
Vi presenterar 13D/G-arkiveringar separat från 13F-arkiveringar på grund av att de behandlas olika av SEC. 13D/G-arkiveringar kan lämnas in av grupper av investerare (med en ledare), medan 13F-arkiveringar inte kan det. Detta leder till situationer där en investerare kan lämna in en 13D/G-ansökan med ett värde för de totala aktierna (vilket motsvarar alla aktier som ägs av investerargruppen), men sedan lämna in en 13F-ansökan med ett annat värde för de totala aktierna (vilket motsvarar enbart deras eget ägande). Detta innebär att aktieägandet i 13D/G-arkiveringar och 13F-arkiveringar ofta inte är direkt jämförbara, så vi presenterar dem separat.
Notera: Från och med den 16 maj 2021 visar vi inte längre ägare som inte har lämnat in en 13D/G under det senaste året. Tidigare visade vi hela historiken för 13D/G-arkiveringar. I allmänhet måste enheter som är skyldiga att lämna in 13D/G-arkiveringar lämna in minst en gång per år innan de lämnar in en stängningsarkivering. Fonder avslutar dock ibland positioner utan att lämna in en avslutande arkivering (dvs. de avvecklar), så att visa hela historiken resulterade ibland i förvirring om det nuvarande ägandet. För att förhindra förvirring visar vi nu endast "nuvarande" ägare - det vill säga ägare som har lämnat in en ansökan under det senaste året.
Upgrade to unlock premium data.
| Fil Datum | Formulär | Investerare | Föregående aktier |
Senaste aktier |
Δ Aktier (Procent) |
Ägande (Procent) |
Δ Ägande (Procent) |
|
|---|---|---|---|---|---|---|---|---|
| 2025-02-10 | Oaktree Capital I, L.P. | 7,524,605 | 8.56 |
13F- och NPORT-arkiveringar
Detaljer om 13F-arkiveringar är gratis. Detaljer om NP-arkiveringar kräver ett premiummedlemskap. Gröna rader indikerar nya positioner. Röda rader indikerar stängda positioner. Klicka på länk symbolen för att se hela transaktionshistoriken.
Uppgradera
för att låsa upp premiumdata och exportera till Excel ![]() .
.
| Fil Datum | Källa | Investerare | Typ | Genomsnittligt pris (beräknat) |
Aktier | Δ Aktier (%) |
Rapporterat värde (1000 USD) |
Δ Värde (%) |
Portföljallokering (%) |
|
|---|---|---|---|---|---|---|---|---|---|---|
| 2025-08-04 | 13F | Muzinich & Co., Inc. | 260 854 | 13,34 | 3 563 | 0,79 | ||||
| 2025-08-14 | 13F | Balyasny Asset Management Llc | 626 324 | 298,94 | 8 556 | 254,83 | ||||
| 2025-05-07 | 13F | Horan Capital Advisors, LLC. | 11 757 | 0,00 | 181 | 0,56 | ||||
| 2025-03-31 | NP | LSVQX - LSV Small Cap Value Fund Institutional Class Shares | 44 631 | 0,00 | 714 | −1,24 | ||||
| 2025-07-01 | 13F | Confluence Investment Management Llc | 137 042 | 0,47 | 1 872 | −10,69 | ||||
| 2025-08-04 | 13F | REDW Wealth LLC | 20 000 | 53,85 | 273 | 37,19 | ||||
| 2025-08-14 | 13F | Jane Street Group, Llc | 11 267 | −70,16 | 154 | −73,58 | ||||
| 2025-08-14 | 13F | Ameriprise Financial Inc | 0 | −100,00 | 0 | |||||
| 2025-08-13 | 13F | Lido Advisors, LLC | 106 141 | −8,69 | 1 450 | −18,82 | ||||
| 2025-07-16 | 13F | Signaturefd, Llc | 210 | −68,80 | 3 | −80,00 | ||||
| 2025-08-29 | NP | John Hancock Financial Opportunities Fund | 259 793 | 0,00 | 3 549 | −11,08 | ||||
| 2025-07-11 | 13F | Caldwell Securities, Inc | 5 750 | 0,00 | 79 | −11,36 | ||||
| 2025-07-31 | 13F | Jackson Hole Capital Partners, LLC | 18 651 | 0,00 | 255 | −11,19 | ||||
| 2025-08-12 | 13F | Advisors Asset Management, Inc. | 104 228 | −41,99 | 1 424 | −48,42 | ||||
| 2025-08-11 | 13F | Lsv Asset Management | 300 403 | −44,82 | 4 | −50,00 | ||||
| 2025-07-14 | 13F | S.A. Mason LLC | 650 | 9 | ||||||
| 2025-08-14 | 13F | Optiver Holding B.V. | 1 462 | 0,00 | 20 | −13,64 | ||||
| 2025-07-10 | 13F | Security National Bank | 3 201 | 10,53 | 44 | −2,27 | ||||
| 2025-08-13 | 13F | Invesco Ltd. | 705 824 | −3,31 | 9 642 | −14,01 | ||||
| 2025-07-25 | 13F | Cwm, Llc | 728 | 0,00 | 0 | |||||
| 2025-07-30 | 13F | Atlantic Edge Private Wealth Management, LLC | 200 | 0,00 | 3 | −33,33 | ||||
| 2025-08-14 | 13F | Aqr Capital Management Llc | 35 601 | −2,25 | 486 | −13,06 | ||||
| 2025-08-19 | 13F | Marex Group plc | 25 211 | 344 | ||||||
| 2025-08-14 | 13F | GWM Advisors LLC | 12 972 | 688,09 | 177 | 608,00 | ||||
| 2025-08-11 | 13F | Strategic Wealth Partners, Ltd. | 37 489 | −21,93 | 512 | −31,91 | ||||
| 2025-08-14 | 13F | Verition Fund Management LLC | 35 514 | 485 | ||||||
| 2025-07-16 | 13F | Rezny Wealth Management, Inc. | 187 957 | −33,66 | 2 567 | −41,00 | ||||
| 2025-08-13 | 13F | Quantbot Technologies LP | 55 820 | 763 | ||||||
| 2025-07-16 | 13F | Register Financial Advisors LLC | 11 043 | 0,00 | 151 | −11,24 | ||||
| 2025-08-06 | 13F | Round Rock Advisors, LLC | 107 369 | −0,13 | 1 467 | −11,21 | ||||
| 2025-08-05 | 13F | Mountain Hill Investment Partners Corp. | 32 | 3,23 | 0 | |||||
| 2025-05-14 | 13F | Campbell & CO Investment Adviser LLC | 0 | −100,00 | 0 | |||||
| 2025-08-04 | 13F | Spire Wealth Management | 4 310 | −5,48 | 59 | −17,14 | ||||
| 2025-05-12 | 13F | Simplex Trading, Llc | 0 | −100,00 | 0 | |||||
| 2025-07-31 | 13F | Oppenheimer & Co Inc | 0 | −100,00 | 0 | |||||
| 2025-08-14 | 13F/A | Rockefeller Capital Management L.P. | 368 923 | 10,31 | 5 039 | −1,91 | ||||
| 2025-07-31 | 13F | Whipplewood Advisors, LLC | 73 216 | 138 043,40 | 1 000 | 110,97 | ||||
| 2025-08-12 | 13F | Private Management Group Inc | 2 406 670 | 10,14 | 32 875 | −2,04 | ||||
| 2025-08-14 | 13F | Mml Investors Services, Llc | 30 939 | 10,65 | 0 | |||||
| 2025-07-17 | 13F | Janney Montgomery Scott LLC | 37 708 | −12,70 | 1 | |||||
| 2025-08-12 | 13F | Close Asset Management Ltd | 6 200 | 34,78 | 0 | |||||
| 2025-08-15 | 13F | CI Private Wealth, LLC | 42 918 | 286,02 | 586 | 244,71 | ||||
| 2025-08-05 | 13F | Simplex Trading, Llc | Call | 2 400 | −52,94 | 0 | ||||
| 2025-05-07 | 13F | Spectrum Wealth Counsel, LLC | 75 | 0,00 | 1 | 0,00 | ||||
| 2025-08-12 | 13F | LPL Financial LLC | 149 729 | −6,03 | 2 045 | −16,43 | ||||
| 2025-07-18 | 13F | Generali Investments CEE, investicni spolecnost, a.s. | 23 020 | 10,07 | 314 | −2,18 | ||||
| 2025-07-25 | 13F | Community Bank, N.A. | 730 | 0,00 | 10 | −18,18 | ||||
| 2025-08-13 | 13F | Brown Advisory Inc | 54 021 | 0,00 | 738 | −11,10 | ||||
| 2025-04-29 | NP | SWSAX - SIIT World Select Equity Fund Class A | 2 700 | 0,00 | 44 | −2,27 | ||||
| 2025-07-15 | 13F | Avaii Wealth Management, Llc | 28 212 | 75,52 | 385 | 56,50 | ||||
| 2025-04-07 | 13F | AdvisorNet Financial, Inc | 0 | −100,00 | 0 | |||||
| 2025-07-28 | 13F | Melia Wealth LLC | 990 458 | 12,61 | 13 530 | 0,15 | ||||
| 2025-07-24 | 13F | Ronald Blue Trust, Inc. | 68 622 | 0,00 | 937 | −11,10 | ||||
| 2025-04-15 | 13F | Integrated Advisors Network LLC | 0 | −100,00 | 0 | −100,00 | ||||
| 2025-07-31 | 13F | Sumitomo Mitsui Trust Holdings, Inc. | 240 769 | 7,15 | 3 289 | −4,72 | ||||
| 2025-08-11 | 13F | EMC Capital Management | 0 | −100,00 | 0 | |||||
| 2025-08-14 | 13F/A | Skopos Labs, Inc. | 1 301 | 18 | ||||||
| 2025-07-31 | 13F | Cambridge Investment Research Advisors, Inc. | 24 819 | −15,64 | 0 | |||||
| 2025-08-14 | 13F | Two Sigma Investments, Lp | 120 839 | −31,70 | 1 651 | −39,27 | ||||
| 2025-08-14 | 13F | Quarry LP | 1 198 | 16 | ||||||
| 2025-08-11 | 13F | Universal- Beteiligungs- und Servicegesellschaft mbH | 0 | −100,00 | 0 | |||||
| 2025-07-15 | 13F | Kentucky Trust Co | 1 000 | 0,00 | 14 | −13,33 | ||||
| 2025-08-06 | 13F | Carnegie Lake Advisors LLC | 133 542 | 0,00 | 2 | −50,00 | ||||
| 2025-08-11 | 13F | TD Waterhouse Canada Inc. | 1 | 0,00 | 0 | |||||
| 2025-08-01 | 13F | Envestnet Asset Management Inc | 14 262 | −83,12 | 195 | −85,04 | ||||
| 2025-08-15 | 13F | Northeast Financial Consultants Inc | 32 166 | 0,00 | 439 | −11,13 | ||||
| 2025-08-13 | 13F | Wills Financial Group LLC | 232 808 | 0,42 | 3 180 | −10,67 | ||||
| 2025-07-23 | 13F | Stonegate Investment Group, LLC | 14 371 | 2,55 | 196 | −8,84 | ||||
| 2025-08-14 | 13F | Oxford Asset Management Llp | 41 267 | 253,43 | 564 | 216,29 | ||||
| 2025-05-14 | 13F | CF Capital LLC | 0 | −100,00 | 0 | |||||
| 2025-07-16 | 13F | Arlington Capital Management, Inc. | 68 855 | 941 | ||||||
| 2025-08-13 | 13F | Texas Capital Bank Wealth Management Services Inc | 166 625 | 2,83 | 2 276 | −8,52 | ||||
| 2025-07-29 | 13F | Arnhold LLC | 152 345 | −6,16 | 2 081 | −16,53 | ||||
| 2025-08-13 | 13F | EverSource Wealth Advisors, LLC | 2 | 0 | ||||||
| 2025-08-13 | 13F | Crescent Grove Advisors, LLC | 23 765 | 0,00 | 325 | −11,23 | ||||
| 2025-05-19 | NP | MSCQX - Mercer US Small/Mid Cap Equity Fund Class I | 57 200 | 0,00 | 879 | 0,46 | ||||
| 2025-08-13 | 13F | Barclays Plc | 0 | −100,00 | 0 | |||||
| 2025-08-29 | NP | Gabelli Dividend & Income Trust | 186 379 | 3,02 | 2 546 | −8,39 | ||||
| 2025-08-08 | 13F | Hartland & Co., LLC | 28 747 | 4,05 | 393 | −7,55 | ||||
| 2025-08-14 | 13F | Two Sigma Securities, Llc | 0 | −100,00 | 0 | |||||
| 2025-07-29 | NP | SLPAX - Siit Small Cap Fund - Class A | 13 100 | 0,00 | 192 | −9,48 | ||||
| 2025-08-01 | 13F | Pasadena Private Wealth, LLC | 28 901 | 395 | ||||||
| 2025-08-14 | 13F | Van Eck Associates Corp | 2 038 700 | 4,95 | 28 | −6,90 | ||||
| 2025-08-15 | 13F | Captrust Financial Advisors | 10 884 | 149 | ||||||
| 2025-08-07 | 13F | Samalin Investment Counsel, LLC | 87 512 | 2,62 | 1 195 | −8,71 | ||||
| 2025-08-15 | 13F | Kensington Investment Counsel, LLC | 11 547 | 0,00 | 158 | −11,30 | ||||
| 2025-08-06 | 13F | HORAN Wealth, LLC | 11 757 | 161 | ||||||
| 2025-07-28 | NP | KBWD - Invesco KBW High Dividend Yield Financial ETF This fund is a listed as child fund of Invesco Ltd. and if that institution has disclosed ownership in this security, then these positions will not be double counted when calculating total shares and total value | 664 948 | −19,17 | 9 728 | −26,64 | ||||
| 2025-08-12 | 13F | Proequities, Inc. | 0 | 0 | ||||||
| 2025-08-12 | 13F | Proequities, Inc. | Put | 0 | 0 | |||||
| 2025-08-12 | 13F | Proequities, Inc. | Call | 0 | 0 | |||||
| 2025-08-13 | 13F | Oaktree Capital Management Lp | 1 852 456 | 0,00 | 25 305 | −11,07 | ||||
| 2025-08-04 | 13F | Pinnacle Associates Ltd | 99 587 | −33,78 | 1 360 | −41,10 | ||||
| 2025-08-08 | 13F | MTM Investment Management, LLC | 2 500 | 34 | ||||||
| 2025-05-06 | 13F | Bank Julius Baer & Co. Ltd, Zurich | 0 | −100,00 | 0 | |||||
| 2025-07-29 | 13F | Chicago Partners Investment Group LLC | 18 317 | −8,16 | 264 | −1,13 | ||||
| 2025-08-05 | 13F | Bank Of Montreal /can/ | 12 112 | 3,74 | 165 | −7,82 | ||||
| 2025-08-14 | 13F | Royal Bank Of Canada | 613 023 | 30,74 | 8 374 | 16,29 | ||||
| 2025-08-06 | 13F | Commonwealth Equity Services, Llc | 94 898 | −14,48 | 1 | 0,00 | ||||
| 2025-08-14 | 13F | State Street Corp | 78 745 | 257,77 | 1 076 | 218,05 | ||||
| 2025-04-01 | NP | LSVFX - LSV GLOBAL MANAGED VOLATILITY FUND Institutional Class Shares | 1 600 | 0,00 | 26 | 0,00 | ||||
| 2025-08-13 | 13F | Wealthedge Investment Advisors, Llc | 96 807 | −25,36 | 1 322 | −33,63 | ||||
| 2025-08-25 | 13F/A | Neuberger Berman Group LLC | 17 781 | −80,92 | 243 | −83,09 | ||||
| 2025-08-05 | 13F | Castlekeep Investment Advisors Llc | 321 059 | 0,56 | 4 386 | −10,58 | ||||
| 2025-07-16 | 13F | Old Port Advisors | 67 004 | 915 | ||||||
| 2025-08-14 | 13F | Financial Advisory Service, Inc. | 20 195 | 0,00 | 276 | −11,29 | ||||
| 2025-07-31 | 13F | AlTi Global, Inc. | 51 641 | −0,39 | 742 | −6,78 | ||||
| 2025-08-13 | 13F | Cresset Asset Management, LLC | 43 773 | 0,51 | 598 | −10,63 | ||||
| 2025-08-14 | 13F | BI Asset Management Fondsmaeglerselskab A/S | 279 248 | 20,61 | 4 | 0,00 | ||||
| 2025-08-14 | 13F | First Foundation Advisors | 10 559 | 0,00 | 144 | −11,11 | ||||
| 2025-08-14 | 13F | Wells Fargo & Company/mn | 245 638 | −32,84 | 3 355 | −40,27 | ||||
| 2025-08-13 | 13F | Virtus Investment Advisers, Inc. | 82 913 | −9,34 | 1 133 | −19,37 | ||||
| 2025-09-04 | 13F/A | Advisor Group Holdings, Inc. | 232 525 | −58,90 | 3 177 | −63,47 | ||||
| 2025-05-13 | 13F | Cercano Management LLC | 0 | −100,00 | 0 | −100,00 | ||||
| 2025-05-05 | 13F | IFP Advisors, Inc | 0 | −100,00 | 0 | |||||
| 2025-08-11 | 13F | United Advisor Group, LLC | 229 304 | 3,22 | 3 132 | −8,21 | ||||
| 2025-07-28 | 13F | Generali Asset Management SPA SGR | 1 888 566 | 74,20 | 25 798 | 54,92 | ||||
| 2025-07-28 | 13F | Harbour Investments, Inc. | 3 839 | 0,55 | 52 | −10,34 | ||||
| 2025-08-15 | 13F | Tower Research Capital LLC (TRC) | 4 163 | 1 025,14 | 57 | 1 020,00 | ||||
| 2025-08-12 | 13F | Entropy Technologies, LP | 0 | −100,00 | 0 | |||||
| 2025-08-14 | 13F | Boston Private Wealth Llc | 0 | −100,00 | 0 | −100,00 | ||||
| 2025-08-14 | 13F | Group One Trading, L.p. | Call | 15 000 | −33,92 | 205 | −41,38 | |||
| 2025-08-14 | 13F | Group One Trading, L.p. | 61 437 | 839 | ||||||
| 2025-08-14 | 13F | Millennium Management Llc | 0 | −100,00 | 0 | |||||
| 2025-07-28 | NP | PEX - ProShares Global Listed Private Equity ETF | 15 522 | −6,23 | 227 | −14,66 | ||||
| 2025-06-25 | NP | VPC - Virtus Private Credit Strategy ETF | 83 541 | −0,22 | 1 203 | −10,23 | ||||
| 2025-04-10 | 13F | Thurston, Springer, Miller, Herd & Titak, Inc. | 0 | −100,00 | 0 | |||||
| 2025-07-28 | 13F | Naviter Wealth, LLC | 175 837 | 12,68 | 2 402 | −3,61 | ||||
| 2025-08-14 | 13F | Kovitz Investment Group Partners, LLC | 167 719 | −1,68 | 2 291 | −12,56 | ||||
| 2025-07-21 | 13F | Ameritas Advisory Services, LLC | 608 | 8 | ||||||
| 2025-08-14 | 13F | Lazard Asset Management Llc | 92 736 | 0,00 | 1 | 0,00 | ||||
| 2025-08-13 | 13F | Marshall Wace, Llp | 18 011 | 246 | ||||||
| 2025-08-07 | 13F | ProShare Advisors LLC | 14 518 | −12,66 | 198 | −22,35 | ||||
| 2025-07-09 | 13F | Westbourne Investments, Inc. | 10 000 | 0,00 | 137 | −11,11 | ||||
| 2025-08-14 | 13F | Mariner, LLC | 110 846 | 12,60 | 1 514 | 0,13 | ||||
| 2025-05-05 | 13F | Transce3nd, LLC | 0 | −100,00 | 0 | |||||
| 2025-08-12 | 13F | Running Point Capital Advisors, LLC | 25 080 | 24,90 | 343 | 11,04 | ||||
| 2025-08-08 | 13F | KBC Group NV | 17 930 | 0,00 | 0 | |||||
| 2025-08-19 | 13F | Anchor Investment Management, LLC | 3 200 | 0,00 | 44 | −12,24 | ||||
| 2025-05-01 | 13F | LRI Investments, LLC | 0 | −100,00 | 0 | |||||
| 2025-05-05 | 13F | Lindbrook Capital, Llc | 29 815 | 75,38 | 458 | 76,45 | ||||
| 2025-08-14 | 13F | UBS Group AG | 842 182 | 29,25 | 11 504 | 14,95 | ||||
| 2025-08-18 | 13F/A | National Bank Of Canada /fi/ | 2 165 | 28,03 | 30 | 16,00 | ||||
| 2025-08-19 | 13F | Newbridge Financial Services Group, Inc. | 500 | −64,05 | 7 | −71,43 | ||||
| 2025-05-06 | 13F | Y-Intercept (Hong Kong) Ltd | 0 | −100,00 | 0 | |||||
| 2025-07-25 | NP | First Trust Specialty Finance & Financial Opportunities Fund This fund is a listed as child fund of First Trust Advisors Lp and if that institution has disclosed ownership in this security, then these positions will not be double counted when calculating total shares and total value | 90 000 | 0,00 | 1 317 | −9,24 | ||||
| 2025-07-18 | 13F | Founders Capital Management | 1 000 | 0,00 | 14 | −13,33 | ||||
| 2025-07-30 | 13F | Denali Advisors Llc | 144 458 | −2,24 | 1 973 | −13,05 | ||||
| 2025-08-14 | 13F | Bank Of America Corp /de/ | 124 289 | −21,70 | 1 698 | −30,39 | ||||
| 2025-08-14 | 13F | Bramshill Investments, LLC | 44 597 | −0,26 | 609 | −11,22 | ||||
| 2025-08-13 | 13F | CLARET ASSET MANAGEMENT Corp | 1 700 738 | 23 | 0,00 | |||||
| 2025-08-14 | 13F | Raymond James Financial Inc | 68 055 | 0,59 | 930 | −10,59 | ||||
| 2025-08-14 | 13F | Financial Strategies Group, Inc. | 55 428 | 19,58 | 799 | 21,65 | ||||
| 2025-08-12 | 13F | CIBC Private Wealth Group, LLC | 2 050 | 0,00 | 28 | 7,69 | ||||
| 2025-08-18 | 13F | Wolverine Trading, Llc | Call | 0 | −100,00 | 0 | ||||
| 2025-08-14 | 13F | Sciencast Management LP | 0 | −100,00 | 0 | |||||
| 2025-08-14 | 13F | Susquehanna International Group, Llp | Put | 52 000 | 14,79 | 710 | 2,16 | |||
| 2025-08-14 | 13F | Susquehanna International Group, Llp | 26 016 | −65,70 | 355 | −69,50 | ||||
| 2025-05-14 | 13F | Virtus ETF Advisers LLC | 0 | −100,00 | 0 | |||||
| 2025-08-14 | 13F | Susquehanna International Group, Llp | Call | 28 600 | 72,29 | 391 | 53,54 | |||
| 2025-08-12 | 13F | MAI Capital Management | 28 957 | −0,69 | 396 | −11,63 | ||||
| 2025-07-15 | 13F | Bfsg, Llc | 13 475 | 5,44 | 184 | −6,12 | ||||
| 2025-08-12 | 13F | Global Retirement Partners, LLC | 875 | 12 | ||||||
| 2025-08-14 | 13F | Principal Street Partners, LLC | 28 810 | −1,37 | 394 | −12,28 | ||||
| 2025-08-12 | 13F | Archer Investment Corp | 59 | 3,51 | 1 | |||||
| 2025-08-13 | 13F | Northern Trust Corp | 80 590 | 274,42 | 1 101 | 233,33 | ||||
| 2025-05-02 | 13F | Wealthfront Advisers Llc | 0 | −100,00 | 0 | −100,00 | ||||
| 2025-08-15 | 13F | Morgan Stanley | 3 449 055 | 1,73 | 47 114 | −9,52 | ||||
| 2025-08-13 | 13F | Natixis | 22 | 0 | ||||||
| 2025-04-28 | 13F | Strategic Financial Concepts, LLC | 0 | −100,00 | 0 | −100,00 | ||||
| 2025-07-18 | 13F | Truist Financial Corp | 10 182 | −5,46 | 139 | −15,76 | ||||
| 2025-08-12 | 13F | Cornerstone Wealth Management, LLC | 14 167 | 0,06 | 194 | −11,06 | ||||
| 2025-08-14 | 13F | Fmr Llc | 0 | −100,00 | 0 | |||||
| 2025-05-15 | 13F | Glenview Trust Co | 16 148 | 0,00 | 247 | 0,00 | ||||
| 2025-08-08 | 13F | Wall Street Access Asset Management, LLC | 12 320 | 1,55 | 168 | −9,68 | ||||
| 2025-07-08 | 13F/A | Salem Investment Counselors Inc | 283 | 0,00 | 4 | −25,00 | ||||
| 2025-08-07 | 13F | Vista Investment Partners Ii, Llc | 0 | −100,00 | 0 | |||||
| 2025-07-30 | 13F | Cornerstone Advisory, LLC | 87 289 | −0,37 | 1 192 | 1,36 | ||||
| 2025-05-06 | 13F | Carnegie Capital Asset Management, LLC | 0 | −100,00 | 0 | |||||
| 2025-08-14 | 13F | Two Sigma Advisers, Lp | 262 541 | −19,23 | 3 586 | −28,17 | ||||
| 2025-07-17 | 13F | Sonora Investment Management Group, LLC | 18 100 | 15,29 | 247 | 2,49 | ||||
| 2025-05-15 | 13F | Aquatic Capital Management LLC | 0 | −100,00 | 0 | |||||
| 2025-07-14 | 13F | Abound Wealth Management | 2 577 | 35 | ||||||
| 2025-08-14 | 13F | Goldman Sachs Group Inc | 0 | −100,00 | 0 | |||||
| 2025-08-08 | 13F | Cetera Investment Advisers | 26 769 | −1,50 | 366 | −12,47 | ||||
| 2025-07-18 | 13F | PFG Investments, LLC | 31 767 | 2,01 | 434 | −9,41 | ||||
| 2025-07-30 | 13F | Jackson Thornton Asset Management, Llc | 35 601 | −2,25 | 502 | −3,83 | ||||
| 2025-07-24 | 13F | Us Bancorp \de\ | 518 | −84,09 | 7 | −86,00 | ||||
| 2025-08-14 | 13F | Arete Wealth Advisors, LLC | 10 481 | 0,44 | 0 | |||||
| 2025-08-22 | 13F/A | TT Capital Management LLC | 104 643 | 7,57 | 1 429 | −4,35 | ||||
| 2025-07-15 | 13F | North Star Investment Management Corp. | 460 | 0,00 | 6 | −14,29 | ||||
| 2025-07-10 | 13F | Sovran Advisors, LLC | 29 882 | −2,37 | 422 | −4,10 | ||||
| 2025-08-06 | 13F | Moors & Cabot, Inc. | 12 402 | 0,11 | 169 | −11,05 | ||||
| 2025-08-12 | 13F | Adalta Capital Management LLC | 25 535 | 0,00 | 349 | −11,22 | ||||
| 2025-07-11 | 13F | Mandatum Life Insurance Co Ltd | 37 714 | −14,82 | 515 | −24,26 | ||||
| 2025-08-13 | 13F | Beacon Pointe Advisors, LLC | 50 352 | −37,87 | 688 | −44,77 | ||||
| 2025-08-06 | 13F | Bruni J V & Co /co | 2 212 352 | 14,29 | 30 221 | 1,64 | ||||
| 2025-03-14 | 13F/A | Hara Capital LLC | 333 | 0,00 | 5 | 0,00 | ||||
| 2025-07-25 | 13F | Almanack Investment Partners, LLC. | 16 361 | 0,00 | 223 | −11,16 | ||||
| 2025-07-16 | 13F | PFS Partners, LLC | 1 936 | 0,00 | 26 | −10,34 | ||||
| 2025-08-11 | 13F | Nordwand Advisors, LLC | 56 311 | −2,10 | 769 | −12,91 | ||||
| 2025-05-15 | 13F | Qube Research & Technologies Ltd | 0 | −100,00 | 0 | |||||
| 2025-08-11 | 13F | Hexagon Capital Partners LLC | 0 | −100,00 | 0 | |||||
| 2025-08-14 | 13F | VPR Management LLC | 8 000 | 109 | ||||||
| 2025-08-12 | 13F | Virtu Financial LLC | 10 966 | −68,49 | 0 | |||||
| 2025-08-07 | 13F | Allworth Financial LP | 3 482 | 48 | ||||||
| 2025-08-21 | NP | BIZD - VanEck Vectors BDC Income ETF | 1 816 009 | 0,24 | 24 807 | −10,85 | ||||
| 2025-08-11 | 13F | HighTower Advisors, LLC | 132 247 | 12,09 | 1 806 | −0,33 | ||||
| 2025-08-08 | 13F | Marble Harbor Investment Counsel, LLC | 18 000 | −10,22 | 246 | −20,20 | ||||
| 2025-08-05 | 13F | Huntington National Bank | 1 | 0,00 | 0 | |||||
| 2025-08-12 | 13F | Bokf, Na | 1 900 | 0,00 | 26 | −13,79 | ||||
| 2025-08-12 | 13F | Legal & General Group Plc | 549 208 | 0,24 | 7 499 | −10,95 | ||||
| 2025-08-08 | 13F | Creative Planning | 53 128 | 1,91 | 726 | −9,37 | ||||
| 2025-08-14 | 13F | Brevan Howard Capital Management LP | 11 784 | 161 | ||||||
| 2025-08-28 | NP | RNCOX - RiverNorth Core Opportunity Fund Class R | 18 231 | 0,00 | 249 | −11,07 | ||||
| 2025-08-08 | 13F | Pnc Financial Services Group, Inc. | 0 | −100,00 | 0 | |||||
| 2025-08-20 | NP | LSPAX - LoCorr Spectrum Income Fund Class A | 40 848 | 0,00 | 558 | −11,16 | ||||
| 2025-05-13 | 13F | Fox Run Management, L.l.c. | 0 | −100,00 | 0 | −100,00 | ||||
| 2025-07-25 | 13F | Atria Wealth Solutions, Inc. | 23 186 | 22,97 | 317 | 9,34 | ||||
| 2025-08-04 | 13F | Canton Hathaway, LLC | 7 350 | 0,00 | 0 | |||||
| 2025-08-13 | 13F | Loomis Sayles & Co L P | 176 666 | 0,00 | 2 413 | 120 550,00 | ||||
| 2025-08-14 | 13F | D. E. Shaw & Co., Inc. | 0 | −100,00 | 0 | |||||
| 2025-08-11 | 13F | Independent Advisor Alliance | 182 795 | −2,48 | 2 497 | −13,30 | ||||
| 2025-07-21 | 13F | Ameriflex Group, Inc. | 340 | 0,59 | 5 | −20,00 | ||||
| 2025-08-13 | 13F | Hbk Investments L P | Put | 44 400 | 0,00 | 607 | −11,01 | |||
| 2025-08-14 | 13F | Federation des caisses Desjardins du Quebec | 4 118 | 0,00 | 56 | −11,11 | ||||
| 2025-08-18 | 13F | Geneos Wealth Management Inc. | 5 869 | −4,21 | 80 | −14,89 | ||||
| 2025-08-12 | 13F | BlackRock, Inc. | 470 761 | 30,11 | 6 431 | 15,71 | ||||
| 2025-06-30 | NP | PSP - Invesco Global Listed Private Equity ETF This fund is a listed as child fund of Invesco Ltd. and if that institution has disclosed ownership in this security, then these positions will not be double counted when calculating total shares and total value | 37 779 | −17,47 | 544 | −25,68 | ||||
| 2025-04-16 | 13F | Everpar Advisors Llc | 0 | −100,00 | 0 | |||||
| 2025-05-15 | 13F | Schonfeld Strategic Advisors LLC | 0 | −100,00 | 0 | |||||
| 2025-08-28 | NP | RNDLX - RiverNorth/DoubleLine Strategic Income Fund Class R | 351 500 | 74,05 | 4 801 | 54,82 | ||||
| 2025-08-19 | 13F | MRP Capital Investments, LLC | 11 578 | 8,34 | 158 | −3,66 | ||||
| 2025-05-28 | NP | VQNPX - Vanguard Growth and Income Fund Investor Shares This fund is a listed as child fund of Vanguard Group Inc and if that institution has disclosed ownership in this security, then these positions will not be double counted when calculating total shares and total value | 4 000 | −54,55 | 61 | −54,48 | ||||
| 2025-05-30 | NP | ERNZ - TrueShares Active Yield ETF | 9 307 | 89,36 | 143 | 89,33 | ||||
| 2025-07-08 | 13F | Parallel Advisors, LLC | 17 250 | 0,00 | 236 | −10,98 | ||||
| 2025-07-31 | 13F | Caitong International Asset Management Co., Ltd | 57 | 714,29 | 1 | |||||
| 2025-08-14 | 13F | Manufacturers Life Insurance Company, The | 259 793 | 0,00 | 3 549 | −11,08 | ||||
| 2025-07-17 | 13F | GraniteShares Advisors LLC | 183 742 | 6,67 | 2 510 | −5,14 | ||||
| 2025-08-13 | 13F | Gabelli Funds Llc | 186 379 | 3,02 | 2 546 | −8,39 | ||||
| 2025-08-12 | 13F | Jpmorgan Chase & Co | 49 140 | −59,41 | 671 | −63,91 | ||||
| 2025-08-08 | 13F | SG Americas Securities, LLC | 10 675 | 17,19 | 0 | |||||
| 2025-08-27 | 13F/A | Squarepoint Ops LLC | 16 261 | −49,56 | 222 | −55,15 | ||||
| 2025-08-14 | 13F | Ares Management Llc | 1 945 305 | −1,62 | 26 573 | −12,51 | ||||
| 2025-04-25 | 13F | Albion Financial Group /ut | 0 | −100,00 | 0 | |||||
| 2025-07-18 | 13F | Institute for Wealth Management, LLC. | 0 | −100,00 | 0 | |||||
| 2025-08-13 | 13F | Plan Group Financial, LLC | 92 151 | 23,45 | 1 259 | 9,77 | ||||
| 2025-07-29 | NP | SSMAX - Siit Small Mid Cap Equity Fund - Class A | 53 000 | 0,00 | 775 | −9,25 | ||||
| 2025-07-03 | 13F | Fiduciary Financial Group, Llc | 60 457 | 12,77 | 831 | 14,46 | ||||
| 2025-08-11 | 13F | Nomura Asset Management Co Ltd | 3 394 | 46 | ||||||
| 2025-08-11 | 13F | Citigroup Inc | 0 | −100,00 | 0 | |||||
| 2025-08-28 | NP | Rivernorth Opportunities Fund, Inc. | 112 931 | 1,08 | 1 543 | −10,14 | ||||
| 2025-08-29 | NP | GraniteShares ETF Trust - GraniteShares HIPS US High Income ETF | 183 742 | 6,67 | 2 510 | −5,14 | ||||
| 2025-08-21 | NP | MOFTX - Mercer Opportunistic Fixed Income Fund Class I | 43 000 | 587 | ||||||
| 2025-08-15 | 13F | Caxton Associates Llp | 47 194 | 0,00 | 645 | −11,05 | ||||
| 2025-04-16 | 13F | Howard Capital Management Group, LLC | 0 | −100,00 | 0 | |||||
| 2025-07-31 | 13F | Nilsine Partners, LLC | 16 455 | 0,00 | 225 | −11,11 | ||||
| 2025-08-11 | 13F | Principal Securities, Inc. | 2 130 | 29 | ||||||
| 2025-08-12 | 13F | Trexquant Investment LP | 179 741 | −34,65 | 2 455 | −41,88 | ||||
| 2025-08-13 | 13F | Guggenheim Capital Llc | 31 406 | 7,61 | 429 | −4,24 | ||||
| 2025-08-07 | 13F | Hennion & Walsh Asset Management, Inc. | 93 778 | −27,64 | 1 281 | −35,63 | ||||
| 2025-05-27 | 13F | Advisors Capital Management, LLC | 0 | −100,00 | 0 | |||||
| 2025-08-11 | 13F | Traub Capital Management LLC | 471 | 6 | ||||||
| 2025-08-12 | 13F | DnB Asset Management AS | 142 266 | 0,00 | 1 943 | −11,08 | ||||
| 2025-08-14 | 13F | Citadel Advisors Llc | 12 977 | −16,68 | 177 | −25,94 | ||||
| 2025-08-14 | 13F | Citadel Advisors Llc | Call | 36 700 | 19,54 | 501 | 6,37 | |||
| 2025-08-14 | 13F | Rivernorth Capital Management, Llc | 618 906 | 86,47 | 8 454 | 65,83 | ||||
| 2025-08-14 | 13F | Citadel Advisors Llc | Put | 95 100 | 30,81 | 1 299 | 16,40 | |||
| 2025-08-14 | 13F | Comerica Bank | 28 259 | 41,04 | 386 | 25,73 | ||||
| 2025-08-04 | 13F | Assetmark, Inc | 548 | −22,16 | 7 | −30,00 | ||||
| 2025-08-14 | 13F | Sunbelt Securities, Inc. | 6 288 | 19,93 | 96 | 20,00 | ||||
| 2025-08-04 | 13F | Flagship Harbor Advisors, Llc | 36 310 | −5,88 | 496 | −16,39 | ||||
| 2025-08-14 | 13F | Stifel Financial Corp | 45 350 | −28,50 | 619 | −36,45 |