Grundläggande statistik
| Institutionella ägare | 232 total, 232 long only, 0 short only, 0 long/short - change of −4,12% MRQ |
| Genomsnittlig portföljallokering | 1.3607 % - change of 2,19% MRQ |
| Institutionella aktier (lång) | 116 617 143 (ex 13D/G) - change of 4,38MM shares 3,90% MRQ |
| Institutionellt värde (lång) | $ 5 138 290 USD ($1000) |
Institutionellt ägande och aktieägare
Janus Detroit Street Trust - Janus Henderson Mortgage-Backed Securities ETF (US:JMBS) har 232 Institutionella ägare och aktieägare som har lämnat in 13D/G- eller 13F-formulär till Securities Exchange Commission (SEC). Dessa institut innehar totalt 116,617,143 aktier. Största aktieägare inkluderar Morgan Stanley, Bank Of America Corp /de/, Richard Bernstein Advisors LLC, Charles Schwab Investment Management Inc, Raymond James Financial Inc, Congress Wealth Management LLC / DE /, Envestnet Asset Management Inc, Kovitz Investment Group Partners, LLC, Haverford Trust Co, and UBS Group AG .
Janus Detroit Street Trust - Janus Henderson Mortgage-Backed Securities ETF (ARCA:JMBS) Institutionell ägarstruktur visar institutioners och fonders nuvarande positioner i företaget, samt de senaste förändringarna i positionernas storlek. Större aktieägare kan vara enskilda investerare, fonder, hedgefonder eller institutioner. Bilaga 13D visar att investeraren äger (eller ägde) mer än 5% av företaget och avser (eller avsåg) att aktivt eftersträva en förändring av affärsstrategin. Schedule 13G indikerar en passiv investering på över 5%.
The share price as of September 9, 2025 is 45,64 / share. Previously, on September 10, 2024, the share price was 46,97 / share. This represents a decline of 2,83% over that period.

Fondsentimentets poäng
Fondsentimentet poängen(fka Ägarackumulation-poäng) visar vilka aktier som är mest köpta av fonder. Det är resultatet av en sofistikerad kvantitativ flerfaktormodell som identifierar företag med de högsta nivåerna av institutionell ackumulering. Poängsättningsmodellen använder en kombination av den totala ökningen av redovisade ägare, förändringarna i portföljallokeringarna för dessa ägare och andra mått. Siffran sträcker sig från 0 till 100, där högre siffror indikerar en högre nivå av ackumulering i förhållande till sina konkurrenter, och 50 är genomsnittet.
Uppdateringsfrekvens: Dagligen
Se Ownership Explorer, som innehåller en lista över de högst rankade företagen.
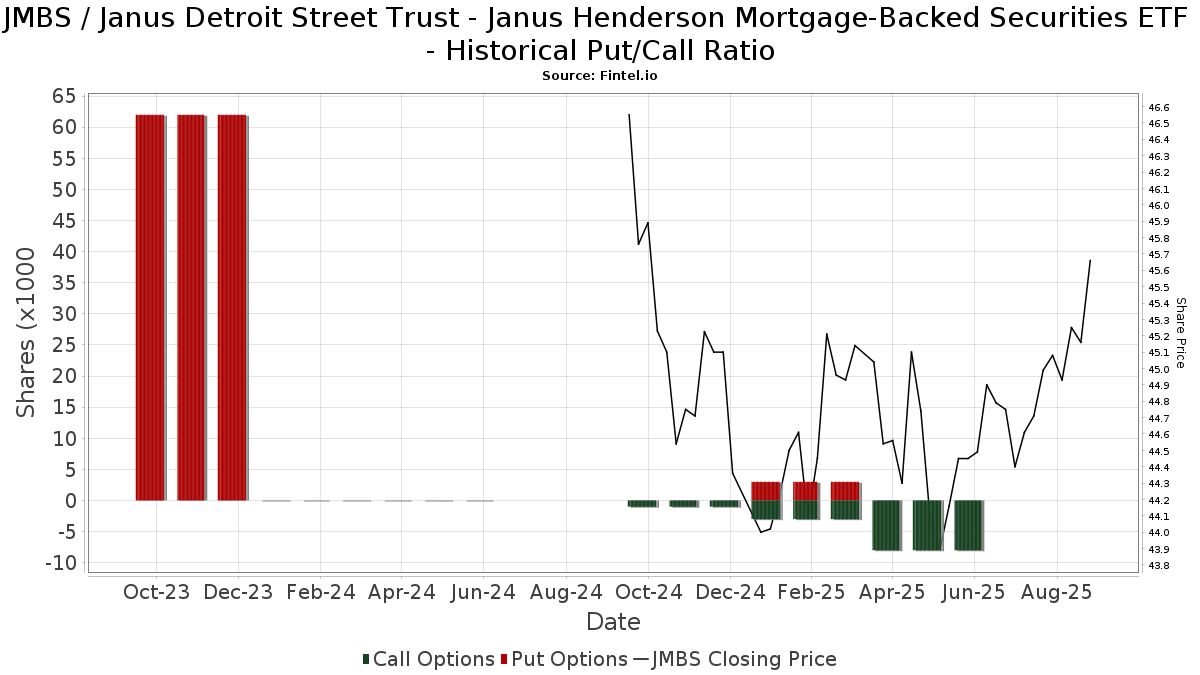
Institutionell sälj/köp-kvot
Förutom att rapportera vanliga eget kapital- och skuldemissioner måste institutioner med mer än 100MM tillgångar under förvaltning också avslöja sina innehav av sälj- och köpoptioner. Eftersom säljoptioner i allmänhet indikerar ett negativt sentiment och köpoptioner indikerar ett positivt sentiment, kan vi få en uppfattning om det övergripande institutionella sentimentet genom att plotta förhållandet mellan säljoptioner och köpoptioner. Diagrammet till höger visar det historiska förhållandet mellan sälj- och köpoptioner för detta instrument.
Genom att använda sälj/köp-kvoten som en indikator på aktieägarnas sentiment undviker man en av de största bristerna med att använda det totala institutionella ägandet, nämligen att en betydande del av de förvaltade tillgångarna investeras passivt för att följa index. Passivt förvaltade fonder köper vanligtvis inte optioner, så indikatorn för sälj/köp-kvoten ger en bättre bild av stämningen i aktivt förvaltade fonder.
13F- och NPORT-arkiveringar
Detaljer om 13F-arkiveringar är gratis. Detaljer om NP-arkiveringar kräver ett premiummedlemskap. Gröna rader indikerar nya positioner. Röda rader indikerar stängda positioner. Klicka på länk symbolen för att se hela transaktionshistoriken.
Uppgradera
för att låsa upp premiumdata och exportera till Excel ![]() .
.
| Fil Datum | Källa | Investerare | Typ | Genomsnittligt pris (beräknat) |
Aktier | Δ Aktier (%) |
Rapporterat värde (1000 USD) |
Δ Värde (%) |
Portföljallokering (%) |
|
|---|---|---|---|---|---|---|---|---|---|---|
| 2025-07-23 | 13F | Venturi Wealth Management, LLC | 8 590 | 7,54 | 387 | 6,93 | ||||
| 2025-08-14 | 13F | Financial Network Wealth Advisors LLC | 1 730 | 0,00 | 78 | −1,28 | ||||
| 2025-07-30 | 13F | Towneley Capital Management, Inc / DE | 578 220 | 29,09 | 26 049 | 28,66 | ||||
| 2025-08-12 | 13F | Argent Trust Co | 7 816 | 352 | ||||||
| 2025-07-29 | 13F | Mattson Financial Services, LLC | 39 278 | −1,34 | 1 769 | −1,67 | ||||
| 2025-08-12 | 13F | Charles Schwab Investment Management Inc | 8 051 033 | 1,63 | 362 699 | 1,30 | ||||
| 2025-07-09 | 13F | Lincoln Capital Corp | 136 862 | −1,52 | 6 166 | −1,85 | ||||
| 2025-08-11 | 13F | Advisor Resource Council | 0 | −100,00 | 0 | |||||
| 2025-08-19 | 13F | National Asset Management, Inc. | 29 467 | 103,87 | 1 328 | 107,99 | ||||
| 2025-08-14 | 13F | Bank Of America Corp /de/ | 18 218 672 | 11,60 | 820 751 | 11,23 | ||||
| 2025-08-11 | 13F | Cornerstone Planning Group LLC | 0 | −100,00 | 0 | |||||
| 2025-08-11 | 13F | Madison Asset Management, LLC | 1 726 547 | −6,59 | 77 781 | −6,90 | ||||
| 2025-07-15 | 13F | Pictet North America Advisors SA | 301 832 | 59,06 | 13 598 | 58,53 | ||||
| 2025-07-15 | 13F | Garrett Investment Advisors LLC | 806 524 | 7,56 | 36 334 | 7,20 | ||||
| 2025-08-13 | 13F | Townsquare Capital Llc | 6 952 | −92,67 | 313 | −92,69 | ||||
| 2025-05-14 | 13F | Jane Street Group, Llc | 0 | −100,00 | 0 | |||||
| 2025-07-24 | 13F | Endeavor Private Wealth, Inc. | 7 990 | −5,11 | 360 | −5,53 | ||||
| 2025-08-12 | 13F | AlphaCore Capital LLC | 4 356 | 0,07 | 196 | 0,00 | ||||
| 2025-07-18 | 13F | Truist Financial Corp | 489 704 | 1,76 | 22 061 | 1,42 | ||||
| 2025-07-09 | 13F | Breakwater Capital Group | 10 306 | −31,32 | 464 | −31,56 | ||||
| 2025-05-16 | 13F | Coppell Advisory Solutions LLC | 0 | −100,00 | 0 | |||||
| 2025-07-21 | 13F | Mirae Asset Global Investments Co., Ltd. | 0 | −100,00 | 0 | |||||
| 2025-07-30 | 13F | Parcion Private Wealth LLC | 732 374 | −1,13 | 32 993 | −1,45 | ||||
| 2025-07-15 | 13F | North Star Investment Management Corp. | 3 103 | −9,40 | 140 | −9,74 | ||||
| 2025-08-13 | 13F | Transce3nd, LLC | 240 | 11 | ||||||
| 2025-07-28 | 13F | Mutual Advisors, LLC | 14 171 | 0,00 | 633 | −0,47 | ||||
| 2025-08-14 | 13F | Atomi Financial Group, Inc. | 22 932 | 26,08 | 1 033 | 25,67 | ||||
| 2025-07-01 | 13F | Harbor Investment Advisory, Llc | 42 893 | −16,18 | 1 932 | −16,44 | ||||
| 2025-07-30 | 13F | Brookstone Capital Management | 305 361 | −2,07 | 13 757 | −2,40 | ||||
| 2025-07-14 | 13F | Acropolis Investment Management, LLC | 43 955 | −7,96 | 1 980 | −8,25 | ||||
| 2025-08-01 | 13F | James Investment Research Inc | 11 764 | 3,18 | 530 | 2,72 | ||||
| 2025-07-21 | 13F | AIFG Consultants Ltd. | 27 418 | 68,68 | 1 235 | 68,26 | ||||
| 2025-08-12 | 13F | OneAscent Financial Services LLC | 6 870 | −83,33 | 0 | −100,00 | ||||
| 2025-08-14 | 13F | Kovitz Investment Group Partners, LLC | 2 468 448 | 19,11 | 111 203 | 18,71 | ||||
| 2025-08-14 | 13F | Horizon Investments, LLC | 537 302 | −10,74 | 24 001 | −11,04 | ||||
| 2025-08-08 | 13F | Creative Planning | 8 561 | −9,60 | 386 | −10,05 | ||||
| 2025-08-14 | 13F | Citadel Advisors Llc | 113 519 | 5 114 | ||||||
| 2025-08-14 | 13F | Coastal Bridge Advisors, LLC | 14 644 | −47,91 | 660 | −48,11 | ||||
| 2025-05-15 | 13F/A | Orion Portfolio Solutions, LLC | 40 531 | −13,05 | 1 832 | −11,02 | ||||
| 2025-08-14 | 13F | Citadel Advisors Llc | Call | 8 900 | 128,21 | 401 | 127,27 | |||
| 2025-08-13 | 13F | Cary Street Partners Financial Llc | 6 395 | −50,05 | 288 | −50,17 | ||||
| 2025-07-30 | 13F | WESPAC Advisors SoCal, LLC | 154 795 | 13,16 | 6 974 | 12,80 | ||||
| 2025-08-13 | 13F | GeoWealth Management, LLC | 4 070 | −7,56 | 183 | −8,04 | ||||
| 2025-04-02 | 13F | Marcum Wealth, LLC | 74 065 | 1,23 | 3 348 | 3,56 | ||||
| 2025-08-04 | 13F | Assetmark, Inc | 87 | 42,62 | 4 | 50,00 | ||||
| 2025-07-14 | 13F | Seed Wealth Management, Inc. | 147 778 | 5,88 | 6 657 | 5,53 | ||||
| 2025-07-16 | 13F | Signaturefd, Llc | 989 | 6,92 | 45 | 7,32 | ||||
| 2025-08-04 | 13F | Creative Financial Designs Inc /adv | 64 | 3 | ||||||
| 2025-08-14 | 13F | Mercer Global Advisors Inc /adv | 0 | −100,00 | 0 | |||||
| 2025-07-25 | 13F | Envestnet Portfolio Solutions, Inc. | 276 065 | 37,72 | 12 437 | 37,26 | ||||
| 2025-08-04 | 13F | Atria Investments Llc | 87 364 | 14,99 | 3 936 | 14,62 | ||||
| 2025-08-11 | 13F | Principal Securities, Inc. | 1 373 | 183,09 | 62 | 190,48 | ||||
| 2025-08-12 | 13F | Jpmorgan Chase & Co | 1 301 | 18,06 | 59 | 18,37 | ||||
| 2025-07-24 | 13F | Blair William & Co/il | 0 | −100,00 | 0 | |||||
| 2025-07-31 | 13F | Moment Partners, LLC | 426 901 | −0,30 | 19 232 | −0,64 | ||||
| 2025-05-13 | 13F | Bokf, Na | 0 | −100,00 | 0 | −100,00 | ||||
| 2025-07-31 | 13F/A | Interchange Capital Partners, LLC | 4 440 | 200 | ||||||
| 2025-08-11 | 13F | Private Advisor Group, LLC | 25 857 | −7,56 | 1 165 | −7,91 | ||||
| 2025-08-14 | 13F | Comerica Bank | 73 802 | 4,30 | 3 325 | 3,94 | ||||
| 2025-08-12 | 13F | Coldstream Capital Management Inc | 0 | −100,00 | 0 | |||||
| 2025-05-12 | 13F | Ameritas Investment Partners, Inc. | 0 | −100,00 | 0 | |||||
| 2025-08-05 | 13F | Bank of New York Mellon Corp | 974 570 | 4,13 | 43 904 | 3,78 | ||||
| 2025-08-08 | 13F | Good Life Advisors, LLC | 25 840 | −16,09 | 1 164 | −16,32 | ||||
| 2025-08-12 | 13F | Global Retirement Partners, LLC | 225 | −14,45 | 10 | −9,09 | ||||
| 2025-07-10 | 13F | Redhawk Wealth Advisors, Inc. | 0 | −100,00 | 0 | |||||
| 2025-08-12 | 13F | Allen Capital Group, LLC | 224 741 | 12,24 | 10 125 | 11,87 | ||||
| 2025-08-14 | 13F | Royal Bank Of Canada | 1 220 440 | 18,89 | 54 981 | 18,50 | ||||
| 2025-08-14 | 13F | Stansberry Asset Management, Llc | 300 423 | 134,28 | 13 534 | 133,51 | ||||
| 2025-07-08 | 13F | Parallel Advisors, LLC | 1 289 076 | 7,37 | 58 073 | 7,02 | ||||
| 2025-08-13 | 13F | VestGen Advisors, LLC | 46 058 | 6,29 | 2 075 | 5,92 | ||||
| 2025-07-16 | 13F | True North Advisors, LLC | 269 270 | −30,32 | 12 131 | −30,55 | ||||
| 2025-04-15 | 13F | Transform Wealth, LLC | 334 255 | 9,88 | 15 108 | 12,42 | ||||
| 2025-08-11 | 13F | Tidemark, LLC | 11 786 | −42,83 | 531 | −43,07 | ||||
| 2025-07-14 | 13F | Chris Bulman Inc | 0 | −100,00 | 0 | |||||
| 2025-07-08 | 13F | Webster Bank, N. A. | 440 | −44,30 | 20 | −45,71 | ||||
| 2025-07-17 | 13F | KWB Wealth | 78 410 | −14,73 | 3 544 | −12,75 | ||||
| 2025-08-07 | 13F | FDx Advisors, Inc. | 32 604 | −2,01 | 1 | 0,00 | ||||
| 2025-08-12 | 13F | BlackRock, Inc. | 3 617 | 0,00 | 163 | −0,61 | ||||
| 2025-07-09 | 13F | Goelzer Investment Management, Inc. | 311 295 | −0,01 | 14 024 | −0,34 | ||||
| 2025-07-09 | 13F | Pallas Capital Advisors LLC | 1 408 330 | 16,17 | 63 445 | 15,78 | ||||
| 2025-07-16 | 13F | Banque Pictet & Cie Sa | 31 170 | 2,68 | 1 404 | 2,33 | ||||
| 2025-06-17 | NP | MCNAX - Madison Conservative Allocation Fund Conservative Allocation Fund Class A | 70 522 | 0,00 | 3 181 | 1,40 | ||||
| 2025-08-18 | 13F/A | Kestra Investment Management, LLC | 404 973 | −37,00 | 18 244 | −37,21 | ||||
| 2025-07-24 | NP | AIHAX - Horizon Active Income Fund Advisor Class | 476 902 | 13,62 | 21 189 | 11,14 | ||||
| 2025-08-15 | 13F | Kestra Advisory Services, LLC | 59 896 | 51,74 | 2 698 | 51,23 | ||||
| 2025-07-16 | 13F | Patron Partners Advisors, Llc | 32 547 | 20,37 | 1 466 | 19,97 | ||||
| 2025-08-14 | 13F/A | Skopos Labs, Inc. | 2 236 | 101 | ||||||
| 2025-07-22 | 13F | Macroview Investment Management Llc | 55 131 | 1,61 | 2 484 | 1,26 | ||||
| 2025-07-15 | 13F | Focused Wealth Management, Inc | 239 657 | 10 797 | ||||||
| 2025-08-14 | 13F | Bnp Paribas Arbitrage, Sa | 0 | −100,00 | 0 | |||||
| 2025-08-13 | 13F | Capital Analysts, Inc. | 507 | 1,20 | 0 | |||||
| 2025-07-23 | 13F | Valmark Advisers, Inc. | 7 690 | 8,36 | 346 | 8,13 | ||||
| 2025-08-14 | 13F | Citadel Advisors Llc | Put | 0 | −100,00 | 0 | ||||
| 2025-08-14 | 13F | CoreCap Advisors, LLC | 8 387 | 0,66 | 378 | 0,27 | ||||
| 2025-08-15 | 13F | Blue Edge Capital, LLC | 316 488 | −2,94 | 14 258 | −3,26 | ||||
| 2025-08-05 | 13F | Redwood Wealth Management Group, LLC | 41 374 | −1,34 | 1 864 | −1,69 | ||||
| 2025-05-20 | 13F | Blue Rock Wealth Management LLC | 81 571 | 1,64 | 3 687 | 4,01 | ||||
| 2025-05-15 | 13F | Minot DeBlois Advisors LLC | 0 | −100,00 | 0 | |||||
| 2025-07-08 | 13F | Advance Capital Management, Inc. | 582 298 | −11,01 | 26 233 | −11,30 | ||||
| 2025-07-24 | 13F | Leo Wealth, LLC | 392 306 | 174,19 | 17 684 | 173,45 | ||||
| 2025-08-05 | 13F | Huntington National Bank | 11 | 100,00 | ||||||
| 2025-08-07 | 13F | Allworth Financial LP | 1 667 | 198,21 | 75 | 212,50 | ||||
| 2025-07-08 | 13F | Rise Advisors, LLC | 335 723 | 5,61 | 15 124 | 5,26 | ||||
| 2025-08-06 | 13F | Commonwealth Equity Services, Llc | 63 269 | −8,03 | 3 | −33,33 | ||||
| 2025-08-14 | 13F | Planwiser Financial, Llc | 0 | −100,00 | 0 | |||||
| 2025-08-06 | 13F | Bensler, LLC | 9 834 | −3,40 | 443 | −3,70 | ||||
| 2025-05-02 | 13F | Bogart Wealth, LLC | 0 | −100,00 | 0 | |||||
| 2025-07-08 | 13F | Paladin Wealth, LLC | 77 895 | −7,42 | 3 509 | −7,71 | ||||
| 2025-08-04 | 13F | Arkadios Wealth Advisors | 9 575 | 6,71 | 431 | 6,42 | ||||
| 2025-08-11 | 13F | Johnson Financial Group, LLC | 0 | −100,00 | 0 | |||||
| 2025-05-06 | 13F | Fpc Investment Advisory, Inc. | 0 | −100,00 | 0 | |||||
| 2025-08-06 | 13F | Sage Advisory Services, Ltd.Co. | 11 209 | −6,90 | 505 | −7,17 | ||||
| 2025-05-14 | 13F | WCG Wealth Advisors LLC | 0 | −100,00 | 0 | |||||
| 2025-06-17 | NP | MMDAX - Madison Moderate Allocation Fund Moderate Allocation Fund Class A | 94 347 | 0,00 | 4 255 | 1,41 | ||||
| 2025-07-08 | 13F | Atwood & Palmer Inc | 22 625 | −5,85 | 1 019 | −6,17 | ||||
| 2025-07-09 | 13F | Bulwark Capital Corp | 38 548 | 1 737 | ||||||
| 2025-06-30 | NP | Northern Lights Fund Trust - PFG Janus Henderson(R) Balanced Strategy Class R Shares | 442 582 | 12,52 | 19 960 | 14,09 | ||||
| 2025-04-16 | 13F | New Century Financial Group, LLC | 0 | −100,00 | 0 | |||||
| 2025-08-14 | 13F | GWM Advisors LLC | 55 479 | 111,62 | 2 499 | 111,06 | ||||
| 2025-08-13 | 13F | Rosenblum Silverman Sutton S F Inc /ca | 139 195 | 10,34 | 6 271 | 9,98 | ||||
| 2025-08-14 | 13F | Hrt Financial Lp | 0 | −100,00 | 0 | |||||
| 2025-06-17 | NP | MAGSX - Madison Aggressive Allocation Fund Aggressive Allocation Fund Class A | 18 274 | 0,00 | 824 | 1,48 | ||||
| 2025-07-28 | 13F | Kiker Wealth Management, LLC | 0 | −100,00 | 0 | |||||
| 2025-08-13 | 13F | Haverford Trust Co | 2 464 525 | 16,16 | 111 027 | 15,77 | ||||
| 2025-08-12 | 13F | Proequities, Inc. | 0 | 0 | ||||||
| 2025-08-15 | 13F | Prevail Innovative Wealth Advisors, Llc | 63 457 | 63,75 | 2 859 | 63,22 | ||||
| 2025-07-25 | 13F | Verdence Capital Advisors LLC | 21 253 | 16,77 | 957 | 16,42 | ||||
| 2025-07-17 | 13F | Albion Financial Group /ut | 568 129 | 0,50 | 25 594 | 0,16 | ||||
| 2025-08-07 | 13F | PFG Advisors | 11 748 | 529 | ||||||
| 2025-08-14 | 13F | IHT Wealth Management, LLC | 29 795 | 5,96 | 1 342 | 5,67 | ||||
| 2025-06-17 | NP | MBLAX - Madison Diversified Income Fund Diversified Income Fund Class A | 141 625 | −53,51 | 6 387 | −52,86 | ||||
| 2025-08-18 | NP | ULTRA SERIES FUND - Madison Target Retirement 2030 Fund Class I | 210 446 | 0,00 | 9 481 | −0,34 | ||||
| 2025-08-12 | 13F | Steward Partners Investment Advisory, Llc | 5 271 | 54,03 | 237 | 53,90 | ||||
| 2025-07-29 | 13F | Foster & Motley Inc | 1 502 474 | 8,74 | 68 | 8,06 | ||||
| 2025-08-12 | 13F | Running Point Capital Advisors, LLC | 1 476 | 0,00 | 66 | 0,00 | ||||
| 2025-08-13 | 13F | Congress Wealth Management LLC / DE / | 2 631 676 | 3,09 | 118 557 | 2,75 | ||||
| 2025-04-21 | 13F | Nelson, Van Denburg & Campbell Wealth Management Group, LLC | 0 | −100,00 | 0 | |||||
| 2025-08-18 | NP | ULTRA SERIES FUND - Madison Target Retirement 2050 Fund Class I | 64 968 | 0,00 | 2 927 | −0,34 | ||||
| 2025-07-25 | 13F | Cwm, Llc | 447 | 14,32 | 0 | |||||
| 2025-08-13 | 13F | Tranquilli Financial Advisor LLC | 24 298 | −26,44 | 1 095 | −26,72 | ||||
| 2025-07-16 | 13F | RWM Asset Management, LLC | 88 018 | −2,36 | 3 965 | −2,68 | ||||
| 2025-07-24 | 13F | Trust Co Of Toledo Na /oh/ | 294 | 13 | ||||||
| 2025-06-30 | NP | PFTSX - PFG Tactical Income Strategy Fund Class R Shares | 405 519 | 84,46 | 18 289 | 87,03 | ||||
| 2025-08-12 | 13F | Heritage Trust Co | 21 899 | −1,70 | 987 | −1,99 | ||||
| 2025-05-14 | 13F | United Asset Strategies, Inc. | 0 | −100,00 | 0 | |||||
| 2025-07-28 | 13F | Cornerstone Wealth Group, LLC | 132 098 | 1,36 | 5 951 | 1,04 | ||||
| 2025-07-10 | 13F | Secure Asset Management, LLC | 213 603 | −3,37 | 9 623 | −3,69 | ||||
| 2025-08-01 | 13F | Fire Capital Management LLC | 21 908 | 11,76 | 987 | 11,29 | ||||
| 2025-07-22 | 13F | Merit Financial Group, LLC | 36 261 | −47,11 | 1 634 | −47,31 | ||||
| 2025-08-01 | 13F | Transcend Wealth Collective, Llc | 0 | −100,00 | 0 | |||||
| 2025-08-14 | 13F/A | Rockefeller Capital Management L.P. | 380 249 | 12,39 | 17 130 | 12,03 | ||||
| 2025-07-22 | 13F | IVC Wealth Advisors LLC | 91 069 | 213,52 | 4 103 | 212,65 | ||||
| 2025-08-13 | 13F | Guggenheim Capital Llc | 399 025 | 50,90 | 17 976 | 50,40 | ||||
| 2025-08-14 | 13F | Wells Fargo & Company/mn | 1 394 230 | 8,24 | 62 810 | 7,88 | ||||
| 2025-07-10 | 13F | Sovran Advisors, LLC | 29 786 | −26,59 | 1 328 | −26,40 | ||||
| 2025-07-18 | 13F | Impact Capital Partners LLC | 16 925 | 10,35 | 762 | 9,96 | ||||
| 2025-07-24 | 13F | Ronald Blue Trust, Inc. | 33 302 | 29,83 | 1 500 | 29,42 | ||||
| 2025-08-12 | 13F | MAI Capital Management | 1 074 | −43,77 | 48 | −44,19 | ||||
| 2025-08-14 | 13F | Ancora Advisors, LLC | 97 035 | 2,37 | 4 371 | 2,03 | ||||
| 2025-08-05 | 13F | Fourth Dimension Wealth, LLC | 236 228 | 14,47 | 10 642 | 14,10 | ||||
| 2025-08-12 | 13F | Gladstone Institutional Advisory LLC | 0 | −100,00 | 0 | |||||
| 2025-08-14 | 13F | Harwood Advisory Group, LLC | 0 | −100,00 | 0 | |||||
| 2025-07-17 | 13F | SeaBridge Investment Advisors LLC | 320 543 | 24,19 | 14 440 | 23,78 | ||||
| 2025-08-07 | 13F | Americana Partners, LLC | 6 898 | 0,00 | 311 | −0,32 | ||||
| 2025-08-06 | 13F | Richard Bernstein Advisors LLC | 10 274 977 | 7,32 | 462 888 | 6,96 | ||||
| 2025-08-14 | 13F | Warren Averett Asset Management, LLC | 49 352 | 1,24 | 2 223 | 0,91 | ||||
| 2025-09-04 | 13F/A | Advisor Group Holdings, Inc. | 241 851 | 18,89 | 10 896 | 18,50 | ||||
| 2025-08-06 | 13F | Founders Financial Securities Llc | 52 748 | 0,53 | 2 376 | 0,72 | ||||
| 2025-08-18 | NP | ULTRA SERIES FUND - Madison Target Retirement 2040 Fund Class I | 103 807 | 0,00 | 4 677 | −0,34 | ||||
| 2025-08-18 | 13F | Geneos Wealth Management Inc. | 749 | 302,69 | 34 | 312,50 | ||||
| 2025-08-15 | 13F | CI Private Wealth, LLC | 1 466 571 | 5,89 | 66 069 | 5,54 | ||||
| 2025-08-12 | 13F | Eldridge Investment Advisors, Inc. | 0 | −100,00 | 0 | |||||
| 2025-07-24 | 13F | Us Bancorp \de\ | 3 320 | 69,22 | 150 | 69,32 | ||||
| 2025-08-18 | NP | ULTRA SERIES FUND - Conservative Allocation Fund Class I | 81 863 | 0,00 | 3 688 | −0,35 | ||||
| 2025-07-08 | 13F | Gradient Investments LLC | 1 988 133 | −0,08 | 89 565 | −0,41 | ||||
| 2025-08-13 | 13F | Jones Financial Companies Lllp | 0 | −100,00 | 0 | |||||
| 2025-08-11 | 13F | Elequin Capital Lp | 7 496 | 338 | ||||||
| 2025-08-14 | 13F | Boston Private Wealth Llc | 0 | −100,00 | 0 | |||||
| 2025-08-05 | 13F | EPG Wealth Management LLC | 2 494 | −11,87 | 112 | −11,81 | ||||
| 2025-08-18 | NP | ULTRA SERIES FUND - Aggressive Allocation Fund Class I | 12 523 | −10,99 | 564 | −11,18 | ||||
| 2025-07-17 | 13F | Janney Montgomery Scott LLC | 342 544 | 37,60 | 15 | 36,36 | ||||
| 2025-07-25 | 13F | Atria Wealth Solutions, Inc. | 8 550 | −80,26 | 385 | −80,33 | ||||
| 2025-07-09 | 13F | Inspirion Wealth Advisors, Llc | 517 250 | 4,23 | 23 302 | 3,89 | ||||
| 2025-08-14 | 13F | Transamerica Financial Advisors, Inc. | 101 411 | −7,70 | 4 569 | 114 100,00 | ||||
| 2025-05-05 | 13F | Diversify Advisory Services, LLC | 0 | −100,00 | 0 | |||||
| 2025-07-31 | 13F | Cambridge Investment Research Advisors, Inc. | 301 929 | 10,69 | 14 | 8,33 | ||||
| 2025-08-18 | NP | ULTRA SERIES FUND - Madison Target Retirement 2020 Fund Class I | 58 586 | −6,57 | 2 639 | −6,88 | ||||
| 2025-08-14 | 13F | Hamilton Capital, LLC | 1 968 510 | −43,62 | 88 681 | −43,81 | ||||
| 2025-07-09 | 13F | Presidio Capital Management, LLC | 7 991 | −9,60 | 360 | −10,03 | ||||
| 2025-08-06 | 13F | First Horizon Advisors, Inc. | 143 | −28,86 | 6 | −33,33 | ||||
| 2025-08-14 | 13F | Mariner, LLC | 56 455 | −4,44 | 2 543 | −4,76 | ||||
| 2025-08-08 | 13F | Bailard, Inc. | 1 418 951 | −0,99 | 63 924 | −1,32 | ||||
| 2025-08-14 | 13F | Mml Investors Services, Llc | 242 442 | −5,39 | 11 | −9,09 | ||||
| 2025-08-14 | 13F | Stifel Financial Corp | 144 943 | 17,10 | 6 530 | 16,71 | ||||
| 2025-08-18 | NP | ULTRA SERIES FUND - Moderate Allocation Fund Class I | 95 558 | −12,02 | 4 305 | −12,32 | ||||
| 2025-07-28 | NP | EARAX - Eaton Vance Richard Bernstein All Asset Strategy Fund Class A | 1 204 300 | −41,03 | 53 507 | −42,31 | ||||
| 2025-04-22 | 13F | Castleview Partners, Llc | 0 | −100,00 | 0 | |||||
| 2025-08-08 | 13F | Crossmark Global Holdings, Inc. | 7 322 | −28,95 | 330 | −29,25 | ||||
| 2025-08-14 | 13F | Sentinus, LLC | 86 466 | 9,65 | 3 895 | 9,29 | ||||
| 2025-08-08 | 13F | Symphony Financial Services, Inc. | 165 171 | −2,14 | 7 441 | −2,48 | ||||
| 2025-08-18 | NP | ULTRA SERIES FUND - Diversified Income Fund Class I | 157 638 | −24,81 | 7 102 | −25,06 | ||||
| 2025-07-11 | 13F | Pinnacle Bancorp, Inc. | 31 | 0,00 | 1 | 0,00 | ||||
| 2025-07-28 | 13F | Harbour Investments, Inc. | 19 787 | 82,64 | 891 | 82,21 | ||||
| 2025-08-06 | 13F | AE Wealth Management LLC | 2 912 | −23,85 | 131 | −23,84 | ||||
| 2025-08-13 | 13F | ASB Consultores, LLC | 22 772 | 1 026 | ||||||
| 2025-05-15 | 13F | Old Mission Capital Llc | 0 | −100,00 | 0 | |||||
| 2025-07-30 | 13F/A | Divergent Planning, LLC | 812 743 | 4,55 | 36 443 | 3,28 | ||||
| 2025-08-13 | 13F | Gibbs Wealth Management | 59 676 | 2 688 | ||||||
| 2025-08-14 | 13F | Wiley Bros.-aintree Capital, Llc | 36 579 | 1 648 | ||||||
| 2025-08-05 | 13F | Scarborough Advisors, LLC | 1 300 | 59 | ||||||
| 2025-08-15 | 13F | Morgan Stanley | 20 205 072 | 11,82 | 910 239 | 11,44 | ||||
| 2025-07-25 | 13F | Apollon Wealth Management, LLC | 71 210 | −41,90 | 3 208 | −42,08 | ||||
| 2025-08-04 | 13F | Northwest Financial Advisors | 39 069 | −24,68 | 1 760 | −24,91 | ||||
| 2025-08-12 | 13F | Haverford Financial Services, Inc. | 14 359 | 3,41 | 647 | 3,03 | ||||
| 2025-07-08 | 13F | Nbc Securities, Inc. | 3 433 | 358,34 | 0 | |||||
| 2025-08-14 | 13F | UBS Group AG | 1 997 679 | 22,86 | 89 995 | 22,45 | ||||
| 2025-07-23 | 13F | Clear Creek Financial Management, LLC | 26 806 | 13,77 | 1 208 | 13,33 | ||||
| 2025-08-11 | 13F | Traub Capital Management LLC | 5 350 | 241 | ||||||
| 2025-07-08 | 13F | Legacy Private Trust Co. | 472 534 | −3,41 | 21 288 | −3,73 | ||||
| 2025-07-17 | 13F | Saxon Interests, Inc. | 6 020 | 0,00 | 272 | 0,00 | ||||
| 2025-04-28 | 13F | Private Trust Co Na | 0 | −100,00 | 0 | |||||
| 2025-08-07 | 13F | CENTRAL TRUST Co | 266 | 12 | ||||||
| 2025-08-13 | 13F | Cerity Partners LLC | 0 | −100,00 | 0 | |||||
| 2025-08-14 | 13F | Raymond James Financial Inc | 3 066 906 | 3,15 | 138 164 | 2,81 | ||||
| 2025-07-22 | 13F | Belpointe Asset Management LLC | 11 806 | −17,26 | 532 | −17,29 | ||||
| 2025-07-09 | 13F | Aaron Wealth Advisors LLC | 5 645 | −7,85 | 254 | −7,97 | ||||
| 2025-08-05 | 13F | Transatlantique Private Wealth Llc | 20 933 | 26,48 | 943 | 26,07 | ||||
| 2025-08-11 | 13F | Brown Brothers Harriman & Co | 0 | −100,00 | 0 | |||||
| 2025-08-13 | 13F | Nicolet Bankshares Inc | 12 684 | 571 | ||||||
| 2025-08-22 | 13F | Carter Financial Group, INC. | 38 498 | 1 734 | ||||||
| 2025-08-08 | 13F | Flaharty Asset Management, LLC | 0 | −100,00 | 0 | |||||
| 2025-08-13 | 13F | MONECO Advisors, LLC | 91 557 | 54,91 | 4 125 | 54,40 | ||||
| 2025-08-15 | 13F | Brown Financial Advisors | 91 056 | −2,01 | 4 102 | −2,33 | ||||
| 2025-08-13 | 13F | Millstone Evans Group, LLC | 166 | 0,00 | 7 | 0,00 | ||||
| 2025-07-24 | 13F | Stonebridge Financial Group, LLC | 0 | −100,00 | 0 | |||||
| 2025-07-17 | 13F | Sound Income Strategies, LLC | 280 | 0,00 | 13 | 0,00 | ||||
| 2025-08-13 | 13F | Legacy Capital Wealth Partners, LLC | 6 724 | −23,12 | 303 | −23,54 | ||||
| 2025-07-14 | 13F | Financial Enhancement Group LLC | 476 327 | −1,54 | 21 216 | −0,79 | ||||
| 2025-08-12 | 13F | Lionshead Wealth Management, LLC | 33 430 | 26,16 | 1 506 | 25,81 | ||||
| 2025-08-14 | 13F | Goldman Sachs Group Inc | 0 | −100,00 | 0 | |||||
| 2025-07-14 | 13F | Painted Porch Advisors LLC | 0 | −100,00 | 0 | |||||
| 2025-07-11 | 13F | Farther Finance Advisors, LLC | 278 | −98,94 | 13 | −98,99 | ||||
| 2025-08-12 | 13F | Richmond Investment Services, LLC | 25 780 | 98,58 | 1 161 | 98,12 | ||||
| 2025-08-11 | 13F | HighTower Advisors, LLC | 5 618 | −4,29 | 253 | −4,53 | ||||
| 2025-08-07 | 13F | AllGen Financial Advisors, Inc. | 298 203 | 13 434 | ||||||
| 2025-05-15 | 13F | AlphaQ Advisors LLC | 19 959 | 902 | ||||||
| 2025-08-11 | 13F | Bulltick Wealth Management, LLC | 9 541 | 0,00 | 430 | −0,46 | ||||
| 2025-08-19 | 13F | Newbridge Financial Services Group, Inc. | 137 | −7,43 | 6 | 0,00 | ||||
| 2025-08-14 | 13F | Susquehanna International Group, Llp | 0 | −100,00 | 0 | |||||
| 2025-08-07 | 13F | 49 Wealth Management, Llc | 4 721 | 1,27 | 213 | 0,95 | ||||
| 2025-08-14 | 13F | Modern Wealth Management, LLC | 852 442 | 131,17 | 38 402 | 130,41 | ||||
| 2025-07-08 | 13F | Ehrlich Financial Group | 53 360 | 25,41 | 2 404 | 24,96 | ||||
| 2025-07-17 | 13F | Asio Capital, LLC | 259 653 | 4,00 | 11 697 | 3,66 | ||||
| 2025-08-14 | 13F | Shepherd Kaplan Krochuk, Llc | 94 966 | 32,57 | 4 278 | 32,16 | ||||
| 2025-08-12 | 13F | One Charles Private Wealth Services, LLC | 7 897 | 356 | ||||||
| 2025-07-31 | 13F | Sage Mountain Advisors LLC | 391 173 | 12,35 | 17 622 | 11,98 | ||||
| 2025-08-14 | 13F | Fmr Llc | 0 | −100,00 | 0 | |||||
| 2025-08-11 | 13F | SFI Advisors, LLC | 0 | −100,00 | 0 | |||||
| 2025-08-13 | 13F | Northwestern Mutual Wealth Management Co | 66 | −67,65 | 3 | −77,78 | ||||
| 2025-08-08 | 13F | Avantax Advisory Services, Inc. | 6 354 | −14,76 | 286 | −14,88 | ||||
| 2025-04-15 | 13F | Fifth Third Bancorp | 0 | −100,00 | 0 | |||||
| 2025-07-03 | 13F | Arvest Investments, Inc. | 637 942 | −0,68 | 28 739 | −1,01 | ||||
| 2025-07-31 | 13F | United Community Bank | 6 841 | −1,86 | 308 | −2,22 | ||||
| 2025-08-19 | 13F | Anchor Investment Management, LLC | 200 | 9 | ||||||
| 2025-07-22 | 13F | Capital Advisors Inc/ok | 1 084 428 | 0,58 | 48 854 | 0,25 | ||||
| 2025-08-01 | 13F | Envestnet Asset Management Inc | 2 510 104 | 21,26 | 113 080 | 20,85 | ||||
| 2025-08-12 | 13F | LPL Financial LLC | 1 290 994 | 28,47 | 58 159 | 28,05 | ||||
| 2025-07-16 | 13F | Colton Groome Financial Advisors, Llc | 0 | −100,00 | 0 | |||||
| 2025-08-07 | 13F | Aspen Wealth Strategies, LLC | 16 320 | −1,68 | 735 | −2,00 | ||||
| 2025-07-25 | 13F | SPC Financial, Inc. | 810 320 | 0,70 | 36 505 | 0,37 | ||||
| 2025-07-10 | 13F | Wealth Enhancement Advisory Services, Llc | 148 764 | 107,10 | 6 656 | 105,02 | ||||
| 2025-07-21 | 13F | Triad Wealth Partners, LLC | 6 716 | −55,15 | 303 | −55,33 | ||||
| 2025-08-12 | 13F | TCTC Holdings, LLC | 3 901 | 0,00 | 176 | −0,57 | ||||
| 2025-08-01 | 13F | Mendel Money Management | 62 004 | −2,79 | 2 793 | −3,12 | ||||
| 2025-08-08 | 13F | Pnc Financial Services Group, Inc. | 60 742 | −7,64 | 2 736 | −7,94 | ||||
| 2025-07-24 | 13F | IFP Advisors, Inc | 2 196 | −26,85 | 99 | −27,41 | ||||
| 2025-08-13 | 13F | Greenwich Wealth Management LLC | 28 606 | −57,88 | 1 | −66,67 | ||||
| 2025-08-08 | 13F | Cetera Investment Advisers | 568 642 | 40,17 | 25 617 | 39,71 | ||||
| 2025-08-05 | 13F | NewSquare Capital LLC | 340 | 0,00 | 15 | 0,00 | ||||
| 2025-08-12 | 13F | Advisors Asset Management, Inc. | 18 055 | 5,83 | 813 | 5,45 | ||||
| 2025-08-27 | 13F/A | Brinker Capital Investments, LLC | 76 106 | 87,77 | 3 429 | 87,12 |