Grundläggande statistik
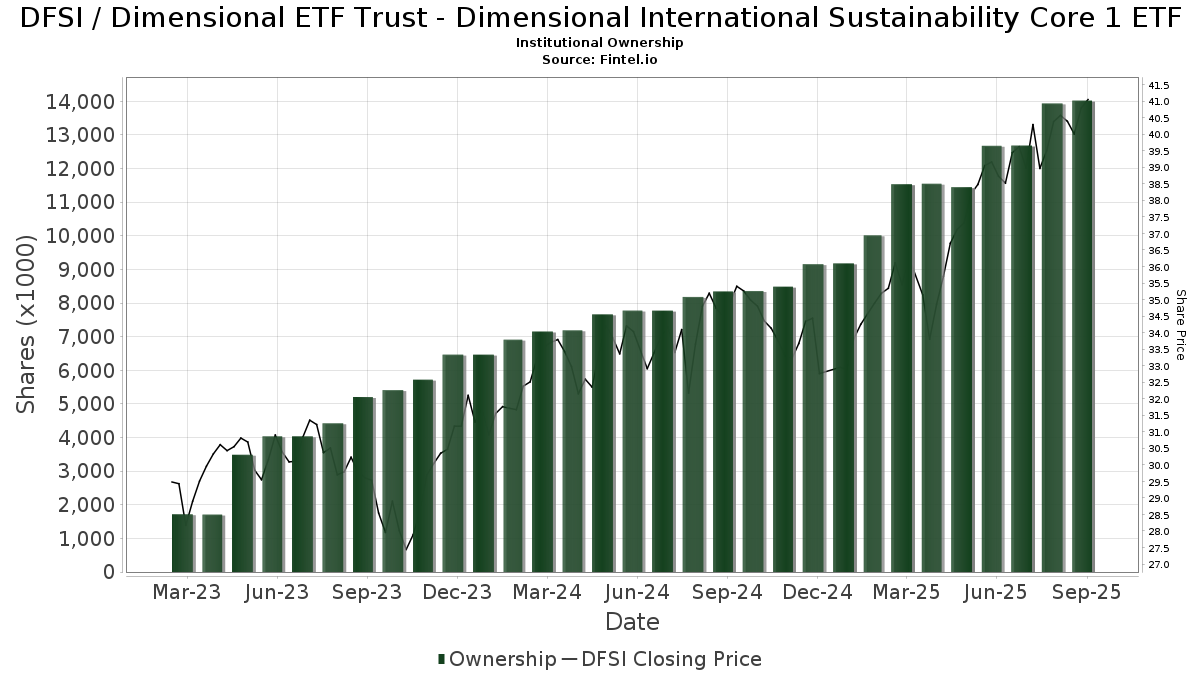
| Institutionella ägare | 194 total, 194 long only, 0 short only, 0 long/short - change of 7,78% MRQ |
| Genomsnittlig portföljallokering | 0.5156 % - change of 3,88% MRQ |
| Institutionella aktier (lång) | 14 021 596 (ex 13D/G) - change of 1,34MM shares 10,54% MRQ |
| Institutionellt värde (lång) | $ 535 803 USD ($1000) |
Institutionellt ägande och aktieägare
Dimensional ETF Trust - Dimensional International Sustainability Core 1 ETF (US:DFSI) har 194 Institutionella ägare och aktieägare som har lämnat in 13D/G- eller 13F-formulär till Securities Exchange Commission (SEC). Dessa institut innehar totalt 14,021,596 aktier. Största aktieägare inkluderar Colony Group, LLC, Quantum Financial Advisors, LLC, Maseco Llp, Awm Capital, Llc, Francis Financial, Inc., Vista Wealth Management Group, LLC, Abacus Wealth Partners, LLC, LongView Asset Management LLC, Retirement Solution Inc., and Pathstone Holdings, LLC .
Dimensional ETF Trust - Dimensional International Sustainability Core 1 ETF (ARCA:DFSI) Institutionell ägarstruktur visar institutioners och fonders nuvarande positioner i företaget, samt de senaste förändringarna i positionernas storlek. Större aktieägare kan vara enskilda investerare, fonder, hedgefonder eller institutioner. Bilaga 13D visar att investeraren äger (eller ägde) mer än 5% av företaget och avser (eller avsåg) att aktivt eftersträva en förändring av affärsstrategin. Schedule 13G indikerar en passiv investering på över 5%.
The share price as of September 10, 2025 is 40,79 / share. Previously, on September 11, 2024, the share price was 34,49 / share. This represents an increase of 18,27% over that period.
Fondsentimentets poäng
Fondsentimentet poängen(fka Ägarackumulation-poäng) visar vilka aktier som är mest köpta av fonder. Det är resultatet av en sofistikerad kvantitativ flerfaktormodell som identifierar företag med de högsta nivåerna av institutionell ackumulering. Poängsättningsmodellen använder en kombination av den totala ökningen av redovisade ägare, förändringarna i portföljallokeringarna för dessa ägare och andra mått. Siffran sträcker sig från 0 till 100, där högre siffror indikerar en högre nivå av ackumulering i förhållande till sina konkurrenter, och 50 är genomsnittet.
Uppdateringsfrekvens: Dagligen
Se Ownership Explorer, som innehåller en lista över de högst rankade företagen.
Institutionell sälj/köp-kvot
Förutom att rapportera vanliga eget kapital- och skuldemissioner måste institutioner med mer än 100MM tillgångar under förvaltning också avslöja sina innehav av sälj- och köpoptioner. Eftersom säljoptioner i allmänhet indikerar ett negativt sentiment och köpoptioner indikerar ett positivt sentiment, kan vi få en uppfattning om det övergripande institutionella sentimentet genom att plotta förhållandet mellan säljoptioner och köpoptioner. Diagrammet till höger visar det historiska förhållandet mellan sälj- och köpoptioner för detta instrument.
Genom att använda sälj/köp-kvoten som en indikator på aktieägarnas sentiment undviker man en av de största bristerna med att använda det totala institutionella ägandet, nämligen att en betydande del av de förvaltade tillgångarna investeras passivt för att följa index. Passivt förvaltade fonder köper vanligtvis inte optioner, så indikatorn för sälj/köp-kvoten ger en bättre bild av stämningen i aktivt förvaltade fonder.
13F- och NPORT-arkiveringar
Detaljer om 13F-arkiveringar är gratis. Detaljer om NP-arkiveringar kräver ett premiummedlemskap. Gröna rader indikerar nya positioner. Röda rader indikerar stängda positioner. Klicka på länk symbolen för att se hela transaktionshistoriken.
Uppgradera
för att låsa upp premiumdata och exportera till Excel ![]() .
.
| Fil Datum | Källa | Investerare | Typ | Genomsnittligt pris (beräknat) |
Aktier | Δ Aktier (%) |
Rapporterat värde (1000 USD) |
Δ Värde (%) |
Portföljallokering (%) |
|
|---|---|---|---|---|---|---|---|---|---|---|
| 2025-08-14 | 13F | EP Wealth Advisors, Inc. | 14 177 | −40,18 | 559 | −32,45 | ||||
| 2025-08-07 | 13F | Samalin Investment Counsel, LLC | 13 248 | −2,89 | 522 | 9,89 | ||||
| 2025-08-15 | 13F | Kestra Advisory Services, LLC | 21 915 | −18,06 | 864 | −7,50 | ||||
| 2025-07-11 | 13F | Farther Finance Advisors, LLC | 26 251 | −1,59 | 1 035 | 10,83 | ||||
| 2025-05-12 | 13F | Fmr Llc | 0 | −100,00 | 0 | |||||
| 2025-08-14 | 13F | Hancock Whitney Corp | 15 774 | 0,00 | 622 | 12,91 | ||||
| 2025-08-07 | 13F | McClarren Financial Advisors, Inc. | 0 | −100,00 | 0 | |||||
| 2025-07-11 | 13F | Quantum Financial Advisors, LLC | 874 253 | −5,70 | 34 454 | 6,52 | ||||
| 2025-07-15 | 13F | Level Financial Advisors, Inc. | 30 226 | 12,48 | 1 191 | 27,11 | ||||
| 2025-08-01 | 13F | Envestnet Asset Management Inc | 13 336 | 99,19 | 526 | 125,32 | ||||
| 2025-07-29 | 13F | Monument Group Wealth Advisors, LLC | 6 634 | 0,00 | 261 | 12,99 | ||||
| 2025-07-08 | 13F | Henrickson Nauta Wealth Advisors, Inc. | 43 886 | 2,18 | 1 730 | 20,49 | ||||
| 2025-07-11 | 13F | Wolfstich Capital, LLC | 0 | −100,00 | 0 | |||||
| 2025-07-31 | 13F | Brighton Jones Llc | 70 677 | 4,76 | 2 785 | 18,36 | ||||
| 2025-07-25 | 13F | Investment Advisory Group, LLC | 12 274 | 0,00 | 484 | 12,85 | ||||
| 2025-07-29 | 13F | Flagstone Financial Management | 13 073 | 30,03 | 515 | 47,14 | ||||
| 2025-07-17 | 13F | XY Planning Network, Inc. | 6 045 | 238 | ||||||
| 2025-08-06 | 13F | Robinson Smith Wealth Advisors Llc | 5 856 | 231 | ||||||
| 2025-08-07 | 13F | Fund Evaluation Group, LLC | 13 534 | 533 | ||||||
| 2025-08-15 | 13F | CI Private Wealth, LLC | 74 940 | −48,50 | 2 953 | −41,82 | ||||
| 2025-08-05 | 13F | Bridgewater Advisors Inc. | 11 929 | 24,35 | 469 | 33,24 | ||||
| 2025-04-11 | 13F | First Affirmative Financial Network | 6 181 | 216 | ||||||
| 2025-08-07 | 13F | Nwam Llc | 37 267 | −1,43 | 1 469 | 11,30 | ||||
| 2025-08-12 | 13F | CIBC Private Wealth Group, LLC | 4 | 0 | ||||||
| 2025-07-22 | 13F | Awm Capital, Llc | 784 487 | −27,94 | 30 917 | −18,61 | ||||
| 2025-08-08 | 13F | Truepoint, Inc. | 66 767 | −13,20 | 2 631 | −1,94 | ||||
| 2025-07-23 | 13F | Quarry Hill Advisors, Llc | 93 647 | −4,48 | 3 691 | 7,89 | ||||
| 2025-07-16 | 13F | Strategic Investment Solutions, Inc. /IL | 103 | 0,98 | 4 | 0,00 | ||||
| 2025-08-12 | 13F | Proequities, Inc. | 0 | 0 | ||||||
| 2025-07-16 | 13F | Jentner Corp | 24 998 | 0,00 | 985 | 12,96 | ||||
| 2025-08-12 | 13F | McGrath & Associates, Inc. | 12 289 | 1,78 | 484 | 14,96 | ||||
| 2025-08-14 | 13F | Jane Street Group, Llc | 180 007 | 17,93 | 7 094 | 33,22 | ||||
| 2025-08-08 | 13F | Hartland & Co., LLC | 2 878 | 0,00 | 113 | 13,00 | ||||
| 2025-08-12 | 13F | Jpmorgan Chase & Co | 3 303 | 9,52 | 130 | 23,81 | ||||
| 2025-08-13 | 13F | Cerity Partners LLC | 44 471 | 1 781 | ||||||
| 2025-08-06 | 13F | Modera Wealth Management, LLC | 21 011 | 0,19 | 828 | 13,27 | ||||
| 2025-07-25 | 13F | Sequoia Financial Advisors, LLC | 29 141 | −6,62 | 1 148 | 5,51 | ||||
| 2025-07-15 | 13F | Family Wealth Partners, Llc | 6 709 | −4,06 | 264 | 8,64 | ||||
| 2025-07-30 | 13F | Rehmann Capital Advisory Group | 9 308 | 0,00 | 367 | 12,96 | ||||
| 2025-08-12 | 13F | LPL Financial LLC | 29 482 | 17,89 | 1 162 | 33,14 | ||||
| 2025-08-08 | 13F | Francis Financial, Inc. | 694 253 | 3,03 | 27 360 | 16,38 | ||||
| 2025-08-11 | 13F | HighTower Advisors, LLC | 12 755 | 18,60 | 503 | 33,87 | ||||
| 2025-08-15 | 13F | Morgan Stanley | 295 | 29 400,00 | 12 | |||||
| 2025-08-14 | 13F | Monograph Wealth Advisors, Llc | 0 | −100,00 | 0 | |||||
| 2025-08-14 | 13F | Envision Financial Planning, LLC | 8 666 | 22,13 | 342 | 38,06 | ||||
| 2025-08-08 | 13F | Tortoise Investment Management, LLC | 2 420 | 0,00 | 95 | 13,10 | ||||
| 2025-08-01 | 13F | Equita Financial Network, Inc. | 31 854 | 104,51 | 1 255 | 131,12 | ||||
| 2025-07-23 | 13F | Asset Planning Corporation | 7 399 | −79,31 | 292 | −76,66 | ||||
| 2025-07-21 | 13F | Trellis Wealth Advisors LLC | 50 684 | 1,11 | 1 997 | 14,18 | ||||
| 2025-04-17 | 13F | Vista Wealth Management Group, LLC | 566 520 | −3,13 | 19 766 | 2,88 | ||||
| 2025-08-15 | 13F | North Ridge Wealth Advisors, Inc. | 14 010 | −16,58 | 552 | −5,64 | ||||
| 2025-07-15 | 13F | Maseco Llp | 843 506 | 33 238 | ||||||
| 2025-08-11 | 13F | Morling Financial Advisors, LLC | 10 812 | 0,29 | 426 | 13,30 | ||||
| 2025-07-31 | 13F | Orion Capital Management LLC | 6 880 | −4,76 | 271 | 7,54 | ||||
| 2025-08-11 | 13F | Aptus Capital Advisors, LLC | 193 | 0,00 | 8 | 16,67 | ||||
| 2025-07-29 | 13F | Schubert & Co | 24 904 | 981 | ||||||
| 2025-08-11 | 13F | von Borstel & Associates, Inc. | 13 041 | −10,68 | 1 | |||||
| 2025-08-01 | 13F | Penobscot Wealth Management | 7 527 | 17,15 | 297 | 32,14 | ||||
| 2025-07-21 | 13F | Creative Capital Management Investments LLC | 25 382 | 0,00 | 1 000 | 12,99 | ||||
| 2025-07-08 | 13F | Apella Capital, LLC | 154 343 | 6,36 | 6 036 | 23,08 | ||||
| 2025-07-18 | 13F | Citrine Capital LLC | 322 948 | 2,50 | 12 727 | 15,78 | ||||
| 2025-08-14 | 13F | Raymond James Financial Inc | 4 517 | −75,23 | 178 | −72,01 | ||||
| 2025-07-30 | 13F | Blume Capital Management, Inc. | 150 | 0,00 | 6 | 0,00 | ||||
| 2025-07-16 | 13F | TCI Wealth Advisors, Inc. | 30 743 | 34,53 | 1 212 | 51,94 | ||||
| 2025-08-07 | 13F | Retirement Solution Inc. | 373 206 | −1,07 | 14 708 | 11,75 | ||||
| 2025-08-05 | 13F | Cherry Tree Wealth Management, LLC | 713 | 0,00 | 28 | 16,67 | ||||
| 2025-08-13 | 13F | Beacon Pointe Advisors, LLC | 6 607 | −36,53 | 260 | −28,37 | ||||
| 2025-04-14 | 13F | Greenspring Advisors, LLC | 113 563 | −44,44 | 3 962 | −40,99 | ||||
| 2025-08-06 | 13F | Commonwealth Equity Services, Llc | 45 754 | 6,15 | 2 | 0,00 | ||||
| 2025-07-14 | 13F | Foster Group, Inc. | 5 937 | 0,00 | 234 | 12,56 | ||||
| 2025-07-24 | 13F | Jfs Wealth Advisors, Llc | 1 181 | −16,54 | 47 | −6,12 | ||||
| 2025-08-14 | 13F | Pine Harbor Wealth Management, LLC | 6 364 | 0,32 | 251 | 13,12 | ||||
| 2025-08-14 | 13F | Citadel Advisors Llc | 0 | −100,00 | 0 | |||||
| 2025-08-13 | 13F | United Wealth Management, LLC | 14 898 | −0,88 | 587 | 12,02 | ||||
| 2025-07-14 | 13F | UMA Financial Services, Inc. | 9 239 | −9,95 | 364 | 1,96 | ||||
| 2025-08-14 | 13F | Cardiff Park Advisors, Llc | 4 479 | 1,31 | 176 | 14,29 | ||||
| 2025-08-07 | 13F | Cahill Financial Advisors Inc | 31 045 | 1,26 | 1 223 | 14,41 | ||||
| 2025-08-04 | 13F | Bay Colony Advisory Group, Inc d/b/a Bay Colony Advisors | 7 700 | 0,00 | 303 | 11,81 | ||||
| 2025-07-29 | 13F | Chicago Partners Investment Group LLC | 20 033 | 0,01 | 807 | 8,61 | ||||
| 2025-05-15 | 13F | Wealth Management Strategies, Inc. | 17 370 | 141,59 | 606 | 30 200,00 | ||||
| 2025-07-18 | 13F | Heritage Financial Services, LLC | 173 376 | 0,69 | 6 833 | 13,73 | ||||
| 2025-07-14 | 13F | AdvisorNet Financial, Inc | 16 594 | 27,77 | 654 | 44,15 | ||||
| 2025-08-12 | 13F | Pathstone Holdings, LLC | 371 380 | 35,48 | 14 636 | 53,00 | ||||
| 2025-08-14 | 13F | C M Bidwell & Associates Ltd | 1 300 | 0,00 | 51 | 13,33 | ||||
| 2025-08-14 | 13F | Colony Group, LLC | 1 152 210 | 85,55 | 45 409 | 109,58 | ||||
| 2025-07-21 | 13F | Keystone Financial Group, Inc. | 594 | 1,19 | 23 | 9,52 | ||||
| 2025-08-11 | 13F | Foundation Wealth Management, LLC\PA | 13 780 | 0,53 | 543 | 13,60 | ||||
| 2025-08-12 | 13F | Triune Financial Partners, LLC | 113 442 | 4 471 | ||||||
| 2025-08-07 | 13F | Resources Investment Advisors, LLC. | 115 256 | −4,90 | 4 542 | 7,43 | ||||
| 2025-05-15 | 13F | CAPROCK Group, Inc. | 6 435 | 0,00 | 225 | 6,16 | ||||
| 2025-08-06 | 13F | Geometric Wealth Advisors | 11 208 | −16,94 | 442 | −6,17 | ||||
| 2025-07-30 | 13F | Mills Wealth Advisors LLC | 6 671 | −0,40 | 263 | 12,45 | ||||
| 2025-08-01 | 13F | Fort Vancouver Investment Management, LLC | 701 | 0,00 | 28 | 12,50 | ||||
| 2025-07-25 | 13F | LRI Investments, LLC | 3 077 | 0,00 | 121 | 13,08 | ||||
| 2025-08-14 | 13F | Balanced Rock Investment Advisor | 206 030 | 2,47 | 8 120 | 15,75 | ||||
| 2025-07-18 | 13F | Pure Financial Advisors, Inc. | 106 761 | 45,81 | 4 207 | 64,72 | ||||
| 2025-08-11 | 13F | Frank, Rimerman Advisors LLC | 8 316 | 0,00 | 328 | 12,76 | ||||
| 2025-07-24 | 13F | Financial Connections Group, Inc. | 19 688 | 62,52 | 1 | |||||
| 2025-08-11 | 13F | Private Advisor Group, LLC | 12 536 | 1,78 | 494 | 15,15 | ||||
| 2025-08-05 | 13F | Bank Of Montreal /can/ | 4 140 | 201,31 | 163 | 246,81 | ||||
| 2025-08-01 | 13F | Red Lighthouse Investment Management, Llc | 3 273 | 13,69 | 129 | 33,33 | ||||
| 2025-08-14 | 13F | Royal Bank Of Canada | 306 | 84,34 | 12 | 100,00 | ||||
| 2025-08-14 | 13F | Mml Investors Services, Llc | 45 064 | 2 | ||||||
| 2025-08-08 | 13F | RAM Investment Partners, LLC | 114 575 | 12,71 | 4 515 | 27,33 | ||||
| 2025-08-14 | 13F | Bank Of America Corp /de/ | 1 615 | −13,27 | 64 | −1,56 | ||||
| 2025-08-11 | 13F | Root Financial Partners, LLC | 10 710 | 0,85 | 422 | 14,05 | ||||
| 2025-08-14 | 13F | Freedom Financial Partners LLC | 11 773 | 21,13 | 464 | 36,58 | ||||
| 2025-08-26 | 13F/A | Thrivent Financial For Lutherans | 134 529 | 5 | ||||||
| 2025-08-14 | 13F | Smartleaf Asset Management LLC | 1 391 | 55 | ||||||
| 2025-05-13 | 13F | Brooklyn FI, LLC | 0 | −100,00 | 0 | −100,00 | ||||
| 2025-07-28 | 13F | Revolve Wealth Partners, LLC | 64 864 | −1,56 | 2 556 | 11,23 | ||||
| 2025-08-14 | 13F | GWM Advisors LLC | 57 784 | −2,27 | 2 277 | 10,43 | ||||
| 2025-07-31 | 13F | Aspen Capital Management, LLC | 81 859 | 80,16 | 3 226 | 103,53 | ||||
| 2025-07-10 | 13F | Wealth Enhancement Advisory Services, Llc | 144 049 | −0,74 | 5 682 | 12,23 | ||||
| 2025-08-04 | 13F | Syverson Strege & Co | 46 925 | −1,80 | 1 849 | 10,92 | ||||
| 2025-07-22 | 13F | Simplicity Wealth,LLC | 0 | −100,00 | 0 | |||||
| 2025-07-31 | 13F | Buckingham Strategic Partners | 104 102 | 0,97 | 4 103 | 14,04 | ||||
| 2025-07-23 | 13F | First Financial Group Corp | 10 823 | 5,76 | 427 | 19,33 | ||||
| 2025-08-07 | 13F | Allworth Financial LP | 7 097 | 0,60 | 280 | 9,41 | ||||
| 2025-08-14 | 13F | Mariner, LLC | 9 558 | 0,00 | 377 | 12,91 | ||||
| 2025-08-11 | 13F | Babb Wealth Advisors LLC | 20 208 | −1,74 | 796 | 11,02 | ||||
| 2025-07-15 | 13F | Cordant, Inc. | 20 838 | −0,77 | 821 | 12,16 | ||||
| 2025-07-16 | 13F | Signature Resources Capital Management, LLC | 1 174 | 11,92 | 46 | 27,78 | ||||
| 2025-08-11 | 13F | WPWealth LLP | 14 943 | −5,29 | 589 | 6,91 | ||||
| 2025-08-11 | 13F | Compass Capital Corp /ma/ /adv | 14 211 | −4,47 | 564 | 8,88 | ||||
| 2025-07-25 | 13F | Wealth Architects, LLC | 111 411 | 18,40 | 4 391 | 33,72 | ||||
| 2025-08-07 | 13F | Prime Buchholz LLC | 6 814 | 269 | ||||||
| 2025-08-07 | 13F | Addison Advisors LLC | 84 340 | −2,66 | 3 324 | 9,92 | ||||
| 2025-04-21 | 13F | Nelson, Van Denburg & Campbell Wealth Management Group, LLC | 0 | −100,00 | 0 | |||||
| 2025-07-17 | 13F | Willow Creek Wealth Management Inc. | 254 144 | 5,82 | 10 016 | 19,53 | ||||
| 2025-09-09 | 13F | Cambridge Financial Group, LLC | 56 397 | 18,30 | 2 223 | 33,29 | ||||
| 2025-08-12 | 13F | Cook Wealth Management Group Llc | 0 | −100,00 | 0 | |||||
| 2025-08-14 | 13F | Warren Averett Asset Management, LLC | 12 624 | 0,00 | 498 | 12,95 | ||||
| 2025-08-14 | 13F | UBS Group AG | 305 | 301,32 | 12 | 500,00 | ||||
| 2025-07-03 | 13F | Fiduciary Financial Group, Llc | 17 455 | 15,58 | 687 | 36,11 | ||||
| 2025-08-04 | 13F | Hutchinson Capital Management/ca | 45 736 | 0,00 | 1 802 | 12,98 | ||||
| 2025-05-02 | 13F | MB Generational Wealth, LLC | 35 003 | −0,45 | 1 221 | 5,71 | ||||
| 2025-07-14 | 13F | Northland Capital Management LLC | 44 403 | −8,29 | 1 750 | 3,55 | ||||
| 2025-07-28 | 13F | Delap Wealth Advisory, Llc | 10 255 | −42,58 | 404 | −35,15 | ||||
| 2025-07-24 | 13F | Wealth Advisors Northwest LLC | 13 475 | 3,76 | 531 | 17,22 | ||||
| 2025-08-07 | 13F | Parkside Financial Bank & Trust | 41 239 | 1,29 | 1 625 | 14,44 | ||||
| 2025-07-31 | 13F | LongView Asset Management LLC | 429 761 | 0,96 | 16 937 | 14,04 | ||||
| 2025-08-06 | 13F | Savant Capital, LLC | 76 705 | −5,83 | 3 023 | 6,33 | ||||
| 2025-08-14 | 13F | Goldman Sachs Group Inc | 0 | −100,00 | 0 | |||||
| 2025-08-11 | 13F | Rockbridge Investment Management, LCC | 41 888 | −8,62 | 1 651 | 3,19 | ||||
| 2025-07-09 | 13F | Graves-Light Private Wealth Management, Inc. | 5 996 | 0,00 | 236 | 12,92 | ||||
| 2025-07-17 | 13F | Vermillion Wealth Management, Inc. | 8 375 | 10,12 | 330 | 24,53 | ||||
| 2025-07-22 | 13F | Clarius Group, LLC | 6 604 | 4,59 | 260 | 18,18 | ||||
| 2025-07-25 | 13F | Acorn Creek Capital Llc | 6 650 | 0,99 | 262 | 14,41 | ||||
| 2025-08-15 | 13F | Keel Point, LLC | 11 560 | 0,00 | 456 | 12,90 | ||||
| 2025-07-14 | 13F | Abacus Wealth Partners, LLC | 560 620 | 5,80 | 22 094 | 19,51 | ||||
| 2025-07-28 | 13F | Morris Financial Concepts, Inc. | 5 526 | 0,00 | 218 | 13,02 | ||||
| 2025-07-25 | 13F | Ruedi Wealth Management, Inc. | 7 341 | 1,27 | 289 | 14,68 | ||||
| 2025-08-13 | 13F | Parkworth Wealth Management, Inc. | 1 613 | 23,60 | 64 | 40,00 | ||||
| 2025-08-14 | 13F | Old Mission Capital Llc | 54 639 | −70,27 | 2 153 | −66,43 | ||||
| 2025-07-25 | 13F | RHS Financial, LLC | 5 867 | −46,45 | 231 | −39,53 | ||||
| 2025-08-05 | 13F | Allodium Investment Consultants, LLC | 138 880 | 0,17 | 5 473 | 13,15 | ||||
| 2025-08-12 | 13F | Passive Capital Management, LLC. | 10 700 | −18,32 | 421 | −8,10 | ||||
| 2025-07-09 | 13F | Archer Investment Management, LLC | 74 824 | −15,36 | 2 949 | −4,41 | ||||
| 2025-07-16 | 13F | Blue Oak Capital, LLC | 7 885 | 311 | ||||||
| 2025-08-13 | 13F | Momentous Wealth Management, Inc. | 77 359 | 9,53 | 3 049 | 23,70 | ||||
| 2025-07-17 | 13F | Elser Financial Planning, Inc | 229 002 | 8 899 | ||||||
| 2025-08-13 | 13F | Brown Advisory Inc | 5 588 | 220 | ||||||
| 2025-07-31 | 13F | Glass Jacobson Investment Advisors llc | 632 | 1,28 | 25 | 20,00 | ||||
| 2025-07-31 | 13F | Planning Center, Inc. | 209 354 | 0,58 | 8 251 | 13,61 | ||||
| 2025-07-22 | 13F | Red Tortoise LLC | 6 203 | 0,00 | 244 | 12,96 | ||||
| 2025-08-08 | 13F | Schwarz Dygos Wheeler Investment Advisors Llc | 21 068 | 0,00 | 830 | 12,93 | ||||
| 2025-05-01 | 13F | Diversify Wealth Management, Llc | 0 | −100,00 | 0 | |||||
| 2025-07-10 | 13F | Waypoint Wealth Partners Inc. | 77 558 | 37,96 | 3 057 | 55,84 | ||||
| 2025-07-25 | 13F | Joel Adams & Associates, Inc. | 7 308 | −1,63 | 288 | 11,20 | ||||
| 2025-07-31 | 13F | Curio Wealth, Llc | 2 860 | 71 400,00 | 113 | 25,84 | ||||
| 2025-07-22 | 13F | Hill Island Financial Llc | 185 505 | 7 311 | ||||||
| 2025-07-17 | 13F | DiNuzzo Private Wealth, Inc. | 29 986 | 0,39 | 1 182 | 13,34 | ||||
| 2025-08-14 | 13F | Betterment LLC | 63 975 | 22,55 | 3 | 100,00 | ||||
| 2025-07-31 | 13F | Cardinal Point Capital Management, ULC | 69 135 | −1,17 | 2 725 | 11,64 | ||||
| 2025-08-05 | 13F | Integrity Wealth Solutions LLC | 5 746 | 226 | ||||||
| 2025-08-06 | 13F | True Wealth Design, LLC | 8 184 | 112,68 | 323 | 140,30 | ||||
| 2025-07-14 | 13F | Sellwood Investment Partners LLC | 14 431 | 569 | ||||||
| 2025-07-30 | 13F | Forum Financial Management, LP | 289 109 | −3,05 | 11 394 | 9,51 | ||||
| 2025-08-14 | 13F | McIlrath & Eck, LLC | 129 | 0,00 | 5 | 25,00 | ||||
| 2025-08-12 | 13F | Martin Worley Group | 58 836 | −13,65 | 2 319 | −2,48 | ||||
| 2025-07-15 | 13F | Accurate Wealth Management, LLC | 5 829 | 231 | ||||||
| 2025-07-16 | 13F | Five Oceans Advisors | 226 384 | 47,29 | 8 922 | 66,37 | ||||
| 2025-08-08 | 13F | Glassman Wealth Services | 9 110 | 126,50 | 359 | 156,43 | ||||
| 2025-07-08 | 13F | Zrc Wealth Management, Llc | 10 892 | 429 | ||||||
| 2025-09-04 | 13F/A | Advisor Group Holdings, Inc. | 9 409 | 12,76 | 371 | 27,15 | ||||
| 2025-08-08 | 13F | Altiora Financial Group, LLC | 9 100 | 0,00 | 359 | 12,93 | ||||
| 2025-07-07 | 13F | New Capital Management LP | 185 790 | 4,10 | 7 322 | 17,59 | ||||
| 2025-07-16 | 13F | Perigon Wealth Management, LLC | 90 282 | 1,91 | 3 558 | 15,15 | ||||
| 2025-07-18 | 13F | Bridge Generations Wealth Management Llc | 10 976 | −0,01 | 433 | 13,09 | ||||
| 2025-07-24 | 13F | IFP Advisors, Inc | 523 | 0,19 | 21 | 11,11 | ||||
| 2025-08-19 | 13F | Asset Dedication, LLC | 112 255 | 0,70 | 4 424 | 13,73 | ||||
| 2025-08-06 | 13F | Longview Financial Advisors LLC | 24 716 | 19,79 | 974 | 35,47 | ||||
| 2025-07-10 | 13F | Shira Ridge Wealth Management | 18 974 | 0,00 | 748 | 12,84 | ||||
| 2025-08-14 | 13F | Premier Financial Group | 37 012 | 1 485 | ||||||
| 2025-07-14 | 13F | BetterWealth, LLC | 27 298 | −1,14 | 1 076 | 11,63 | ||||
| 2025-07-03 | 13F | Garde Capital, Inc. | 80 399 | 11,99 | 3 169 | 26,52 | ||||
| 2025-07-24 | 13F | Grand Wealth Management, Llc | 14 866 | −1,24 | 586 | 11,43 | ||||
| 2025-07-31 | 13F | Cambridge Investment Research Advisors, Inc. | 10 728 | 0 | ||||||
| 2025-08-13 | 13F | RW Investment Management LLC | 81 479 | −0,37 | 3 211 | 12,55 | ||||
| 2025-08-14 | 13F | Mercer Global Advisors Inc /adv | 24 935 | 141,24 | 983 | 172,78 | ||||
| 2025-07-18 | 13F | Meritas Wealth Management, LLC | 9 924 | 0,00 | 391 | 13,01 | ||||
| 2025-08-12 | 13F | Coston, McIsaac & Partners | 3 305 | 0,00 | 0 | |||||
| 2025-08-11 | 13F | Wealthspire Advisors, LLC | 63 082 | 0,25 | 2 486 | 13,26 | ||||
| 2025-07-30 | 13F | EnRich Financial Partners LLC | 11 884 | 38,91 | 468 | 57,05 | ||||
| 2025-07-18 | 13F | Tanager Wealth Management LLP | 14 303 | 7,15 | 564 | 21,08 |