Grundläggande statistik
| Institutionella ägare | 249 total, 249 long only, 0 short only, 0 long/short - change of 10,67% MRQ |
| Genomsnittlig portföljallokering | 1.1265 % - change of −19,11% MRQ |
| Institutionella aktier (lång) | 11 775 883 (ex 13D/G) - change of −0,65MM shares −5,22% MRQ |
| Institutionellt värde (lång) | $ 1 191 885 USD ($1000) |
Institutionellt ägande och aktieägare
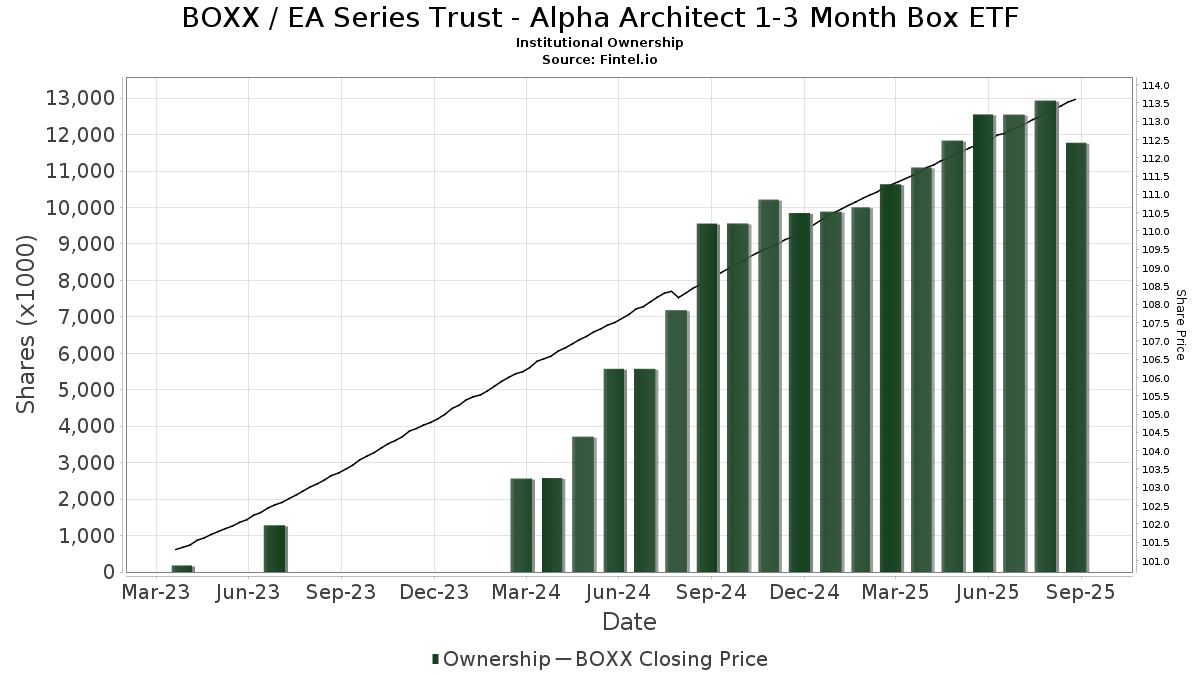
EA Series Trust - Alpha Architect 1-3 Month Box ETF (US:BOXX) har 249 Institutionella ägare och aktieägare som har lämnat in 13D/G- eller 13F-formulär till Securities Exchange Commission (SEC). Dessa institut innehar totalt 11,775,883 aktier. Största aktieägare inkluderar Wealth Enhancement Advisory Services, Llc, Rockefeller Capital Management L.P., Cambridge Investment Research Advisors, Inc., Empowered Funds, LLC, True Wealth Design, LLC, ADAR1 Capital Management, LLC, Insight Advisors, LLC/ PA, Ethos Financial Group, LLC, Bravias Capital Group, LLC, and Pennington Partners & Co., Llc .
EA Series Trust - Alpha Architect 1-3 Month Box ETF (BATS:BOXX) Institutionell ägarstruktur visar institutioners och fonders nuvarande positioner i företaget, samt de senaste förändringarna i positionernas storlek. Större aktieägare kan vara enskilda investerare, fonder, hedgefonder eller institutioner. Bilaga 13D visar att investeraren äger (eller ägde) mer än 5% av företaget och avser (eller avsåg) att aktivt eftersträva en förändring av affärsstrategin. Schedule 13G indikerar en passiv investering på över 5%.
The share price as of September 19, 2025 is 113,72 / share. Previously, on September 23, 2024, the share price was 108,82 / share. This represents an increase of 4,50% over that period.
Fondsentimentets poäng
Fondsentimentet poängen(fka Ägarackumulation-poäng) visar vilka aktier som är mest köpta av fonder. Det är resultatet av en sofistikerad kvantitativ flerfaktormodell som identifierar företag med de högsta nivåerna av institutionell ackumulering. Poängsättningsmodellen använder en kombination av den totala ökningen av redovisade ägare, förändringarna i portföljallokeringarna för dessa ägare och andra mått. Siffran sträcker sig från 0 till 100, där högre siffror indikerar en högre nivå av ackumulering i förhållande till sina konkurrenter, och 50 är genomsnittet.
Uppdateringsfrekvens: Dagligen
Se Ownership Explorer, som innehåller en lista över de högst rankade företagen.
AI+ Ask Fintel’s AI assistant about EA Series Trust - Alpha Architect 1-3 Month Box ETF.
Thinking of good questions…
Institutionell sälj/köp-kvot
Förutom att rapportera vanliga eget kapital- och skuldemissioner måste institutioner med mer än 100MM tillgångar under förvaltning också avslöja sina innehav av sälj- och köpoptioner. Eftersom säljoptioner i allmänhet indikerar ett negativt sentiment och köpoptioner indikerar ett positivt sentiment, kan vi få en uppfattning om det övergripande institutionella sentimentet genom att plotta förhållandet mellan säljoptioner och köpoptioner. Diagrammet till höger visar det historiska förhållandet mellan sälj- och köpoptioner för detta instrument.
Genom att använda sälj/köp-kvoten som en indikator på aktieägarnas sentiment undviker man en av de största bristerna med att använda det totala institutionella ägandet, nämligen att en betydande del av de förvaltade tillgångarna investeras passivt för att följa index. Passivt förvaltade fonder köper vanligtvis inte optioner, så indikatorn för sälj/köp-kvoten ger en bättre bild av stämningen i aktivt förvaltade fonder.
13F- och NPORT-arkiveringar
Detaljer om 13F-arkiveringar är gratis. Detaljer om NP-arkiveringar kräver ett premiummedlemskap. Gröna rader indikerar nya positioner. Röda rader indikerar stängda positioner. Klicka på länk symbolen för att se hela transaktionshistoriken.
Uppgradera
för att låsa upp premiumdata och exportera till Excel ![]() .
.
| Fil Datum | Källa | Investerare | Typ | Genomsnittligt pris (beräknat) |
Aktier | Δ Aktier (%) |
Rapporterat värde (1000 USD) |
Δ Värde (%) |
Portföljallokering (%) |
|
|---|---|---|---|---|---|---|---|---|---|---|
| 2025-08-14 | 13F | Integrated Wealth Concepts LLC | 49 715 | 3,18 | 5 602 | 4,28 | ||||
| 2025-07-30 | 13F | Brookstone Capital Management | 41 554 | 0,66 | 4 682 | 1,74 | ||||
| 2025-08-06 | 13F | Ethos Financial Group, LLC | 271 397 | −16,75 | 30 581 | −14,95 | ||||
| 2025-07-25 | 13F | Commonwealth Financial Services, LLC | 27 976 | −14,52 | 3 152 | −13,60 | ||||
| 2025-07-14 | 13F | Seed Wealth Management, Inc. | 34 105 | 10,57 | 3 843 | 11,75 | ||||
| 2025-07-17 | 13F | XY Planning Network, Inc. | 2 256 | 254 | ||||||
| 2025-08-04 | 13F | Pensionmark Financial Group, Llc | 47 985 | 29,58 | 5 407 | 30,96 | ||||
| 2025-09-12 | 13F/A | Valeo Financial Advisors, LLC | 4 422 | 41,64 | 498 | 43,10 | ||||
| 2025-07-25 | 13F | Wells Financial Advisors INC | 33 | 0,00 | 4 | 0,00 | ||||
| 2025-07-22 | 13F | Wealthcare Advisory Partners LLC | 13 577 | 125,27 | 1 530 | 127,87 | ||||
| 2025-08-28 | 13F/A | Lavaca Capital Llc | 2 723 | 4,77 | 307 | 5,88 | ||||
| 2025-07-11 | 13F | Busey Wealth Management | 9 600 | 0,00 | 1 082 | 1,03 | ||||
| 2025-07-30 | 13F | Green Square Capital Advisors Llc | 8 170 | 0,00 | 921 | 1,10 | ||||
| 2025-08-12 | 13F | Titleist Asset Management, Llc | 206 620 | 23 282 | ||||||
| 2025-04-21 | 13F | Nelson, Van Denburg & Campbell Wealth Management Group, LLC | 0 | −100,00 | 0 | |||||
| 2025-08-07 | 13F | Nwam Llc | 70 734 | 38,03 | 7 996 | 39,94 | ||||
| 2025-08-15 | 13F | Morse Asset Management, Inc | 12 000 | 1 352 | ||||||
| 2025-08-04 | 13F | Simon Quick Advisors, Llc | 11 303 | −61,92 | 1 274 | −61,53 | ||||
| 2025-08-12 | 13F | Richard W. Paul & Associates, LLC | 1 949 | 0,00 | 220 | 0,92 | ||||
| 2025-06-03 | 13F | Invst, LLC | 57 203 | −5,43 | 6 378 | −4,39 | ||||
| 2025-08-14 | 13F/A | Skopos Labs, Inc. | 211 | 24 | ||||||
| 2025-07-23 | 13F | Quarry Hill Advisors, Llc | 44 581 | 20,94 | 5 023 | 22,24 | ||||
| 2025-07-15 | 13F | Well Done, LLC | 17 408 | −33,29 | 1 962 | −31,84 | ||||
| 2025-08-12 | 13F | Integrated Advisors Network LLC | 9 000 | 1 014 | ||||||
| 2025-07-25 | 13F | Atria Wealth Solutions, Inc. | 0 | −100,00 | 0 | |||||
| 2025-08-12 | 13F | DCF Advisers, LLC | 10 000 | 0,00 | 1 127 | 1,08 | ||||
| 2025-07-28 | 13F | Innova Wealth Partners | 67 269 | 6,84 | 7 580 | 7,98 | ||||
| 2025-08-04 | 13F | Atria Investments Llc | 24 035 | 199,50 | 2 708 | 202,91 | ||||
| 2025-08-08 | 13F | Capital Investment Advisory Services, LLC | 6 030 | 180,47 | 679 | 184,10 | ||||
| 2025-08-13 | 13F | Per Stirling Capital Management, LLC. | 2 630 | 0,00 | 296 | 1,02 | ||||
| 2025-04-29 | 13F | Baker Boyer National Bank | 0 | −100,00 | 0 | |||||
| 2025-07-24 | 13F | IFP Advisors, Inc | 2 682 | −42,72 | 302 | −42,03 | ||||
| 2025-07-08 | 13F | GK Wealth Management LLC | 21 695 | 860,81 | 2 445 | 873,71 | ||||
| 2025-08-14 | 13F | Citadel Advisors Llc | 9 314 | −78,18 | 1 050 | −77,96 | ||||
| 2025-07-29 | 13F | Madison Wealth Partners, Inc | 21 952 | 30,84 | 2 474 | 32,25 | ||||
| 2025-07-29 | 13F | Stratos Wealth Advisors, LLC | 2 112 | −19,08 | 238 | −18,56 | ||||
| 2025-08-05 | 13F | Continuum Wealth Advisors, Llc | 9 514 | 10,41 | 1 072 | 11,67 | ||||
| 2025-07-14 | 13F | Golden State Equity Partners | 1 925 | 217 | ||||||
| 2025-08-01 | 13F | Ferguson Shapiro LLC | 83 797 | −2,22 | 9 442 | −1,18 | ||||
| 2025-08-13 | 13F | BlackDiamond Wealth Management Inc. | 18 825 | 10,30 | 2 121 | 10,88 | ||||
| 2025-07-28 | 13F | WealthPlan Investment Management, LLC | 45 065 | −1,20 | 5 078 | −0,16 | ||||
| 2025-08-05 | 13F | Tme Financial, Inc. | 5 248 | −4,15 | 591 | −3,11 | ||||
| 2025-07-28 | 13F | Revolve Wealth Partners, LLC | 0 | −100,00 | 0 | |||||
| 2025-08-11 | 13F | Schiavi & Co LLC | 9 000 | 1 014 | ||||||
| 2025-05-15 | 13F | Two Sigma Securities, Llc | 0 | −100,00 | 0 | |||||
| 2025-08-06 | 13F | Smart Money Group LLC | 11 618 | 18,05 | 1 309 | 19,33 | ||||
| 2025-07-30 | 13F | Forum Financial Management, LP | 3 773 | 0,00 | 425 | 1,19 | ||||
| 2025-07-24 | 13F | Fischer Investment Strategies, Llc | 77 393 | 8 721 | ||||||
| 2025-07-29 | 13F | Stephens Inc /ar/ | 9 405 | 34,26 | 1 060 | 35,77 | ||||
| 2025-08-14 | 13F | Snowden Capital Advisors LLC | 6 491 | 0,00 | 731 | 1,11 | ||||
| 2025-06-27 | NP | TRTY - Cambria Trinity ETF | 9 656 | −7,22 | 1 081 | −6,25 | ||||
| 2025-08-15 | 13F | CI Private Wealth, LLC | 0 | −100,00 | 0 | |||||
| 2025-08-14 | 13F | Valley Financial Group, Inc. | 14 820 | −12,53 | 1 670 | −11,60 | ||||
| 2025-08-18 | 13F | Wolverine Trading, Llc | 6 708 | −75,83 | 756 | −75,59 | ||||
| 2025-07-28 | 13F | Mutual Advisors, LLC | 62 861 | 20,27 | 7 102 | 21,46 | ||||
| 2025-05-09 | 13F | Citizens Financial Group Inc/ri | 0 | −100,00 | 0 | |||||
| 2025-07-22 | 13F | Belpointe Asset Management LLC | 23 252 | 38,05 | 2 620 | 39,58 | ||||
| 2025-07-31 | 13F | Brighton Jones Llc | 12 227 | 0,00 | 1 378 | 1,03 | ||||
| 2025-07-18 | 13F | Magnolia Private Wealth, LLC | 8 914 | −43,13 | 1 004 | −42,53 | ||||
| 2025-08-14 | 13F | Clg Llc | 7 914 | −30,21 | 892 | −29,51 | ||||
| 2025-08-14 | 13F | Stifel Financial Corp | 21 041 | −0,02 | 2 371 | 1,02 | ||||
| 2025-07-31 | 13F | Longview Financial Advisors, Inc. | 8 905 | 141,52 | 1 003 | 144,04 | ||||
| 2025-08-14 | 13F | Goldman Sachs Group Inc | 2 800 | 0,00 | 316 | 0,96 | ||||
| 2025-07-23 | 13F | Vontobel Holding Ltd. | 3 000 | 0,00 | 338 | 1,20 | ||||
| 2025-07-31 | 13F | BIP Wealth, LLC | 4 797 | 0,86 | 541 | 1,89 | ||||
| 2025-05-15 | 13F/A | Orion Portfolio Solutions, LLC | 5 726 | −32,31 | 638 | −31,55 | ||||
| 2025-08-07 | 13F | Kestra Private Wealth Services, Llc | 11 765 | −48,07 | 1 326 | −47,52 | ||||
| 2025-08-26 | 13F/A | Thrivent Financial For Lutherans | 5 153 | 63,12 | 1 | |||||
| 2025-08-06 | 13F | Able Wealth Management LLC | 15 708 | 98,61 | 1 770 | 100,91 | ||||
| 2025-08-04 | 13F | Assetmark, Inc | 202 | 59,06 | 23 | 57,14 | ||||
| 2025-08-11 | 13F | HighTower Advisors, LLC | 53 116 | 3,66 | 5 985 | 4,78 | ||||
| 2025-08-27 | 13F/A | Brinker Capital Investments, LLC | 3 783 | −33,93 | 426 | −33,23 | ||||
| 2025-08-14 | 13F | Mml Investors Services, Llc | 65 264 | −23,01 | 7 | −22,22 | ||||
| 2025-08-11 | 13F | Empowered Funds, LLC | 430 894 | 73,23 | 48 553 | 75,09 | ||||
| 2025-07-23 | 13F | L.K. Benson & Company, P.C. | 3 574 | 2,67 | 403 | 3,61 | ||||
| 2025-08-06 | 13F | Aspect Partners, LLC | 95 093 | 104,80 | 10 715 | 107,01 | ||||
| 2025-08-14 | 13F | Aqr Capital Management Llc | 62 355 | 5,35 | 7 026 | 6,49 | ||||
| 2025-08-11 | 13F | SFI Advisors, LLC | 3 823 | 431 | ||||||
| 2025-08-14 | 13F | UBS Group AG | 0 | −100,00 | 0 | |||||
| 2025-08-08 | 13F | Avantax Advisory Services, Inc. | 5 688 | 641 | ||||||
| 2025-07-16 | 13F | Kathmere Capital Management, LLC | 60 470 | −7,25 | 6 814 | −6,26 | ||||
| 2025-08-06 | 13F | Stokes Family Office, LLC | 102 690 | −17,92 | 11 571 | −17,05 | ||||
| 2025-07-30 | 13F | Insight Advisors, LLC/ PA | 327 386 | 24,21 | 36 890 | 25,54 | ||||
| 2025-08-15 | 13F | Kestra Advisory Services, LLC | 18 810 | −2,41 | 2 120 | −1,35 | ||||
| 2025-08-14 | 13F | Colony Group, LLC | 12 361 | −62,30 | 1 393 | −61,92 | ||||
| 2025-07-15 | 13F | Ridgecrest Wealth Partners, Llc | 0 | −100,00 | 0 | |||||
| 2025-07-30 | 13F | D.a. Davidson & Co. | 57 729 | 14,66 | 6 505 | 15,87 | ||||
| 2025-07-18 | 13F | Childress Capital Advisors, Llc | 9 560 | 0,63 | 1 077 | 1,70 | ||||
| 2025-08-11 | 13F | Principal Securities, Inc. | 1 000 | 0,00 | 113 | 1,82 | ||||
| 2025-08-13 | 13F | Integrity Investment Advisors, LLC | 11 544 | 1 301 | ||||||
| 2025-08-05 | 13F | Astra Wealth Partners LLC | 26 110 | 2,76 | 2 942 | 3,88 | ||||
| 2025-07-17 | 13F | LifeGoal Wealth Advisors | 3 714 | −20,57 | 418 | −19,77 | ||||
| 2025-05-13 | 13F | Heron Bay Capital Management | 0 | −100,00 | 0 | |||||
| 2025-08-11 | 13F | Cornerstone Planning Group LLC | 492 | 173,33 | 56 | 175,00 | ||||
| 2025-08-13 | 13F | First Trust Advisors Lp | 2 018 | 227 | ||||||
| 2025-07-31 | 13F | Moser Wealth Advisors, LLC | 38 150 | 36,84 | 4 299 | 38,29 | ||||
| 2025-07-16 | 13F | MKT Advisors LLC | 2 930 | −10,97 | 330 | −9,84 | ||||
| 2025-07-29 | 13F | Swan Global Investments, LLC | 10 500 | 75,00 | 1 183 | 77,10 | ||||
| 2025-07-08 | 13F | Paladin Wealth, LLC | 2 118 | 239 | ||||||
| 2025-07-25 | 13F | Hazlett, Burt & Watson, Inc. | 140 | 0,00 | 0 | |||||
| 2025-07-07 | 13F | Teamwork Financial Advisors, LLC | 4 559 | 0,00 | 514 | 0,98 | ||||
| 2025-08-12 | 13F | Bravias Capital Group, LLC | 258 922 | −5,83 | 29 175 | −4,82 | ||||
| 2025-07-25 | 13F | Sippican Capital Advisors | 3 189 | −82,93 | 359 | −82,76 | ||||
| 2025-07-03 | 13F | Whitcomb & Hess, Inc. | 214 134 | 4,07 | 24 129 | 5,18 | ||||
| 2025-07-18 | 13F | Truist Financial Corp | 49 279 | 8,03 | 5 553 | 9,18 | ||||
| 2025-08-06 | 13F | Innealta Capital, Llc | 6 944 | 782 | ||||||
| 2025-08-14 | 13F | Smartleaf Asset Management LLC | 888 | 238,93 | 100 | 244,83 | ||||
| 2025-07-08 | 13F | Gradient Investments LLC | 32 233 | 90,83 | 3 632 | 92,88 | ||||
| 2025-08-06 | 13F | Commonwealth Equity Services, Llc | 58 841 | −67,65 | 7 | −70,00 | ||||
| 2025-08-05 | 13F | Lifeworks Advisors, LLC | 92 758 | 212,83 | 10 452 | 216,25 | ||||
| 2025-08-08 | 13F | Creative Planning | 22 389 | 709,73 | 2 523 | 718,83 | ||||
| 2025-08-11 | 13F | Empirical Finance, LLC | 20 247 | 0,00 | 2 281 | 1,06 | ||||
| 2025-08-12 | 13F | XTX Topco Ltd | 3 154 | 4,30 | 355 | 5,34 | ||||
| 2025-07-30 | NP | TAX - Cambria Tax Aware ETF | 4 637 | −4,92 | 521 | −3,88 | ||||
| 2025-07-29 | 13F | Arcus Capital Partners, LLC | 7 200 | 213,04 | 811 | 216,80 | ||||
| 2025-08-15 | 13F | Morgan Stanley | 4 635 | −96,82 | 522 | −96,79 | ||||
| 2025-07-11 | 13F | Farther Finance Advisors, LLC | 16 411 | −3,49 | 1 849 | −2,43 | ||||
| 2025-08-07 | 13F | Private Advisory Group LLC | 32 384 | 3 649 | ||||||
| 2025-08-12 | 13F | Journey Strategic Wealth Llc | 17 428 | −16,67 | 1 964 | −15,79 | ||||
| 2025-08-01 | 13F | Envestnet Asset Management Inc | 24 572 | 19,96 | 2 769 | 21,24 | ||||
| 2025-08-08 | 13F | Condor Capital Management | 3 248 | −0,03 | 366 | 1,10 | ||||
| 2025-08-11 | 13F | Atlantic Private Wealth, LLC | 1 608 | 31,37 | 181 | 33,09 | ||||
| 2025-08-05 | 13F | Jessup Wealth Management, Inc | 7 675 | 0,00 | 865 | 1,05 | ||||
| 2025-08-14 | 13F | Torno Capital, Llc | 17 350 | −81,54 | 1 955 | −81,35 | ||||
| 2025-08-13 | 13F | Townsquare Capital Llc | 0 | −100,00 | 0 | |||||
| 2025-07-23 | 13F | Tcfg Wealth Management, Llc | 40 508 | −1,71 | 4 564 | −0,65 | ||||
| 2025-04-14 | 13F | Wedmont Private Capital | 0 | −100,00 | 0 | |||||
| 2025-07-17 | 13F | Avondale Wealth Management | 57 630 | 40,81 | 6 494 | 42,33 | ||||
| 2025-08-06 | 13F | Black Swift Group, LLC | 37 240 | 61,91 | 4 196 | 63,65 | ||||
| 2025-08-07 | 13F | Encompass More Asset Management | 2 344 | 264 | ||||||
| 2025-07-25 | 13F | Stephens Consulting, LLC | 40 380 | 51,68 | 4 550 | 53,30 | ||||
| 2025-08-14 | 13F | Royal Bank Of Canada | 20 004 | −9,38 | 2 254 | −8,41 | ||||
| 2025-08-05 | 13F | Kesler, Norman & Wride, LLC | 7 284 | −21,54 | 821 | −20,77 | ||||
| 2025-04-14 | 13F | Whitaker-Myers Wealth Managers, LTD. | 0 | −100,00 | 0 | |||||
| 2025-08-05 | 13F | Optivise Advisory Services LLC | 32 564 | 53,73 | 3 669 | 55,40 | ||||
| 2025-08-11 | 13F | Root Financial Partners, LLC | 9 308 | 12,48 | 1 049 | 13,67 | ||||
| 2025-07-14 | 13F | IronOak Wealth LLC. | 39 789 | 4 483 | ||||||
| 2025-08-12 | 13F | LPL Financial LLC | 20 168 | −26,10 | 2 273 | −25,31 | ||||
| 2025-07-07 | 13F | Kings Path Partners LLC | 217 | 0,00 | 24 | 0,00 | ||||
| 2025-08-08 | 13F | Kingsview Wealth Management, LLC | 66 298 | 27,74 | 7 470 | 29,10 | ||||
| 2025-07-25 | 13F | Almanack Investment Partners, LLC. | 160 525 | 1 368,80 | 18 088 | 1 384,98 | ||||
| 2025-04-02 | 13F | Marcum Wealth, LLC | 3 185 | 0,00 | 355 | 1,14 | ||||
| 2025-07-23 | 13F | Sax Wealth Advisors, Llc | 7 873 | 887 | ||||||
| 2025-08-14 | 13F | Wells Fargo & Company/mn | 184 | 21 | ||||||
| 2025-08-08 | 13F | Larson Financial Group LLC | 3 320 | −33,06 | 374 | −32,25 | ||||
| 2025-08-14 | 13F | Harmony Asset Management Llc | 2 857 | 0,00 | 322 | 0,94 | ||||
| 2025-07-23 | 13F | Kingswood Wealth Advisors, Llc | 1 782 | 201 | ||||||
| 2025-08-15 | 13F | WealthCollab, LLC | 2 258 | 0,00 | 254 | 1,20 | ||||
| 2025-07-16 | 13F | Signaturefd, Llc | 30 | 0,00 | 3 | 0,00 | ||||
| 2025-08-14 | 13F | Atomi Financial Group, Inc. | 2 207 | 0,00 | 249 | 0,81 | ||||
| 2025-07-24 | 13F | Us Bancorp \de\ | 17 769 | 2 002 | ||||||
| 2025-08-14 | 13F | Mariner, LLC | 194 367 | 3,06 | 21 901 | 4,16 | ||||
| 2025-06-27 | NP | GAA - Cambria Global Asset Allocation ETF | 4 790 | 0,00 | 536 | 1,13 | ||||
| 2025-08-14 | 13F | Raymond James Financial Inc | 1 714 | −38,92 | 193 | −38,14 | ||||
| 2025-07-23 | 13F | Wealth Management Nebraska | 26 935 | 305,10 | 3 034 | 309,45 | ||||
| 2025-04-15 | 13F | Oak Family Advisors, Llc | 0 | −100,00 | 0 | −100,00 | ||||
| 2025-08-04 | 13F | Amplius Wealth Advisors, LLC | 172 112 | 29,41 | 19 394 | 30,80 | ||||
| 2025-05-15 | 13F | Tower Research Capital LLC (TRC) | 0 | −100,00 | 0 | |||||
| 2025-07-15 | 13F | Vestment Financial LLC | 4 654 | 1,90 | 524 | 2,95 | ||||
| 2025-07-25 | 13F | Cwm, Llc | 224 790 | −22,84 | 25 | −21,87 | ||||
| 2025-07-29 | 13F | BXM Wealth LLC | 6 590 | −36,24 | 743 | −35,65 | ||||
| 2025-08-13 | 13F | Greenwich Wealth Management LLC | 3 681 | 5,35 | 0 | |||||
| 2025-08-14 | 13F | Sunbelt Securities, Inc. | 59 000 | −46,92 | 6 507 | −47,50 | ||||
| 2025-07-24 | 13F | Freedom Day Solutions, LLC | 17 000 | 6,25 | 1 916 | 7,40 | ||||
| 2025-07-11 | 13F | Seacrest Wealth Management, Llc | 2 600 | 0,00 | 293 | 1,04 | ||||
| 2025-08-29 | NP | BDGS - Bridges Capital Tactical ETF | 150 596 | −38,31 | 16 969 | −37,65 | ||||
| 2025-08-14 | 13F/A | Rockefeller Capital Management L.P. | 602 410 | −1,65 | 67 880 | −0,60 | ||||
| 2025-07-30 | NP | LENS - Sarmaya Thematic ETF | 1 618 | 63,43 | 182 | 64,55 | ||||
| 2025-08-14 | 13F | Fortress Private Ledger, Llc | 15 287 | 5,43 | 1 723 | 6,56 | ||||
| 2025-07-31 | 13F | Opus Capital Group, LLC | 183 194 | 12,59 | 21 | 11,11 | ||||
| 2025-07-14 | 13F | UMA Financial Services, Inc. | 1 917 | 109,05 | 216 | 111,76 | ||||
| 2025-08-06 | 13F | Prospera Financial Services Inc | 30 407 | 7,10 | 3 426 | 8,25 | ||||
| 2025-08-11 | 13F | Private Advisor Group, LLC | 37 246 | 18,25 | 4 197 | 19,51 | ||||
| 2025-08-14 | 13F | Bank Of America Corp /de/ | 1 900 | 0,00 | 214 | 1,42 | ||||
| 2025-08-14 | 13F | Acas, Llc | 79 686 | 16,87 | 9 022 | 18,26 | ||||
| 2025-07-14 | 13F | Enzi Wealth | 17 548 | 0,83 | 1 979 | 1,75 | ||||
| 2025-08-13 | 13F | Renaissance Technologies Llc | 0 | −100,00 | 0 | |||||
| 2025-08-06 | 13F | Wedbush Securities Inc | 1 948 | −30,65 | 0 | |||||
| 2025-08-12 | 13F | Jpmorgan Chase & Co | 16 839 | 242,40 | 1 897 | 246,17 | ||||
| 2025-08-12 | 13F/A | Castellan Group, LLC | 44 400 | 5 003 | ||||||
| 2025-07-18 | 13F | Parkwoods Wealth Partners, LLC | 4 396 | 39,64 | 495 | 41,43 | ||||
| 2025-08-13 | 13F | Beacon Pointe Advisors, LLC | 3 005 | 0,00 | 339 | 0,90 | ||||
| 2025-08-05 | 13F | Strategic Financial Concepts, LLC | 2 850 | 0,00 | 321 | 1,26 | ||||
| 2025-07-10 | 13F | Wealth Enhancement Advisory Services, Llc | 1 679 613 | 4,07 | 189 301 | 5,20 | ||||
| 2025-08-06 | 13F | Summit Wealth & Retirement Planning, Inc. | 135 442 | 3,80 | 15 262 | 4,91 | ||||
| 2025-08-19 | 13F | Advisory Services Network, LLC | 13 534 | −80,44 | 1 530 | −80,17 | ||||
| 2025-07-25 | 13F | Transcendent Capital Group LLC | 10 381 | −78,66 | 1 170 | −78,45 | ||||
| 2025-08-13 | 13F | Epacria Capital Partners, Llc | 56 822 | 9,14 | 6 403 | 10,30 | ||||
| 2025-07-29 | 13F | Straight Path Wealth Management | 3 469 | −22,01 | 391 | −21,21 | ||||
| 2025-08-18 | 13F | Hershey Financial Advisers, LLC | 38 775 | 4 369 | ||||||
| 2025-08-13 | 13F | Northwestern Mutual Wealth Management Co | 12 605 | 14,97 | 1 420 | 16,20 | ||||
| 2025-08-12 | 13F | BWM Planning, LLC | 31 591 | −8,27 | 3 560 | −7,29 | ||||
| 2025-07-14 | 13F | U.S. Capital Wealth Advisors, LLC | 16 580 | 160,12 | 1 868 | 163,10 | ||||
| 2025-08-11 | 13F | CFS Investment Advisory Services, LLC | 4 185 | 0,00 | 0 | |||||
| 2025-08-12 | 13F | Weaver Consulting Group | 81 610 | 2,70 | 9 196 | 3,79 | ||||
| 2025-08-14 | 13F | KKM Financial LLC | 7 375 | 831 | ||||||
| 2025-05-09 | 13F | Chicago Partners Investment Group LLC | 0 | −100,00 | 0 | |||||
| 2025-07-09 | 13F | Hummer Financial Advisory Services Inc | 2 200 | 0,00 | 248 | 0,82 | ||||
| 2025-07-25 | 13F | Concurrent Investment Advisors, LLC | 4 137 | 466 | ||||||
| 2025-07-30 | 13F | Journey Advisory Group, LLC | 54 098 | −0,72 | 6 096 | 0,35 | ||||
| 2025-08-14 | 13F | Old Mission Capital Llc | 4 545 | −41,10 | 512 | −40,47 | ||||
| 2025-07-10 | 13F | Fortress Wealth Management, Inc. | 6 244 | 47,13 | 704 | 48,63 | ||||
| 2025-07-09 | 13F | Client First Investment Management LLC | 238 122 | −25,30 | 26 832 | −24,51 | ||||
| 2025-08-05 | 13F | Magnolia Capital Advisors Llc | 5 250 | 10,53 | 592 | 11,72 | ||||
| 2025-08-08 | 13F | Thoroughbred Financial Services, Llc | 10 023 | 239,30 | 1 | |||||
| 2025-08-14 | 13F | Mercer Global Advisors Inc /adv | 9 911 | 1 117 | ||||||
| 2025-08-14 | 13F | Beck Capital Management, Llc | 13 760 | −6,28 | 1 550 | −5,26 | ||||
| 2025-07-25 | 13F | RHS Financial, LLC | 35 396 | 7,92 | 3 988 | 9,08 | ||||
| 2025-07-15 | 13F | Revisor Wealth Management LLC | 5 062 | 571 | ||||||
| 2025-08-13 | 13F | Continuum Advisory, LLC | 0 | −100,00 | 0 | −100,00 | ||||
| 2025-08-14 | 13F | Hrt Financial Lp | 6 726 | 1 | ||||||
| 2025-08-12 | 13F | Seeds Investor Llc | 3 376 | −23,83 | 380 | −23,08 | ||||
| 2025-07-25 | 13F | Apollon Wealth Management, LLC | 0 | −100,00 | 0 | |||||
| 2025-07-17 | 13F | New Perspectives, Inc | 0 | −100,00 | 0 | |||||
| 2025-08-06 | 13F | True Wealth Design, LLC | 371 368 | −35,16 | 41 846 | −34,46 | ||||
| 2025-07-11 | 13F | SILVER OAK SECURITIES, Inc | 2 242 | 15,21 | 253 | 16,67 | ||||
| 2025-07-17 | 13F | Janney Montgomery Scott LLC | 43 263 | 63,16 | 5 | 100,00 | ||||
| 2025-07-21 | 13F | Ameritas Advisory Services, LLC | 1 360 | 153 | ||||||
| 2025-07-24 | 13F | KC Investment Advisors, LLC | 83 601 | −44,11 | 9 420 | −43,51 | ||||
| 2025-08-14 | 13F | Napa Wealth Management | 56 557 | 103,38 | 6 373 | 105,55 | ||||
| 2025-08-07 | 13F | Apeiron RIA LLC | 16 873 | −8,81 | 1 901 | −7,81 | ||||
| 2025-07-21 | 13F | Triad Wealth Partners, LLC | 13 595 | 46,26 | 1 532 | 47,78 | ||||
| 2025-07-23 | 13F | Gentry Private Wealth, Llc | 12 707 | −8,92 | 1 432 | −7,97 | ||||
| 2025-04-17 | 13F | Vista Wealth Management Group, LLC | 9 466 | 0,49 | 1 055 | 1,64 | ||||
| 2025-07-09 | 13F | Beacon Financial Group | 33 773 | 17,70 | 3 806 | 18,94 | ||||
| 2025-08-11 | 13F | TD Waterhouse Canada Inc. | 16 123 | 20,32 | 1 816 | 21,55 | ||||
| 2025-07-28 | 13F | RFG Advisory, LLC | 9 959 | 5,87 | 1 122 | 7,06 | ||||
| 2025-07-31 | 13F | Cambridge Investment Research Advisors, Inc. | 476 303 | −3,13 | 54 | −1,85 | ||||
| 2025-08-15 | 13F | Lgl Partners, Llc | 9 000 | 0,00 | 1 018 | 1,50 | ||||
| 2025-08-07 | 13F | Vise Technologies, Inc. | 3 948 | 445 | ||||||
| 2025-08-13 | 13F | Kilter Group LLC | 3 825 | −27,75 | 431 | −26,95 | ||||
| 2025-07-09 | 13F | Pallas Capital Advisors LLC | 19 936 | 4,16 | 2 246 | 5,30 | ||||
| 2025-08-15 | 13F | Captrust Financial Advisors | 31 210 | −48,23 | 3 517 | −47,69 | ||||
| 2025-07-28 | 13F | Frazier Financial Advisors, LLC | 13 503 | 0,00 | 1 522 | 1,06 | ||||
| 2025-08-11 | 13F | United Advisor Group, LLC | 8 719 | −4,14 | 982 | −3,16 | ||||
| 2025-08-13 | 13F | Cambria Investment Management, L.P. | 19 151 | −2,75 | 2 158 | −1,73 | ||||
| 2025-04-15 | 13F | Skyline Advisors, Inc. | 0 | −100,00 | 0 | |||||
| 2025-07-30 | 13F | Canvas Wealth Advisors, LLC | 9 016 | 49,87 | 1 019 | 51,49 | ||||
| 2025-08-29 | 13F | Centaurus Financial, Inc. | 4 692 | 1 | ||||||
| 2025-07-09 | 13F | Dynamic Advisor Solutions LLC | 26 969 | 67,99 | 3 039 | 69,82 | ||||
| 2025-08-01 | 13F | GoalVest Advisory LLC | 43 276 | 2,75 | 4 876 | 3,86 | ||||
| 2025-08-06 | 13F | ETF Store, Inc. | 11 169 | 19,39 | 1 258 | 20,73 | ||||
| 2025-08-07 | 13F | Allworth Financial LP | 1 575 | 173,91 | 177 | 176,56 | ||||
| 2025-05-15 | 13F | Harraden Circle Investments, LLC | 0 | −100,00 | 0 | −100,00 | ||||
| 2025-07-29 | 13F | Mattson Financial Services, LLC | 0 | −100,00 | 0 | |||||
| 2025-07-16 | 13F | One + One Wealth Management, Llc | 10 917 | −24,54 | 1 230 | −23,70 | ||||
| 2025-07-09 | 13F | Fermata Advisors, LLC | 5 563 | 47,83 | 627 | 49,40 | ||||
| 2025-08-12 | 13F | Landing Point Financial Group, LLC | 10 272 | 16,93 | 1 157 | 18,18 | ||||
| 2025-09-04 | 13F/A | Advisor Group Holdings, Inc. | 45 304 | 6,49 | 5 105 | 7,63 | ||||
| 2025-08-06 | 13F | Financial Alternatives, Inc | 1 896 | 214 | ||||||
| 2025-07-23 | 13F | Steel Peak Wealth Management LLC | 7 426 | −43,76 | 837 | −43,21 | ||||
| 2025-08-05 | 13F | Westside Investment Management, Inc. | 1 000 | −16,67 | 113 | −15,79 | ||||
| 2025-08-12 | 13F | Proequities, Inc. | 0 | 0 | ||||||
| 2025-08-05 | 13F | Hutchens & Kramer Investment Management Group, LLC | 2 360 | −18,90 | 266 | −18,21 | ||||
| 2025-08-12 | 13F | Allen Capital Group, LLC | 70 965 | 3,01 | 7 996 | 4,11 | ||||
| 2025-08-14 | 13F | Pennington Partners & Co., Llc | 242 064 | −5,52 | 27 276 | −4,51 | ||||
| 2025-08-06 | 13F | AE Wealth Management LLC | 182 | 0,00 | 21 | 0,00 | ||||
| 2025-08-14 | 13F | Warren Averett Asset Management, LLC | 3 092 | −45,26 | 348 | −44,67 | ||||
| 2025-07-25 | 13F | We Are One Seven, LLC | 20 355 | −23,47 | 2 294 | −22,66 | ||||
| 2025-08-12 | 13F | Hill Investment Group Partners, LLC | 24 506 | −61,67 | 2 761 | −61,26 | ||||
| 2025-04-22 | 13F | Castleview Partners, Llc | 0 | −100,00 | 0 | |||||
| 2025-07-07 | 13F | Peterson Wealth Advisors, LLC | 13 475 | 129,32 | 1 518 | 131,76 | ||||
| 2025-07-11 | 13F | Compass Ion Advisors, LLC | 224 570 | −11,08 | 25 305 | −10,14 | ||||
| 2025-08-08 | 13F | Tortoise Investment Management, LLC | 138 836 | 10,64 | 15 644 | 11,83 | ||||
| 2025-07-28 | 13F | Harbour Investments, Inc. | 4 780 | 21,01 | 539 | 22,27 | ||||
| 2025-08-11 | 13F | Wealthspire Advisors, LLC | 15 203 | 56,31 | 1 713 | 58,03 | ||||
| 2025-07-10 | 13F | Focus Financial Network, Inc. | 21 789 | 7,49 | 2 455 | 8,68 | ||||
| 2025-08-12 | 13F | OneAscent Financial Services LLC | 3 795 | 0 | ||||||
| 2025-05-09 | 13F | West Michigan Advisors, Llc | 0 | −100,00 | 0 | |||||
| 2025-08-13 | 13F | Virtue Capital Management, LLC | 0 | −100,00 | 0 | |||||
| 2025-08-14 | 13F | ADAR1 Capital Management, LLC | 337 125 | 0,00 | 37 987 | 1,07 | ||||
| 2025-07-16 | 13F | Moisand Fitzgerald Tamayo, LLC | 3 195 | 0,00 | 360 | 1,12 | ||||
| 2025-07-28 | 13F | IFG Advisors, LLC | 65 760 | 2,23 | 7 410 | 3,32 | ||||
| 2025-05-14 | 13F | Flow Traders U.s. Llc | 0 | −100,00 | 0 | |||||
| 2025-08-14 | 13F | Arete Wealth Advisors, LLC | 105 226 | 19,72 | 12 | 22,22 | ||||
| 2025-06-30 | NP | HTUS - Hull Tactical US ETF | 35 787 | 0,00 | 4 005 | 1,01 | ||||
| 2025-08-14 | 13F | IHT Wealth Management, LLC | 91 484 | 51,45 | 10 308 | 52,76 |