Grundläggande statistik
| Institutionella ägare | 220 total, 217 long only, 0 short only, 3 long/short - change of −4,76% MRQ |
| Genomsnittlig portföljallokering | 0.1458 % - change of 3,35% MRQ |
| Institutionella aktier (lång) | 49 888 917 (ex 13D/G) - change of 0,99MM shares 2,03% MRQ |
| Institutionellt värde (lång) | $ 426 119 USD ($1000) |
Institutionellt ägande och aktieägare
Barings BDC, Inc. (US:BBDC) har 220 Institutionella ägare och aktieägare som har lämnat in 13D/G- eller 13F-formulär till Securities Exchange Commission (SEC). Dessa institut innehar totalt 49,888,917 aktier. Största aktieägare inkluderar Barings Llc, Ares Management Llc, Private Management Group Inc, Van Eck Associates Corp, BIZD - VanEck Vectors BDC Income ETF, Cresset Asset Management, LLC, UBS Group AG, Invesco Ltd., Two Sigma Advisers, Lp, and Kovitz Investment Group Partners, LLC .
Barings BDC, Inc. (NYSE:BBDC) Institutionell ägarstruktur visar institutioners och fonders nuvarande positioner i företaget, samt de senaste förändringarna i positionernas storlek. Större aktieägare kan vara enskilda investerare, fonder, hedgefonder eller institutioner. Bilaga 13D visar att investeraren äger (eller ägde) mer än 5% av företaget och avser (eller avsåg) att aktivt eftersträva en förändring av affärsstrategin. Schedule 13G indikerar en passiv investering på över 5%.
The share price as of September 12, 2025 is 9,30 / share. Previously, on September 16, 2024, the share price was 9,93 / share. This represents a decline of 6,34% over that period.

Fondsentimentets poäng
Fondsentimentet poängen(fka Ägarackumulation-poäng) visar vilka aktier som är mest köpta av fonder. Det är resultatet av en sofistikerad kvantitativ flerfaktormodell som identifierar företag med de högsta nivåerna av institutionell ackumulering. Poängsättningsmodellen använder en kombination av den totala ökningen av redovisade ägare, förändringarna i portföljallokeringarna för dessa ägare och andra mått. Siffran sträcker sig från 0 till 100, där högre siffror indikerar en högre nivå av ackumulering i förhållande till sina konkurrenter, och 50 är genomsnittet.
Uppdateringsfrekvens: Dagligen
Se Ownership Explorer, som innehåller en lista över de högst rankade företagen.
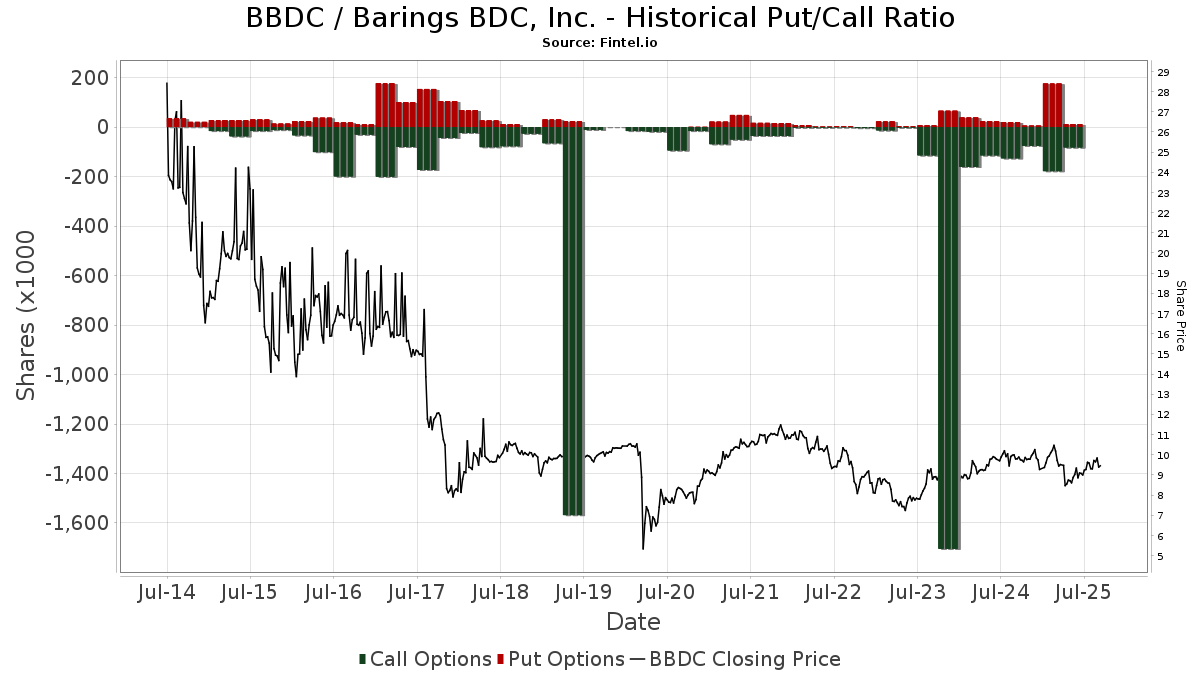
Institutionell sälj/köp-kvot
Förutom att rapportera vanliga eget kapital- och skuldemissioner måste institutioner med mer än 100MM tillgångar under förvaltning också avslöja sina innehav av sälj- och köpoptioner. Eftersom säljoptioner i allmänhet indikerar ett negativt sentiment och köpoptioner indikerar ett positivt sentiment, kan vi få en uppfattning om det övergripande institutionella sentimentet genom att plotta förhållandet mellan säljoptioner och köpoptioner. Diagrammet till höger visar det historiska förhållandet mellan sälj- och köpoptioner för detta instrument.
Genom att använda sälj/köp-kvoten som en indikator på aktieägarnas sentiment undviker man en av de största bristerna med att använda det totala institutionella ägandet, nämligen att en betydande del av de förvaltade tillgångarna investeras passivt för att följa index. Passivt förvaltade fonder köper vanligtvis inte optioner, så indikatorn för sälj/köp-kvoten ger en bättre bild av stämningen i aktivt förvaltade fonder.
13F- och NPORT-arkiveringar
Detaljer om 13F-arkiveringar är gratis. Detaljer om NP-arkiveringar kräver ett premiummedlemskap. Gröna rader indikerar nya positioner. Röda rader indikerar stängda positioner. Klicka på länk symbolen för att se hela transaktionshistoriken.
Uppgradera
för att låsa upp premiumdata och exportera till Excel ![]() .
.
| Fil Datum | Källa | Investerare | Typ | Genomsnittligt pris (beräknat) |
Aktier | Δ Aktier (%) |
Rapporterat värde (1000 USD) |
Δ Värde (%) |
Portföljallokering (%) |
|
|---|---|---|---|---|---|---|---|---|---|---|
| 2025-07-10 | 13F | Wealth Enhancement Advisory Services, Llc | 156 268 | 2,58 | 1 450 | −0,21 | ||||
| 2025-07-18 | 13F | Founders Capital Management | 979 | 0,00 | 9 | −11,11 | ||||
| 2025-08-12 | 13F | Proequities, Inc. | Put | 0 | 0 | |||||
| 2025-07-24 | 13F | Us Bancorp \de\ | 151 | −34,91 | 1 | −50,00 | ||||
| 2025-08-12 | 13F | Proequities, Inc. | Call | 0 | 0 | |||||
| 2025-08-12 | 13F | Proequities, Inc. | 0 | 0 | ||||||
| 2025-07-31 | 13F | Brinker Capital Investments, LLC | 0 | −100,00 | 0 | |||||
| 2025-08-11 | 13F | Nomura Asset Management Co Ltd | 2 260 | −49,26 | 21 | −52,38 | ||||
| 2025-07-21 | 13F | Ameritas Advisory Services, LLC | 1 930 | 18 | ||||||
| 2025-08-05 | 13F | Huntington National Bank | 1 | 0,00 | 0 | |||||
| 2025-08-05 | 13F | GHP Investment Advisors, Inc. | 2 285 | 2,84 | 21 | −4,76 | ||||
| 2025-08-08 | 13F | Creative Planning | 27 943 | 0,94 | 255 | −3,41 | ||||
| 2025-07-30 | 13F | Green Square Capital Advisors Llc | 359 280 | 487,46 | 3 284 | 463,12 | ||||
| 2025-08-11 | 13F | Western Wealth Management, LLC | 16 905 | 0,00 | 155 | −4,35 | ||||
| 2025-08-14 | 13F | Cooperman Leon G | 0 | −100,00 | 0 | |||||
| 2025-08-14 | 13F | Susquehanna International Group, Llp | Call | 17 000 | −81,32 | 155 | −82,14 | |||
| 2025-08-14 | 13F | Van Eck Associates Corp | 2 343 401 | 7,81 | 21 | 5,00 | ||||
| 2025-08-08 | 13F | Financial Gravity Companies, Inc. | 306 055 | 1,01 | 2 797 | −3,52 | ||||
| 2025-07-10 | 13F | Focus Financial Network, Inc. | 14 672 | −0,78 | 134 | −4,96 | ||||
| 2025-07-31 | 13F | Cambridge Investment Research Advisors, Inc. | 217 821 | 5,15 | 2 | 0,00 | ||||
| 2025-07-07 | 13F | Bangor Savings Bank | 1 000 | 9 | ||||||
| 2025-08-12 | 13F | Barings Llc | 13 639 681 | 0,00 | 124 667 | −4,19 | ||||
| 2025-08-04 | 13F | AlphaStar Capital Management, LLC | 12 208 | 0,07 | 112 | −4,31 | ||||
| 2025-04-14 | 13F | Harbor Capital Advisors, Inc. | 0 | −100,00 | 0 | −100,00 | ||||
| 2025-08-14 | 13F | Two Sigma Investments, Lp | 562 562 | −23,18 | 5 142 | −26,41 | ||||
| 2025-08-05 | 13F | Westside Investment Management, Inc. | 680 | 6 | ||||||
| 2025-08-14 | 13F | Bulldog Investors, LLP | 210 501 | 1 924 | ||||||
| 2025-07-17 | 13F | Raleigh Capital Management Inc. | 32 785 | 0,32 | 300 | −3,86 | ||||
| 2025-08-12 | 13F | Legal & General Group Plc | 716 611 | 3,37 | 6 553 | −0,76 | ||||
| 2025-07-11 | 13F | Caldwell Securities, Inc | 1 958 | 0,00 | 18 | −5,56 | ||||
| 2025-08-14 | 13F | Oxford Asset Management Llp | 0 | −100,00 | 0 | −100,00 | ||||
| 2025-08-12 | 13F | Franklin Resources Inc | 826 659 | 18,10 | 7 556 | 13,15 | ||||
| 2025-07-10 | 13F | Capital Advisory Group Advisory Services, LLC | 16 800 | 3,70 | 154 | −0,65 | ||||
| 2025-09-04 | 13F/A | Advisor Group Holdings, Inc. | 336 307 | −3,69 | 3 076 | −7,69 | ||||
| 2025-05-15 | 13F | Talon Private Wealth, LLC | 0 | −100,00 | 0 | −100,00 | ||||
| 2025-07-16 | 13F | Eagle Global Advisors Llc | 34 295 | 22,61 | 313 | 17,67 | ||||
| 2025-08-13 | 13F | Cary Street Partners Financial Llc | 24 171 | 40,21 | 221 | 34,15 | ||||
| 2025-04-24 | 13F | Decker Retirement Planning Inc. | 0 | −100,00 | 0 | |||||
| 2025-08-14 | 13F | Susquehanna International Group, Llp | 0 | −100,00 | 0 | |||||
| 2025-08-14 | 13F | Fmr Llc | 86 | 0,00 | 1 | |||||
| 2025-08-14 | 13F | Group One Trading, L.p. | Call | 7 000 | −30,00 | 64 | −33,68 | |||
| 2025-08-14 | 13F | Susquehanna International Group, Llp | Put | 0 | −100,00 | 0 | ||||
| 2025-08-14 | 13F | Smartleaf Asset Management LLC | 0 | −100,00 | 0 | |||||
| 2025-08-04 | 13F | Muzinich & Co., Inc. | 291 373 | 10,83 | 2 663 | 6,18 | ||||
| 2025-07-28 | 13F | WealthPlan Investment Management, LLC | 0 | −100,00 | 0 | |||||
| 2025-08-13 | 13F | Virtus Investment Advisers, Inc. | 92 258 | 3,74 | 843 | −0,59 | ||||
| 2025-08-08 | 13F | Advyzon Investment Management, LLC | 13 759 | 126 | ||||||
| 2025-08-27 | NP | Special Opportunities Fund, Inc. | 11 631 | −94,34 | 106 | −94,45 | ||||
| 2025-05-08 | 13F | Gsa Capital Partners Llp | 0 | −100,00 | 0 | |||||
| 2025-03-28 | NP | ESCQX - Embark Small Cap Equity Fund Retirement Class | 611 714 | −19,12 | 6 191 | −15,36 | ||||
| 2025-08-11 | 13F | Mindset Wealth Management, Llc | 0 | −100,00 | 0 | |||||
| 2025-07-21 | 13F | Patriot Financial Group Insurance Agency, LLC | 21 895 | −53,02 | 200 | −54,95 | ||||
| 2025-07-15 | 13F | Mather Group, Llc. | 0 | −100,00 | 0 | |||||
| 2025-08-13 | 13F | Icon Advisers Inc/co | 0 | −100,00 | 0 | |||||
| 2025-08-13 | 13F | Lansforsakringar Fondforvaltning AB (publ) | 0 | −100,00 | 0 | |||||
| 2025-09-10 | NP | Putnam ETF Trust - Putnam BDC ETF - | 837 188 | 10,18 | 7 736 | 16,90 | ||||
| 2025-07-15 | 13F | North Star Investment Management Corp. | 640 | 0,00 | 6 | −16,67 | ||||
| 2025-08-12 | 13F | Running Point Capital Advisors, LLC | 10 000 | 91 | ||||||
| 2025-08-13 | 13F | Northern Trust Corp | 63 262 | 144,06 | 578 | 134,01 | ||||
| 2025-08-13 | 13F | Quadrature Capital Ltd | 0 | −100,00 | 0 | |||||
| 2025-08-14 | 13F | SWAN Capital LLC | 603 | 0,00 | 6 | 0,00 | ||||
| 2025-08-14 | 13F | Mariner, LLC | 29 363 | 7,58 | 268 | 3,08 | ||||
| 2025-08-12 | 13F | CIBC Private Wealth Group, LLC | 2 300 | 0,00 | 21 | 16,67 | ||||
| 2025-08-08 | 13F | Compass Wealth Management LLC | 0 | −100,00 | 0 | |||||
| 2025-07-25 | 13F | Apollon Wealth Management, LLC | 62 722 | 21,24 | 573 | 16,23 | ||||
| 2025-08-14 | 13F | TT Capital Management LLC | 234 692 | 2 078 | ||||||
| 2025-08-14 | 13F | UBS Group AG | 1 181 060 | 38,81 | 10 795 | 33,00 | ||||
| 2025-07-15 | 13F | Bfsg, Llc | 20 070 | 0,96 | 183 | −3,17 | ||||
| 2025-07-31 | 13F | Sumitomo Mitsui Trust Holdings, Inc. | 291 373 | 10,83 | 2 663 | 6,18 | ||||
| 2025-08-06 | 13F | Ethos Financial Group, LLC | 72 924 | 13,09 | 667 | 8,29 | ||||
| 2025-07-17 | 13F | Sound Income Strategies, LLC | 12 757 | 0,21 | 117 | −4,13 | ||||
| 2025-08-12 | 13F | Trexquant Investment LP | 289 844 | 97,01 | 2 649 | 88,81 | ||||
| 2025-08-12 | 13F | MAI Capital Management | 1 749 | 9,72 | 16 | 0,00 | ||||
| 2025-08-04 | 13F | Arkadios Wealth Advisors | 26 746 | 1,42 | 244 | −2,79 | ||||
| 2025-08-11 | 13F | Pineridge Advisors LLC | 0 | −100,00 | 0 | |||||
| 2025-08-07 | 13F | HighPoint Advisor Group LLC | 58 303 | 0,60 | 533 | 4,31 | ||||
| 2025-08-12 | 13F | Advisors Asset Management, Inc. | 413 259 | 3,50 | 3 777 | −0,84 | ||||
| 2025-08-04 | 13F | Integrity Alliance, Llc. | 13 754 | −1,87 | 126 | −6,02 | ||||
| 2025-07-17 | 13F | Farmers & Merchants Trust Co of Long Beach | 18 087 | 1,37 | 165 | −2,94 | ||||
| 2025-08-14 | 13F | Rivernorth Capital Management, Llc | 411 254 | 3 759 | ||||||
| 2025-08-13 | 13F | Consultiva Wealth Management, Corp. | 3 000 | 0,00 | 27 | −3,57 | ||||
| 2025-07-22 | 13F | Global Assets Advisory, LLC | 0 | −100,00 | 0 | |||||
| 2025-08-04 | 13F | Spire Wealth Management | 11 324 | −2,83 | 104 | −7,21 | ||||
| 2025-08-15 | 13F | Morgan Stanley | 861 363 | −10,47 | 7 873 | −14,23 | ||||
| 2025-08-06 | 13F | Commonwealth Equity Services, Llc | 55 848 | −9,54 | 1 | |||||
| 2025-08-14 | 13F | Citadel Advisors Llc | Call | 40 800 | −27,79 | 373 | −30,98 | |||
| 2025-08-14 | 13F | Citadel Advisors Llc | Put | 10 300 | −89,65 | 94 | −90,09 | |||
| 2025-08-14 | 13F | Warren Averett Asset Management, LLC | 44 283 | −4,04 | 405 | −8,18 | ||||
| 2025-08-14 | 13F | Cubist Systematic Strategies, LLC | 0 | −100,00 | 0 | |||||
| 2025-06-25 | NP | VPC - Virtus Private Credit Strategy ETF | 81 237 | −9,99 | 708 | −22,56 | ||||
| 2025-08-13 | 13F | Mackenzie Financial Corp | 0 | −100,00 | 0 | |||||
| 2025-07-16 | 13F | Essex Financial Services, Inc. | 26 320 | 0,11 | 241 | −4,00 | ||||
| 2025-08-14 | 13F | BI Asset Management Fondsmaeglerselskab A/S | 439 346 | 17,91 | 4 | 33,33 | ||||
| 2025-07-24 | 13F | Costello Asset Management, INC | 100 | 0,00 | 1 | |||||
| 2025-07-29 | 13F | Stephens Inc /ar/ | 23 035 | 0,78 | 211 | −3,67 | ||||
| 2025-08-13 | 13F | Cliffwater LLC | 126 753 | 0,00 | 1 159 | −4,22 | ||||
| 2025-07-29 | 13F | Harbor Asset Planning, Inc. | 1 000 | 9 | ||||||
| 2025-08-13 | 13F | Northwestern Mutual Wealth Management Co | 2 918 | 3,40 | 27 | 0,00 | ||||
| 2025-05-12 | 13F | Connor, Clark & Lunn Investment Management Ltd. | 0 | −100,00 | 0 | |||||
| 2025-08-06 | 13F | Founders Financial Securities Llc | 19 243 | −9,47 | 176 | −6,91 | ||||
| 2025-08-12 | 13F | Change Path, LLC | 34 696 | 3,36 | 317 | −0,94 | ||||
| 2025-08-12 | 13F | Jpmorgan Chase & Co | 116 149 | −23,28 | 1 062 | −26,52 | ||||
| 2025-08-15 | 13F | WFA of San Diego, LLC | 1 400 | 13 | ||||||
| 2025-08-12 | 13F | Armor Investment Advisors, LLC | 18 800 | 15,34 | 172 | 10,32 | ||||
| 2025-04-30 | 13F | Sofos Investments, Inc. | 301 719 | 4 289,92 | 2 878 | 4 260,61 | ||||
| 2025-07-28 | 13F | Rosenberg Matthew Hamilton | 0 | −100,00 | 0 | |||||
| 2025-07-28 | 13F | Harbour Investments, Inc. | 335 | 0,00 | 3 | 0,00 | ||||
| 2025-08-13 | 13F | Marshall Wace, Llp | 42 529 | −57,23 | 389 | −59,07 | ||||
| 2025-08-14 | 13F | Wells Fargo & Company/mn | 838 365 | 2,85 | 7 663 | −1,47 | ||||
| 2025-08-11 | 13F | HighTower Advisors, LLC | 140 788 | 0,00 | 1 287 | −4,24 | ||||
| 2025-08-15 | 13F | Kestra Advisory Services, LLC | 73 670 | 23,76 | 673 | 18,69 | ||||
| 2025-08-01 | 13F | Envestnet Asset Management Inc | 29 696 | −13,03 | 271 | −16,62 | ||||
| 2025-08-13 | 13F | Invesco Ltd. | 1 120 093 | 1,30 | 10 238 | −2,95 | ||||
| 2025-05-30 | NP | IOBAX - ICON FLEXIBLE BOND FUND Investor Class | 102 951 | −61,77 | 982 | −61,89 | ||||
| 2025-07-23 | 13F | Prime Capital Investment Advisors, LLC | 62 165 | −12,61 | 568 | −16,22 | ||||
| 2025-07-18 | 13F | Northeast Financial Group, Inc. | 14 686 | 134 | ||||||
| 2025-08-15 | 13F | Caxton Associates Llp | 22 596 | 0,00 | 207 | −4,19 | ||||
| 2025-08-14 | 13F | Group One Trading, L.p. | Put | 400 | −94,20 | 4 | −95,38 | |||
| 2025-08-01 | 13F | Y-Intercept (Hong Kong) Ltd | 142 749 | 1 305 | ||||||
| 2025-05-16 | 13F | Dynamic Technology Lab Private Ltd | 0 | −100,00 | 0 | |||||
| 2025-07-08 | 13F | Parallel Advisors, LLC | 1 456 | −5,45 | 13 | −7,14 | ||||
| 2025-07-11 | 13F | Seacrest Wealth Management, Llc | 15 438 | −20,48 | 141 | −23,78 | ||||
| 2025-08-14 | 13F | Royal Bank Of Canada | 60 673 | 63,47 | 555 | 56,78 | ||||
| 2025-08-14 | 13F | RMB Capital Management, LLC | 31 772 | 8,17 | 290 | 3,57 | ||||
| 2025-05-28 | NP | LUSIX - Lazard US Systematic Small Cap Equity Portfolio Institutional Shares | 9 732 | −11,97 | 93 | −12,38 | ||||
| 2025-04-01 | NP | PSP - Invesco Global Listed Private Equity ETF This fund is a listed as child fund of Invesco Ltd. and if that institution has disclosed ownership in this security, then these positions will not be double counted when calculating total shares and total value | 76 637 | 25,82 | 776 | 31,80 | ||||
| 2025-04-29 | 13F | Lee Danner & Bass Inc | 0 | −100,00 | 0 | |||||
| 2025-05-07 | 13F | Foundations Investment Advisors, LLC | 0 | −100,00 | 0 | |||||
| 2025-08-25 | 13F/A | Neuberger Berman Group LLC | 240 317 | 10,94 | 2 196 | 6,29 | ||||
| 2025-08-11 | 13F | Empowered Funds, LLC | 12 615 | −8,33 | 115 | −12,21 | ||||
| 2025-07-28 | NP | PEX - ProShares Global Listed Private Equity ETF | 19 962 | 1,18 | 186 | −9,76 | ||||
| 2025-05-05 | 13F | Lindbrook Capital, Llc | 1 119 | 28,33 | 11 | 25,00 | ||||
| 2025-07-11 | 13F | Farther Finance Advisors, LLC | 0 | −100,00 | 0 | |||||
| 2025-04-21 | 13F | Ronald Blue Trust, Inc. | 0 | −100,00 | 0 | |||||
| 2025-05-15 | 13F | Punch & Associates Investment Management, Inc. | 0 | −100,00 | 0 | |||||
| 2025-07-25 | NP | First Trust Specialty Finance & Financial Opportunities Fund This fund is a listed as child fund of First Trust Advisors Lp and if that institution has disclosed ownership in this security, then these positions will not be double counted when calculating total shares and total value | 290 000 | −25,64 | 2 700 | −33,57 | ||||
| 2025-07-07 | 13F | Salem Investment Counselors Inc | 0 | −100,00 | 0 | |||||
| 2025-08-14 | 13F | Qube Research & Technologies Ltd | 0 | −100,00 | 0 | |||||
| 2025-08-14 | 13F | Ameriprise Financial Inc | 29 669 | 7,62 | 271 | 3,04 | ||||
| 2025-08-07 | 13F | Allworth Financial LP | 16 372 | 1,44 | 150 | 4,93 | ||||
| 2025-08-18 | 13F | Geneos Wealth Management Inc. | 19 142 | −12,86 | 175 | −16,75 | ||||
| 2025-08-13 | 13F | Lido Advisors, LLC | 55 447 | −16,40 | 507 | −19,94 | ||||
| 2025-08-14 | 13F | Millennium Management Llc | 0 | −100,00 | 0 | |||||
| 2025-08-15 | 13F | Great West Life Assurance Co /can/ | 89 210 | −2,09 | 1 | |||||
| 2025-08-12 | 13F | Virtu Financial LLC | 23 488 | −47,61 | 0 | |||||
| 2025-08-13 | 13F | Skandinaviska Enskilda Banken AB (publ) | 239 440 | 0,00 | 2 188 | −4,20 | ||||
| 2025-08-14 | 13F | Two Sigma Advisers, Lp | 1 089 200 | −16,72 | 9 955 | −20,21 | ||||
| 2025-07-28 | NP | KBWD - Invesco KBW High Dividend Yield Financial ETF This fund is a listed as child fund of Invesco Ltd. and if that institution has disclosed ownership in this security, then these positions will not be double counted when calculating total shares and total value | 1 034 412 | 3,46 | 9 630 | −7,55 | ||||
| 2025-08-13 | 13F | De Lisle Partners LLP | 15 305 | 0,00 | 140 | −4,79 | ||||
| 2025-08-14 | 13F | Raymond James Financial Inc | 337 247 | 4,26 | 3 082 | −0,10 | ||||
| 2025-08-13 | 13F | Guggenheim Capital Llc | 16 444 | −0,50 | 150 | −4,46 | ||||
| 2025-07-22 | 13F/A | Kingstone Capital Partners Texas, LLC | 16 933 | 13,87 | 155 | 9,15 | ||||
| 2025-07-18 | 13F | Consolidated Portfolio Review Corp | 20 556 | −3,77 | 188 | −7,88 | ||||
| 2025-08-05 | 13F | Hutchens & Kramer Investment Management Group, LLC | 0 | −100,00 | 0 | |||||
| 2025-07-25 | 13F | Cwm, Llc | 11 261 | −10,02 | 0 | |||||
| 2025-08-11 | 13F | Lsv Asset Management | 36 100 | 0,00 | 0 | |||||
| 2025-08-14 | 13F | Verition Fund Management LLC | 38 600 | −23,13 | 353 | −26,51 | ||||
| 2025-08-08 | 13F | ERTS Wealth Advisors, LLC | 0 | −100,00 | 0 | |||||
| 2025-08-14 | 13F | Redwood Financial Network Corp | 16 362 | 0,00 | 150 | −4,49 | ||||
| 2025-07-16 | 13F | Signaturefd, Llc | 7 122 | −28,64 | 65 | −31,58 | ||||
| 2025-08-08 | 13F | Pnc Financial Services Group, Inc. | 759 | 7 | ||||||
| 2025-08-14 | 13F | Mml Investors Services, Llc | 74 970 | 35,49 | 1 | |||||
| 2025-08-14 | 13F | Dimension Capital Management Llc | 584 931 | 8,29 | 5 346 | 3,75 | ||||
| 2025-04-21 | 13F | Nelson, Van Denburg & Campbell Wealth Management Group, LLC | 0 | −100,00 | 0 | |||||
| 2025-08-07 | 13F | Campbell & CO Investment Adviser LLC | 58 776 | 206,09 | 537 | 193,44 | ||||
| 2025-05-15 | 13F | Aquatic Capital Management LLC | 0 | −100,00 | 0 | |||||
| 2025-08-14 | 13F | Ausdal Financial Partners, Inc. | 29 403 | 5,03 | 269 | 0,37 | ||||
| 2025-07-29 | NP | Putnam High Income Securities Fund | 125 637 | −38,27 | 1 170 | −41,37 | ||||
| 2025-08-07 | 13F | PFG Advisors | 12 528 | 115 | ||||||
| 2025-08-14 | 13F | Gotham Asset Management, LLC | 25 000 | 0,00 | 228 | −4,20 | ||||
| 2025-08-14 | 13F | Arete Wealth Advisors, LLC | 36 725 | 0,65 | 0 | |||||
| 2025-08-14 | 13F | Ares Management Llc | 3 797 112 | 5,27 | 34 706 | 0,85 | ||||
| 2025-07-23 | 13F | Citizens National Bank Trust Department | 879 | 0,00 | 8 | 0,00 | ||||
| 2025-07-30 | 13F | Crewe Advisors LLC | 630 | 0,00 | 6 | −16,67 | ||||
| 2025-08-14 | 13F | Mercer Global Advisors Inc /adv | 41 642 | 291,11 | 381 | 276,24 | ||||
| 2025-08-14 | 13F | Sunbelt Securities, Inc. | 52 883 | 8,29 | 506 | 8,82 | ||||
| 2025-05-14 | 13F | Virtus ETF Advisers LLC | 0 | −100,00 | 0 | |||||
| 2025-08-14 | 13F | Kovitz Investment Group Partners, LLC | 1 040 546 | −3,04 | 9 509 | −7,12 | ||||
| 2025-08-12 | 13F | Global Retirement Partners, LLC | 12 964 | 0,00 | 118 | −4,84 | ||||
| 2025-07-21 | 13F | Ameriflex Group, Inc. | 4 091 | −50,18 | 38 | −52,56 | ||||
| 2025-07-18 | 13F | PFG Investments, LLC | 17 044 | 1,27 | 156 | −3,12 | ||||
| 2025-07-31 | 13F | Nilsine Partners, LLC | 90 011 | 823 | ||||||
| 2025-08-14 | 13F | Jane Street Group, Llc | 0 | −100,00 | 0 | |||||
| 2025-07-31 | 13F | MQS Management LLC | 0 | −100,00 | 0 | |||||
| 2025-08-05 | 13F | Simplex Trading, Llc | 0 | −100,00 | 0 | |||||
| 2025-08-14 | 13F | Price T Rowe Associates Inc /md/ | 0 | −100,00 | 0 | |||||
| 2025-08-13 | 13F | OMERS ADMINISTRATION Corp | 0 | −100,00 | 0 | |||||
| 2025-08-07 | 13F | Resources Investment Advisors, LLC. | 32 569 | 188,86 | 298 | 177,57 | ||||
| 2025-08-14 | 13F | Comerica Bank | 238 | 0,00 | 2 | 0,00 | ||||
| 2025-08-29 | 13F | Total Investment Management Inc | 870 | 8 | ||||||
| 2025-08-13 | 13F | Brown Advisory Inc | 13 200 | 0,00 | 121 | −4,00 | ||||
| 2025-08-13 | 13F | Callodine Capital Management, LP | 284 024 | −5,33 | 2 596 | −9,33 | ||||
| 2025-08-11 | 13F | Citigroup Inc | 38 908 | 231,02 | 356 | 216,96 | ||||
| 2025-08-07 | 13F | ProShare Advisors LLC | 18 771 | −5,70 | 172 | −9,52 | ||||
| 2025-07-01 | 13F | Confluence Investment Management Llc | 422 892 | −18,64 | 3 865 | −22,05 | ||||
| 2025-08-14 | 13F | Stifel Financial Corp | 43 423 | −17,40 | 397 | −20,96 | ||||
| 2025-07-31 | 13F | Caitong International Asset Management Co., Ltd | 154 | 1 | ||||||
| 2025-08-08 | 13F | Avantax Advisory Services, Inc. | 17 116 | 3,05 | 156 | −1,27 | ||||
| 2025-07-29 | 13F | Private Trust Co Na | 1 163 | 0,00 | 11 | −9,09 | ||||
| 2025-08-12 | 13F/A | Cozad Asset Management Inc | 15 874 | 0,00 | 145 | −3,97 | ||||
| 2025-08-13 | 13F | Quantbot Technologies LP | 25 792 | 236 | ||||||
| 2025-08-14 | 13F | Tudor Investment Corp Et Al | 405 104 | −14,33 | 3 703 | −17,93 | ||||
| 2025-08-04 | 13F | Kovack Advisors, Inc. | 15 519 | 0,73 | 142 | −3,42 | ||||
| 2025-08-15 | 13F | Tower Research Capital LLC (TRC) | 1 082 | −12,25 | 10 | −18,18 | ||||
| 2025-08-14 | 13F | GWM Advisors LLC | 2 193 | 0,00 | 20 | 0,00 | ||||
| 2025-07-14 | 13F | Sowell Financial Services LLC | 11 498 | −3,37 | 105 | −7,08 | ||||
| 2025-08-12 | 13F | Steward Partners Investment Advisory, Llc | 49 884 | −11,79 | 456 | −15,58 | ||||
| 2025-06-27 | NP | LBO - WHITEWOLF Publicly Listed Private Equity ETF | 13 761 | 14,28 | 120 | −1,65 | ||||
| 2025-08-08 | 13F | SBI Securities Co., Ltd. | 67 | 0,00 | 1 | |||||
| 2025-08-14 | 13F | Hrt Financial Lp | 0 | −100,00 | 0 | |||||
| 2025-08-21 | NP | BIZD - VanEck Vectors BDC Income ETF | 2 074 677 | 2,71 | 18 963 | −1,60 | ||||
| 2025-08-08 | 13F/A | Sterling Capital Management LLC | 2 394 | 22 | ||||||
| 2025-08-13 | 13F | Cresset Asset Management, LLC | 1 571 340 | −19,83 | 14 362 | −23,19 | ||||
| 2025-08-06 | 13F | Wedbush Securities Inc | 24 866 | −18,33 | 0 | |||||
| 2025-07-16 | 13F | Register Financial Advisors LLC | 12 231 | 0,44 | 112 | −4,31 | ||||
| 2025-07-03 | 13F | Garde Capital, Inc. | 190 | 0,00 | 2 | 0,00 | ||||
| 2025-08-28 | NP | Rivernorth Opportunities Fund, Inc. | 149 331 | 1 365 | ||||||
| 2025-08-01 | 13F | Cobblestone Capital Advisors Llc /ny/ | 14 315 | −12,07 | 131 | −16,13 | ||||
| 2025-08-08 | 13F | Cetera Investment Advisers | 82 171 | 8,85 | 751 | 4,31 | ||||
| 2025-07-31 | 13F | Jackson Hole Capital Partners, LLC | 12 055 | 0,00 | 110 | −4,35 | ||||
| 2025-08-12 | 13F | LPL Financial LLC | 280 711 | −4,64 | 2 566 | −8,65 | ||||
| 2025-08-14 | 13F | Lazard Asset Management Llc | 0 | −100,00 | 0 | |||||
| 2025-08-07 | 13F | Hennion & Walsh Asset Management, Inc. | 242 327 | −35,36 | 2 215 | −38,09 | ||||
| 2025-08-14 | 13F | Brevan Howard Capital Management LP | 24 263 | 53,60 | 222 | 47,33 | ||||
| 2025-08-04 | 13F | Creative Financial Designs Inc /adv | 12 790 | −14,18 | 117 | −18,31 | ||||
| 2025-08-13 | 13F/A | StoneX Group Inc. | 11 833 | 102 | ||||||
| 2025-08-05 | 13F | Bard Associates Inc | 67 319 | −0,81 | 615 | −4,95 | ||||
| 2025-08-14 | 13F | D. E. Shaw & Co., Inc. | 0 | −100,00 | 0 | |||||
| 2025-08-05 | 13F | Sigma Planning Corp | 29 155 | 5,80 | 266 | 1,53 | ||||
| 2025-08-06 | 13F | Nicholas Hoffman & Company, LLC. | 14 354 | 0,00 | 131 | −3,68 | ||||
| 2025-08-21 | NP | MOFTX - Mercer Opportunistic Fixed Income Fund Class I | 132 455 | 1 211 | ||||||
| 2025-08-12 | 13F | Entropy Technologies, LP | 10 583 | 97 | ||||||
| 2025-05-16 | 13F | Coppell Advisory Solutions LLC | 0 | −100,00 | 0 | |||||
| 2025-07-02 | 13F | Central Pacific Bank - Trust Division | 14 200 | 0,00 | 130 | −4,44 | ||||
| 2025-07-16 | 13F | Beaumont Financial Advisors, LLC | 16 588 | 3,39 | 152 | −1,31 | ||||
| 2025-07-30 | 13F | Brookstone Capital Management | 12 107 | 0,01 | 111 | −4,35 | ||||
| 2025-08-15 | 13F | CI Private Wealth, LLC | 0 | −100,00 | 0 | |||||
| 2025-07-16 | 13F | BOS Asset Management, LLC | 10 045 | 0,00 | 92 | −4,21 | ||||
| 2025-07-18 | 13F | Bartlett & Co. Wealth Management Llc | 3 000 | 0,00 | 27 | −3,57 | ||||
| 2025-08-14 | 13F | Bank Of America Corp /de/ | 476 325 | 1,80 | 4 354 | −2,46 | ||||
| 2025-08-14 | 13F | Mpwm Advisory Solutions, Llc | 4 240 | 39 | ||||||
| 2025-05-05 | 13F | Hollencrest Capital Management | 0 | −100,00 | 0 | −100,00 | ||||
| 2025-07-07 | 13F | Nova Wealth Management, Inc. | 4 550 | 0,00 | 42 | −4,65 | ||||
| 2025-08-28 | NP | RNCOX - RiverNorth Core Opportunity Fund Class R | 20 561 | −90,59 | 188 | −92,23 | ||||
| 2025-07-16 | 13F | Castleview Partners, Llc | 12 125 | −30,41 | 111 | −33,73 | ||||
| 2025-07-25 | 13F | Sequoia Financial Advisors, LLC | 30 826 | −5,57 | 282 | −9,65 | ||||
| 2025-08-12 | 13F | Financial Advocates Investment Management | 18 854 | 0,00 | 172 | −3,91 | ||||
| 2025-07-29 | 13F | Chicago Partners Investment Group LLC | 20 674 | −13,51 | 198 | −3,41 | ||||
| 2025-08-08 | 13F | Larson Financial Group LLC | 5 314 | −18,50 | 49 | −22,58 | ||||
| 2025-08-14 | 13F | Wealth Preservation Advisors, LLC | 0 | −100,00 | 0 | |||||
| 2025-07-23 | 13F | Kingswood Wealth Advisors, Llc | 0 | −100,00 | 0 | −100,00 | ||||
| 2025-07-30 | 13F | Bogart Wealth, LLC | 412 | 33,77 | 4 | 50,00 | ||||
| 2025-06-27 | NP | MYLD - Cambria Micro and SmallCap Shareholder Yield ETF | 11 269 | −60,56 | 98 | −66,09 | ||||
| 2025-07-30 | 13F | Caliber Wealth Management, LLC / KS | 210 592 | −12,66 | 1 925 | −16,35 | ||||
| 2025-08-12 | 13F | Private Management Group Inc | 3 156 257 | 1,93 | 28 848 | −2,34 | ||||
| 2025-08-14 | 13F | Wiley Bros.-aintree Capital, Llc | 100 086 | 2,07 | 915 | −2,97 | ||||
| 2025-07-29 | 13F | Koshinski Asset Management, Inc. | 43 977 | 0,84 | 402 | −3,61 | ||||
| 2025-08-07 | 13F | Panoramic Investment Advisors, Llc | 10 931 | −42,55 | 100 | −45,30 | ||||
| 2025-08-19 | 13F | Advisory Services Network, LLC | 11 966 | −14,32 | 111 | −17,29 | ||||
| 2025-07-22 | 13F | Merit Financial Group, LLC | 11 091 | 101 | ||||||
| 2025-08-06 | 13F | Golden State Wealth Management, LLC | 7 077 | 269,56 | 65 | 255,56 | ||||
| 2025-07-30 | 13F | Denali Advisors Llc | 134 504 | −2,64 | 1 229 | −6,68 | ||||
| 2025-08-08 | 13F | Bouchey Financial Group Ltd | 10 276 | 0,00 | 94 | −5,10 | ||||
| 2025-08-13 | 13F | Centiva Capital, LP | 0 | −100,00 | 0 | |||||
| 2025-08-13 | 13F | Cambria Investment Management, L.P. | 13 156 | 16,75 | 120 | 12,15 | ||||
| 2025-07-29 | 13F | Empirical Asset Management, LLC | 10 439 | 3,40 | 95 | −1,04 | ||||
| 2025-08-13 | 13F | Quadrant Capital Group Llc | 0 | −100,00 | 0 | |||||
| 2025-08-14 | 13F | Goldman Sachs Group Inc | 0 | −100,00 | 0 | |||||
| 2025-04-29 | 13F | Truist Financial Corp | 0 | −100,00 | 0 | |||||
| 2025-08-19 | 13F | Cape Investment Advisory, Inc. | 3 526 | −54,47 | 32 | −56,16 | ||||
| 2025-07-09 | 13F | Triumph Capital Management | 24 366 | 0,00 | 223 | −4,31 | ||||
| 2025-08-19 | 13F | Newbridge Financial Services Group, Inc. | 9 529 | −3,25 | 87 | −6,45 | ||||
| 2025-08-14 | 13F | Citadel Advisors Llc | 0 | −100,00 | 0 | |||||
| 2025-08-01 | 13F | First National Trust Co | 0 | −100,00 | 0 | |||||
| 2025-08-12 | 13F | Insigneo Advisory Services, Llc | 12 625 | 3,64 | 115 | −0,86 | ||||
| 2025-05-30 | NP | PRISX - T. Rowe Price Financial Services Fund, Inc. This fund is a listed as child fund of Price T Rowe Associates Inc /md/ and if that institution has disclosed ownership in this security, then these positions will not be double counted when calculating total shares and total value | 176 242 | −43,43 | 1 681 | −43,61 | ||||
| 2025-08-01 | 13F | Advisory Alpha, LLC | 11 069 | 2,31 | 101 | −1,94 | ||||
| 2025-08-05 | 13F | Simplex Trading, Llc | Put | 2 000 | −90,15 | 0 | ||||
| 2025-08-05 | 13F | Simplex Trading, Llc | Call | 17 200 | −18,48 | 0 | ||||
| 2025-08-28 | NP | Cliffwater Enhanced Lending Fund | 126 753 | 0,00 | 1 159 | −4,22 | ||||
| 2025-08-06 | 13F | Soltis Investment Advisors LLC | 13 592 | 3,39 | 124 | −0,80 | ||||
| 2025-08-12 | 13F | BlackRock, Inc. | 635 048 | 20,38 | 5 804 | 15,34 |