Grundläggande statistik
| Insiderprofil | PUNCH & ASSOCIATES INVESTMENT MANAGEMENT, INC. |
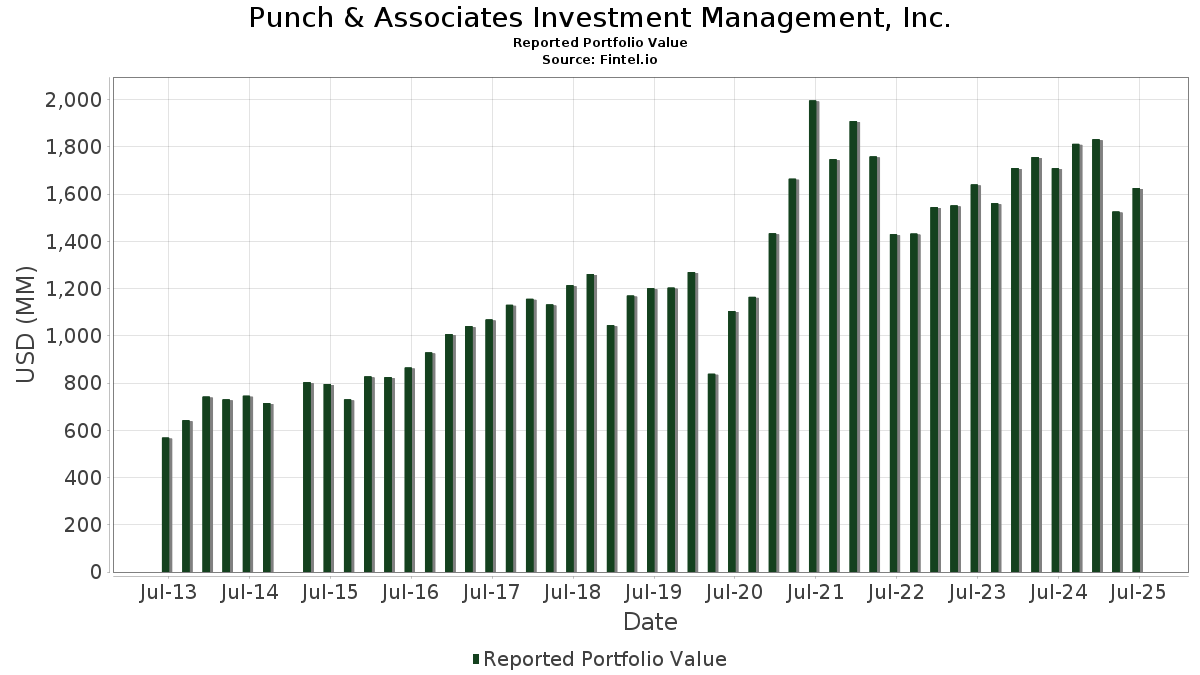
| Portföljvärde | $ 1 625 758 668 |
| Aktuella positioner | 163 |
Senaste innehav, resultat, förvaltat kapital (från 13F, 13D)
Punch & Associates Investment Management, Inc. har redovisat 163 totala innehav i sina senaste SEC-arkiveringar. Det senaste portföljvärdet beräknas vara $ 1 625 758 668 USD. Faktiskt förvaltade tillgångar (AUM) är detta värde plus likvida medel (som inte redovisas). Punch & Associates Investment Management, Inc.s största innehav är StoneX Group Inc. (US:SNEX) , RadNet, Inc. (US:RDNT) , Laureate Education, Inc. (US:LAUR) , Universal Technical Institute, Inc. (US:UTI) , and Global Ship Lease, Inc. (US:GSL) . Punch & Associates Investment Management, Inc.s nya positioner inkluderar CONV. NOTE (US:US94419LAM37) , CONV. NOTE (US:US87918AAF21) , Nature's Sunshine Products, Inc. (US:NATR) , American Public Education, Inc. (US:APEI) , and QXO, Inc. - Preferred Security (US:QXO.PRB) . Punch & Associates Investment Management, Inc.s främsta industrier är "Tobacco Products" (sic 21) , "Restaurants, Dining, Eating And Drinking Places" (sic 58) , and "Wholesale Trade-durable Goods" (sic 50) .
Största ökningarna detta kvartal
Vi använder förändringen i portföljallokeringen eftersom det är det mest meningsfulla måttet. Förändringar kan bero på transaktioner eller förändringar i aktiekurser.
| Värdepapper | Aktier (MM) |
Värde (MM$) |
Portfölj % av | ΔPortfölj % av |
|---|---|---|---|---|
| 0,34 | 12,77 | 0,7857 | 0,7857 | |
| 0,77 | 21,07 | 1,2958 | 0,5615 | |
| 1,87 | 15,89 | 0,9775 | 0,5179 | |
| 0,79 | 21,00 | 1,2919 | 0,4992 | |
| 1,59 | 14,18 | 0,8719 | 0,4200 | |
| 0,01 | 20,38 | 1,2535 | 0,3941 | |
| 0,05 | 5,60 | 0,3442 | 0,3442 | |
| 0,65 | 15,45 | 0,9502 | 0,3338 | |
| 1,02 | 34,44 | 2,1183 | 0,2923 | |
| 0,08 | 17,87 | 1,0994 | 0,2745 |
Största minskningarna detta kvartal
Vi använder förändringen i portföljallokeringen eftersom det är det mest meningsfulla måttet. Förändringar kan bero på transaktioner eller förändringar i aktiepriser.
| Värdepapper | Aktier (MM) |
Värde (MM$) |
Portfölj % av | ΔPortfölj % av |
|---|---|---|---|---|
| 1,07 | 26,41 | 1,6247 | −0,3947 | |
| 0,17 | 10,36 | 0,6370 | −0,3791 | |
| 0,55 | 15,11 | 0,9292 | −0,3655 | |
| 1,24 | 5,93 | 0,3647 | −0,3312 | |
| 0,04 | 18,54 | 1,1403 | −0,3076 | |
| 0,09 | 15,28 | 0,9398 | −0,3031 | |
| 1,78 | 15,38 | 0,9458 | −0,2691 | |
| 0,81 | 10,54 | 0,6485 | −0,2482 | |
| 0,59 | 13,45 | 0,8275 | −0,2333 | |
| 0,48 | 3,76 | 0,2312 | −0,2320 |
13D/G-arkiveringar
Detta är en lista över 13D- och 13G-arkiveringar som gjorts under det senaste året (om några). Klicka på länken för att se hela transaktionshistoriken. Gröna rader indikerar nya positioner. Röda rader indikerar stängda positioner.
| Fil Datum | Formulär | Värdepapper | Föregående aktier |
Aktuella aktier |
ΔAktier % | % Ägande |
% ΔÄgande | |
|---|---|---|---|---|---|---|---|---|
| 2025-08-14 | RFIL / RF Industries, Ltd. | 678 797 | 810 859 | 19,46 | 7,60 | 18,75 | ||
| 2025-08-14 | OPXS / Optex Systems Holdings, Inc | 372 500 | 331 495 | −11,01 | 4,80 | −11,11 | ||
| 2025-08-14 | DSP / Viant Technology Inc. | 989 771 | 1 155 133 | 16,71 | 7,30 | 19,67 | ||
| 2025-05-15 | SYZLF / Sylogist Ltd. | 1 319 500 | 968 000 | −26,64 | 4,10 | −26,79 | ||
| 2025-05-15 | ALOT / AstroNova, Inc. | 495 951 | 301 429 | −39,22 | 4,00 | −40,30 | ||
| 2025-05-15 | FC / Franklin Covey Co. | 679 100 | 586 071 | −13,70 | 4,40 | −15,38 | ||
| 2025-05-15 | PHX / PHX Minerals Inc. | 2 745 884 | 1 582 234 | −42,38 | 4,20 | −43,24 | ||
| 2025-04-07 | HBIO / Harvard Bioscience, Inc. | 2 918 034 | 25 586 | −99,12 | 0,10 | −98,53 | ||
| 2025-02-14 | RSSS / Research Solutions, Inc. | 2 330 120 | 7,20 | |||||
| 2024-11-14 | BXC / BlueLinx Holdings Inc. | 438 760 | 377 253 | −14,02 | 4,40 | −12,00 | ||
| 2024-11-14 | NTIC / Northern Technologies International Corporation | 519 184 | 249 857 | −51,88 | 2,60 | −52,73 | ||
| 2024-11-14 | GSL / Global Ship Lease, Inc. | 1 920 752 | 1 363 704 | −29,00 | 3,90 | −29,09 |
13F- och fond arkiveringar
Denna blankett lämnades in den 2025-08-14 för rapporteringsperioden 2025-06-30. Klicka på länksymbolen för att se hela transaktionshistoriken.
Uppgradera för att låsa upp premiumdata och exportera till Excel![]() .
.
| Värdepapper | Typ | Genomsnittligt aktiepris | Aktier (MM) |
ΔAktier (%) |
ΔAktier (%) |
Värde ($MM) |
Portfölj (%) |
ΔPortfölj (%) |
|
|---|---|---|---|---|---|---|---|---|---|
| SNEX / StoneX Group Inc. | 0,73 | −13,88 | 66,21 | 2,76 | 4,0723 | −0,1496 | |||
| RDNT / RadNet, Inc. | 0,70 | 0,44 | 39,68 | 14,96 | 2,4408 | 0,1789 | |||
| LAUR / Laureate Education, Inc. | 1,50 | 0,84 | 35,11 | 15,29 | 2,1597 | 0,1639 | |||
| UTI / Universal Technical Institute, Inc. | 1,02 | −6,35 | 34,44 | 23,59 | 2,1183 | 0,2923 | |||
| GSL / Global Ship Lease, Inc. | 1,20 | 0,48 | 31,64 | 15,70 | 1,9463 | 0,1542 | |||
| ACA / Arcosa, Inc. | 0,36 | 0,61 | 31,54 | 13,12 | 1,9403 | 0,1130 | |||
| VRRM / Verra Mobility Corporation | 1,13 | 0,63 | 28,66 | 13,50 | 1,7628 | 0,1082 | |||
| SFM / Sprouts Farmers Market, Inc. | 0,17 | −9,56 | 28,27 | −2,45 | 1,7389 | −0,1602 | |||
| SILA / Sila Realty Trust, Inc. | 1,13 | 6,54 | 26,83 | −5,58 | 1,6506 | −0,2119 | |||
| ATEN / A10 Networks, Inc. | 1,38 | 1,00 | 26,62 | 19,60 | 1,6376 | 0,1789 | |||
| PDX / PIMCO Dynamic Income Strategy Fund | 1,07 | −14,67 | 26,41 | −14,29 | 1,6247 | −0,3947 | |||
| GOOGL / Alphabet Inc. | 0,14 | 2,90 | 24,35 | 17,26 | 1,4980 | 0,1370 | |||
| BXC / BlueLinx Holdings Inc. | 0,32 | −0,39 | 24,08 | −1,19 | 1,4810 | −0,1158 | |||
| VTS / Vitesse Energy, Inc. | 1,08 | 5,82 | 23,85 | −4,94 | 1,4672 | −0,1771 | |||
| GRBK / Green Brick Partners, Inc. | 0,37 | −5,13 | 23,26 | 2,31 | 1,4308 | −0,0591 | |||
| RPRX / Royalty Pharma plc | 0,60 | 3,90 | 21,47 | 20,25 | 1,3208 | 0,1507 | |||
| KKR / KKR & Co. Inc. | 0,16 | 4,30 | 21,20 | 20,02 | 1,3039 | 0,1465 | |||
| IIIV / i3 Verticals, Inc. | 0,77 | 68,76 | 21,07 | 88,00 | 1,2958 | 0,5615 | |||
| PARR / Par Pacific Holdings, Inc. | 0,79 | −6,67 | 21,00 | 73,64 | 1,2919 | 0,4992 | |||
| MELI / MercadoLibre, Inc. | 0,01 | 15,99 | 20,38 | 55,40 | 1,2535 | 0,3941 | |||
| FIBK / First Interstate BancSystem, Inc. | 0,69 | 17,89 | 19,99 | 18,59 | 1,2297 | 0,1250 | |||
| APAM / Artisan Partners Asset Management Inc. | 0,44 | 0,58 | 19,49 | 14,03 | 1,1987 | 0,0788 | |||
| CVCO / Cavco Industries, Inc. | 0,04 | 0,36 | 18,54 | −16,09 | 1,1403 | −0,3076 | |||
| BV / BrightView Holdings, Inc. | 1,09 | 0,75 | 18,22 | 30,64 | 1,1209 | 0,2068 | |||
| MSFT / Microsoft Corporation | 0,04 | 4,35 | 18,22 | 38,27 | 1,1207 | 0,2572 | |||
| PLOW / Douglas Dynamics, Inc. | 0,61 | 0,65 | 18,05 | 27,69 | 1,1105 | 0,1840 | |||
| ORCL / Oracle Corporation | 0,08 | −9,20 | 17,87 | 41,99 | 1,0994 | 0,2745 | |||
| JPM / JPMorgan Chase & Co. | 0,06 | 4,11 | 17,28 | 23,04 | 1,0626 | 0,1425 | |||
| ALG / Alamo Group Inc. | 0,07 | 1,32 | 15,92 | 24,16 | 0,9794 | 0,1390 | |||
| NPKI / NPK International Inc. | 1,87 | 54,70 | 15,89 | 126,59 | 0,9775 | 0,5179 | |||
| PSMT / PriceSmart, Inc. | 0,15 | 1,33 | 15,88 | 21,15 | 0,9769 | 0,1179 | |||
| TDW / Tidewater Inc. | 0,34 | 1,01 | 15,67 | 10,24 | 0,9638 | 0,0323 | |||
| LQDT / Liquidity Services, Inc. | 0,65 | 115,87 | 15,45 | 64,22 | 0,9502 | 0,3338 | |||
| ULTA / Ulta Beauty, Inc. | 0,03 | 4,21 | 15,39 | 33,01 | 0,9464 | 0,1883 | |||
| WTTR / Select Water Solutions, Inc. | 1,78 | 0,79 | 15,38 | −17,06 | 0,9458 | −0,2691 | |||
| DSP / Viant Technology Inc. | 1,16 | 16,71 | 15,28 | 24,42 | 0,9400 | 0,1351 | |||
| FI / Fiserv, Inc. | 0,09 | 3,18 | 15,28 | −19,44 | 0,9398 | −0,3031 | |||
| BG / Bunge Global SA | 0,19 | 3,30 | 15,17 | 8,52 | 0,9331 | 0,0170 | |||
| HSTM / HealthStream, Inc. | 0,55 | −11,07 | 15,11 | −23,54 | 0,9292 | −0,3655 | |||
| SPNT / SiriusPoint Ltd. | 0,74 | 1,68 | 15,01 | 19,91 | 0,9234 | 0,1030 | |||
| BRK.B / Berkshire Hathaway Inc. | 0,03 | 4,06 | 14,94 | −5,08 | 0,9187 | −0,1125 | |||
| BLDR / Builders FirstSource, Inc. | 0,13 | 4,39 | 14,92 | −2,50 | 0,9176 | −0,0851 | |||
| RTO / Rentokil Initial plc - Depositary Receipt (Common Stock) | 0,60 | 3,59 | 14,34 | 8,57 | 0,8822 | 0,0165 | |||
| CSW / CSW Industrials, Inc. | 0,05 | 1,72 | 14,25 | 0,09 | 0,8764 | −0,0565 | |||
| DIS / The Walt Disney Company | 0,11 | 3,86 | 14,24 | 30,50 | 0,8760 | 0,1609 | |||
| LZ / LegalZoom.com, Inc. | 1,59 | 98,60 | 14,18 | 105,52 | 0,8719 | 0,4200 | |||
| AMP / Ameriprise Financial, Inc. | 0,03 | 1,38 | 14,15 | 11,77 | 0,8707 | 0,0408 | |||
| IQV / IQVIA Holdings Inc. | 0,09 | 26,76 | 13,74 | 13,31 | 0,8449 | 0,0505 | |||
| CLMB / Climb Global Solutions, Inc. | 0,13 | −1,47 | 13,72 | −4,89 | 0,8440 | −0,1014 | |||
| FC / Franklin Covey Co. | 0,59 | 0,59 | 13,45 | −16,90 | 0,8275 | −0,2333 | |||
| ADUS / Addus HomeCare Corporation | 0,11 | 0,92 | 12,82 | 17,55 | 0,7886 | 0,0739 | |||
| TREE / LendingTree, Inc. | 0,34 | 12,77 | 0,7857 | 0,7857 | |||||
| KMI / Kinder Morgan, Inc. | 0,42 | 4,47 | 12,48 | 7,66 | 0,7675 | 0,0080 | |||
| HLMN / Hillman Solutions Corp. | 1,74 | 0,70 | 12,44 | −18,20 | 0,7652 | −0,2314 | |||
| MDXG / MiMedx Group, Inc. | 1,97 | 13,53 | 12,06 | −8,73 | 0,7419 | −0,1241 | |||
| DE / Deere & Company | 0,02 | 4,22 | 11,78 | 12,91 | 0,7244 | 0,0409 | |||
| PBPB / Potbelly Corporation | 0,95 | 13,97 | 11,69 | 46,80 | 0,7191 | 0,1973 | |||
| TMO / Thermo Fisher Scientific Inc. | 0,03 | 3,23 | 11,00 | −15,88 | 0,6769 | −0,1805 | |||
| HCKT / The Hackett Group, Inc. | 0,43 | 4,06 | 10,86 | −9,47 | 0,6683 | −0,1182 | |||
| EOG / EOG Resources, Inc. | 0,09 | 17,57 | 10,67 | 9,65 | 0,6561 | 0,0187 | |||
| EFC / Ellington Financial Inc. | 0,81 | −21,35 | 10,54 | −22,96 | 0,6485 | −0,2482 | |||
| BRSP / BrightSpire Capital, Inc. | 2,05 | 11,76 | 10,36 | 1,51 | 0,6374 | −0,0316 | |||
| SKY / Champion Homes, Inc. | 0,17 | 1,08 | 10,36 | −33,22 | 0,6370 | −0,3791 | |||
| CARR / Carrier Global Corporation | 0,14 | 4,00 | 10,29 | 20,07 | 0,6328 | 0,0713 | |||
| WM / Waste Management, Inc. | 0,04 | 4,66 | 10,25 | 3,44 | 0,6306 | −0,0188 | |||
| RSG / Republic Services, Inc. | 0,04 | −16,12 | 10,25 | −14,58 | 0,6303 | −0,1558 | |||
| MTCH / Match Group, Inc. | 0,32 | 3,04 | 10,00 | 2,02 | 0,6149 | −0,0273 | |||
| LINC / Lincoln Educational Services Corporation | 0,43 | −11,28 | 10,00 | 28,85 | 0,6148 | 0,1065 | |||
| ACN / Accenture plc | 0,03 | 3,98 | 9,92 | −0,40 | 0,6099 | −0,0425 | |||
| SSNC / SS&C Technologies Holdings, Inc. | 0,12 | 3,92 | 9,86 | 3,01 | 0,6064 | −0,0207 | |||
| HYI / Western Asset High Yield Opportunity Fund Inc. | 0,81 | 0,00 | 9,66 | 1,18 | 0,5943 | −0,0314 | |||
| LEGH / Legacy Housing Corporation | 0,42 | 0,00 | 9,51 | −10,15 | 0,5847 | −0,1086 | |||
| ARHS / Arhaus, Inc. | 1,08 | 0,01 | 9,36 | −0,33 | 0,5756 | −0,0397 | |||
| PHLT / Performant Healthcare, Inc. | 2,26 | 9,50 | 9,03 | 47,99 | 0,5556 | 0,1556 | |||
| ELV / Elevance Health, Inc. | 0,02 | 4,18 | 9,01 | −6,84 | 0,5542 | −0,0795 | |||
| TGT / Target Corporation | 0,09 | 2,96 | 8,55 | −2,69 | 0,5260 | −0,0498 | |||
| JNJ / Johnson & Johnson | 0,06 | 4,08 | 8,55 | −4,13 | 0,5256 | −0,0585 | |||
| FTHY / First Trust High Yield Opportunities 2027 Term Fund | 0,56 | 0,50 | 8,30 | 3,29 | 0,5103 | −0,0161 | |||
| BXMT / Blackstone Mortgage Trust, Inc. | 0,43 | 17,80 | 8,28 | 13,38 | 0,5093 | 0,0307 | |||
| SHOO / Steven Madden, Ltd. | 0,33 | 0,92 | 7,92 | −9,16 | 0,4874 | −0,0842 | |||
| GLRE / Greenlight Capital Re, Ltd. | 0,54 | −7,51 | 7,82 | −1,91 | 0,4811 | −0,0414 | |||
| CLFD / Clearfield, Inc. | 0,18 | 0,00 | 7,68 | 46,06 | 0,4726 | 0,1279 | |||
| GAMB / Gambling.com Group Limited | 0,62 | 6,37 | 7,35 | 0,22 | 0,4519 | −0,0285 | |||
| BA.PRA / The Boeing Company - Preferred Security | 0,11 | 1,65 | 7,21 | 15,53 | 0,4433 | 0,0345 | |||
| MYFW / First Western Financial, Inc. | 0,31 | 49,54 | 7,10 | 71,70 | 0,4367 | 0,1657 | |||
| CIVI / Civitas Resources, Inc. | 0,26 | −9,84 | 7,10 | −28,89 | 0,4365 | −0,2174 | |||
| AGYS / Agilysys, Inc. | 0,06 | 0,67 | 7,09 | 59,11 | 0,4361 | 0,1441 | |||
| RSSS / Research Solutions, Inc. | 2,42 | 2,13 | 6,94 | 12,72 | 0,4269 | 0,0235 | |||
| BWB / Bridgewater Bancshares, Inc. | 0,42 | 10,85 | 6,75 | 26,98 | 0,4149 | 0,0668 | |||
| ACIC / American Coastal Insurance Corporation | 0,60 | 30,95 | 6,63 | 25,87 | 0,4079 | 0,0626 | |||
| CVEO / Civeo Corporation | 0,27 | 0,00 | 6,31 | 0,40 | 0,3884 | −0,0238 | |||
| CSV / Carriage Services, Inc. | 0,13 | 45,02 | 6,07 | 71,20 | 0,3733 | 0,1410 | |||
| T / AT&T Inc. | 0,21 | −32,68 | 6,03 | −31,11 | 0,3708 | −0,2026 | |||
| NEOG / Neogen Corporation | 1,24 | 1,28 | 5,93 | −44,17 | 0,3647 | −0,3312 | |||
| RMT / Royce Micro-Cap Trust, Inc. | 0,62 | 1,05 | 5,70 | 10,86 | 0,3509 | 0,0137 | |||
| DUK / Duke Energy Corporation | 0,05 | 5,60 | 0,3442 | 0,3442 | |||||
| UFPT / UFP Technologies, Inc. | 0,02 | 0,00 | 5,54 | 21,06 | 0,3409 | 0,0409 | |||
| INFU / InfuSystem Holdings, Inc. | 0,88 | 42,93 | 5,48 | 65,79 | 0,3372 | 0,1205 | |||
| HGBL / Heritage Global Inc. | 2,45 | −0,02 | 5,45 | 1,81 | 0,3351 | −0,0155 | |||
| US94419LAM37 / CONV. NOTE | 5,42 | 0,26 | 0,3337 | −0,0209 | |||||
| RFIL / RF Industries, Ltd. | 0,81 | 19,46 | 5,25 | 64,81 | 0,3227 | 0,1141 | |||
| ETSY / Etsy, Inc. | 0,10 | 0,62 | 5,15 | 6,98 | 0,3167 | 0,0013 | |||
| TRNS / Transcat, Inc. | 0,06 | 0,00 | 4,95 | 15,46 | 0,3042 | 0,0235 | |||
| US87918AAF21 / CONV. NOTE | 4,67 | 1,22 | 0,2870 | −0,0151 | |||||
| DHIL / Diamond Hill Investment Group, Inc. | 0,03 | −20,70 | 4,60 | −19,34 | 0,2832 | −0,0908 | |||
| ALEX / Alexander & Baldwin, Inc. | 0,26 | 2,41 | 4,59 | 5,98 | 0,2824 | −0,0015 | |||
| LADR / Ladder Capital Corp | 0,42 | −31,39 | 4,53 | −35,36 | 0,2788 | −0,1807 | |||
| NATR / Nature's Sunshine Products, Inc. | 0,30 | 4,44 | 0,2729 | 0,2729 | |||||
| APEI / American Public Education, Inc. | 0,15 | 4,42 | 0,2720 | 0,2720 | |||||
| LRFC / Logan Ridge Finance Corporation | 0,23 | 0,00 | 4,33 | −13,70 | 0,2663 | −0,0624 | |||
| AMLP / ALPS ETF Trust - Alerian MLP ETF | 0,09 | −39,53 | 4,27 | −43,12 | 0,2625 | −0,2291 | |||
| VMD / Viemed Healthcare, Inc. | 0,61 | 5,69 | 4,24 | 0,31 | 0,2605 | −0,0161 | |||
| NVEC / NVE Corporation | 0,06 | 0,00 | 4,05 | 15,47 | 0,2493 | 0,0193 | |||
| OPXS / Optex Systems Holdings, Inc | 0,33 | −11,01 | 3,81 | 80,05 | 0,2343 | 0,0956 | |||
| TTGT / TechTarget, Inc. | 0,48 | 1,36 | 3,76 | −46,82 | 0,2312 | −0,2320 | |||
| ALNT / Allient Inc. | 0,10 | −13,56 | 3,70 | 42,81 | 0,2278 | 0,0578 | |||
| TCMD / Tactile Systems Technology, Inc. | 0,36 | 29,43 | 3,70 | −0,72 | 0,2277 | −0,0166 | |||
| GHM / Graham Corporation | 0,07 | −3,93 | 3,63 | 65,04 | 0,2231 | 0,0791 | |||
| ELMD / Electromed, Inc. | 0,16 | 0,00 | 3,60 | −7,84 | 0,2213 | −0,0345 | |||
| QXO.PRB / QXO, Inc. - Preferred Security | 0,06 | 3,52 | 0,2165 | 0,2165 | |||||
| US52603BAD91 / CONV. NOTE | 3,48 | −2,30 | 0,2142 | −0,0193 | |||||
| KKR.PRD / KKR & Co. Inc. - Preferred Stock | 0,06 | 2,12 | 3,21 | 10,82 | 0,1973 | 0,0076 | |||
| ISSC / Innovative Solutions and Support, Inc. | 0,21 | 0,00 | 2,91 | 120,76 | 0,1793 | 0,0927 | |||
| ALOT / AstroNova, Inc. | 0,25 | −16,76 | 2,91 | 4,95 | 0,1789 | −0,0027 | |||
| TURN / 180 Degree Capital Corp. | 0,71 | 0,00 | 2,84 | 0,07 | 0,1746 | −0,0112 | |||
| KEQU / Kewaunee Scientific Corporation | 0,04 | 116,50 | 2,54 | 222,87 | 0,1563 | 0,1047 | |||
| AVNW / Aviat Networks, Inc. | 0,10 | −52,50 | 2,45 | −40,42 | 0,1508 | −0,1188 | |||
| IDR / Idaho Strategic Resources, Inc. | 0,18 | 2,39 | 0,1469 | 0,1469 | |||||
| TAYD / Taylor Devices, Inc. | 0,05 | 2,32 | 2,17 | 37,69 | 0,1335 | 0,0301 | |||
| FLXS / Flexsteel Industries, Inc. | 0,06 | 39,98 | 2,16 | 38,17 | 0,1330 | 0,0304 | |||
| LFT / Lument Finance Trust, Inc. | 0,90 | −9,83 | 1,99 | −23,64 | 0,1222 | −0,0483 | |||
| PLBC / Plumas Bancorp | 0,04 | 0,00 | 1,95 | 2,74 | 0,1202 | −0,0044 | |||
| NRIM / Northrim BanCorp, Inc. | 0,02 | 1,85 | 0,1137 | 0,1137 | |||||
| HCI / HCI Group, Inc. | 0,01 | 0,00 | 1,83 | 2,01 | 0,1123 | −0,0050 | |||
| LGCY / Legacy Education Inc. | 0,16 | 88,01 | 1,79 | 193,27 | 0,1099 | 0,0700 | |||
| RCMT / RCM Technologies, Inc. | 0,08 | 0,80 | 1,78 | 52,22 | 0,1096 | 0,0329 | |||
| IWV / iShares Trust - iShares Russell 3000 ETF | 0,00 | 1,32 | 1,64 | 12,01 | 0,1009 | 0,0049 | |||
| ACCS / ACCESS Newswire Inc. | 0,13 | 2,64 | 1,58 | 43,06 | 0,0971 | 0,0247 | |||
| KRT / Karat Packaging Inc. | 0,06 | 4,67 | 1,58 | 10,83 | 0,0970 | 0,0038 | |||
| EPSN / Epsilon Energy Ltd. | 0,21 | 0,00 | 1,56 | 4,49 | 0,0959 | −0,0018 | |||
| PDEX / Pro-Dex, Inc. | 0,03 | −36,67 | 1,49 | −44,27 | 0,0918 | −0,0836 | |||
| NBN / Northeast Bank | 0,02 | 40,65 | 1,34 | 36,77 | 0,0824 | 0,0182 | |||
| DSGR / Distribution Solutions Group, Inc. | 0,05 | −66,11 | 1,25 | −66,76 | 0,0767 | −0,1691 | |||
| MAMA / Mama's Creations, Inc. | 0,13 | 0,00 | 1,08 | 27,54 | 0,0664 | 0,0109 | |||
| VBR / Vanguard Index Funds - Vanguard Small-Cap Value ETF | 0,00 | 39,58 | 0,31 | 46,26 | 0,0193 | 0,0052 | |||
| JEF / Jefferies Financial Group Inc. | 0,01 | 0,29 | 0,0177 | 0,0177 | |||||
| TLNE / Talen Energy Corporation | 0,00 | 0,27 | 0,0166 | 0,0166 | |||||
| QRHC / Quest Resource Holding Corporation | 0,12 | −65,90 | 0,23 | −73,52 | 0,0143 | −0,0432 | |||
| KD / Kyndryl Holdings, Inc. | 0,01 | 0,22 | 0,0137 | 0,0137 | |||||
| VTI / Vanguard Index Funds - Vanguard Total Stock Market ETF | 0,00 | 67,23 | 0,21 | 84,96 | 0,0129 | 0,0055 | |||
| FFWM / First Foundation Inc. | 0,03 | 77,07 | 0,14 | 75,31 | 0,0088 | 0,0034 | |||
| VOO / Vanguard Index Funds - Vanguard S&P 500 ETF | 0,00 | 108,06 | 0,07 | 135,48 | 0,0045 | 0,0024 | |||
| IWC / iShares Trust - iShares Micro-Cap ETF | 0,00 | 0,00 | 0,05 | 15,00 | 0,0029 | 0,0002 | |||
| IWM / iShares Trust - iShares Russell 2000 ETF | 0,00 | 0,00 | 0,03 | 11,11 | 0,0019 | 0,0000 | |||
| AGG / iShares Trust - iShares Core U.S. Aggregate Bond ETF | 0,00 | 0,00 | 0,03 | 0,00 | 0,0018 | −0,0001 | |||
| SUSA / iShares Trust - iShares ESG Optimized MSCI USA ETF | 0,00 | 0,00 | 0,02 | 14,29 | 0,0015 | 0,0001 | |||
| IVV / iShares Trust - iShares Core S&P 500 ETF | 0,00 | 0,00 | 0,02 | 13,33 | 0,0011 | 0,0000 | |||
| IJR / iShares Trust - iShares Core S&P Small-Cap ETF | 0,00 | 0,00 | 0,01 | 11,11 | 0,0006 | −0,0000 | |||
| HYG / iShares Trust - iShares iBoxx $ High Yield Corporate Bond ETF | 0,00 | 0,00 | 0,01 | 0,00 | 0,0005 | −0,0000 | |||
| IEFA / iShares Trust - iShares Core MSCI EAFE ETF | 0,00 | 0,00 | 0,01 | 0,00 | 0,0003 | 0,0000 | |||
| LQD / iShares Trust - iShares iBoxx $ Investment Grade Corporate Bond ETF | 0,00 | 0,00 | 0,00 | 0,00 | 0,0003 | −0,0000 | |||
| IVE / iShares Trust - iShares S&P 500 Value ETF | 0,00 | 0,00 | 0,00 | 0,00 | 0,0002 | −0,0000 | |||
| ITB / iShares Trust - iShares U.S. Home Construction ETF | 0,00 | 0,00 | 0,0002 | 0,0002 | |||||
| BXSL / Blackstone Secured Lending Fund | 0,00 | −100,00 | 0,00 | 0,0000 | |||||
| PHX / PHX Minerals Inc. | 0,00 | −100,00 | 0,00 | 0,0000 | |||||
| AGNC / AGNC Investment Corp. | 0,00 | −100,00 | 0,00 | 0,0000 | |||||
| CLVT / Clarivate Plc | 0,00 | −100,00 | 0,00 | 0,0000 | |||||
| SAMG / Silvercrest Asset Management Group Inc. | 0,00 | −100,00 | 0,00 | 0,0000 | |||||
| DLHC / DLH Holdings Corp. | 0,00 | −100,00 | 0,00 | 0,0000 | |||||
| XPEL / XPEL, Inc. | 0,00 | −100,00 | 0,00 | 0,0000 | |||||
| NTIC / Northern Technologies International Corporation | 0,00 | −100,00 | 0,00 | 0,0000 | |||||
| CSWC / Capital Southwest Corporation | 0,00 | −100,00 | 0,00 | 0,0000 | |||||
| KW / Kennedy-Wilson Holdings, Inc. | 0,00 | −100,00 | 0,00 | 0,0000 | |||||
| HBIO / Harvard Bioscience, Inc. | 0,00 | −100,00 | 0,00 | 0,0000 | |||||
| DCGO / DocGo Inc. | 0,00 | −100,00 | 0,00 | 0,0000 |