Grundläggande statistik
| Institutionella ägare | 363 total, 362 long only, 0 short only, 1 long/short - change of 6,12% MRQ |
| Genomsnittlig portföljallokering | 0.3688 % - change of −14,29% MRQ |
| Institutionella aktier (lång) | 19 173 729 (ex 13D/G) - change of 0,46MM shares 2,48% MRQ |
| Institutionellt värde (lång) | $ 2 309 205 USD ($1000) |
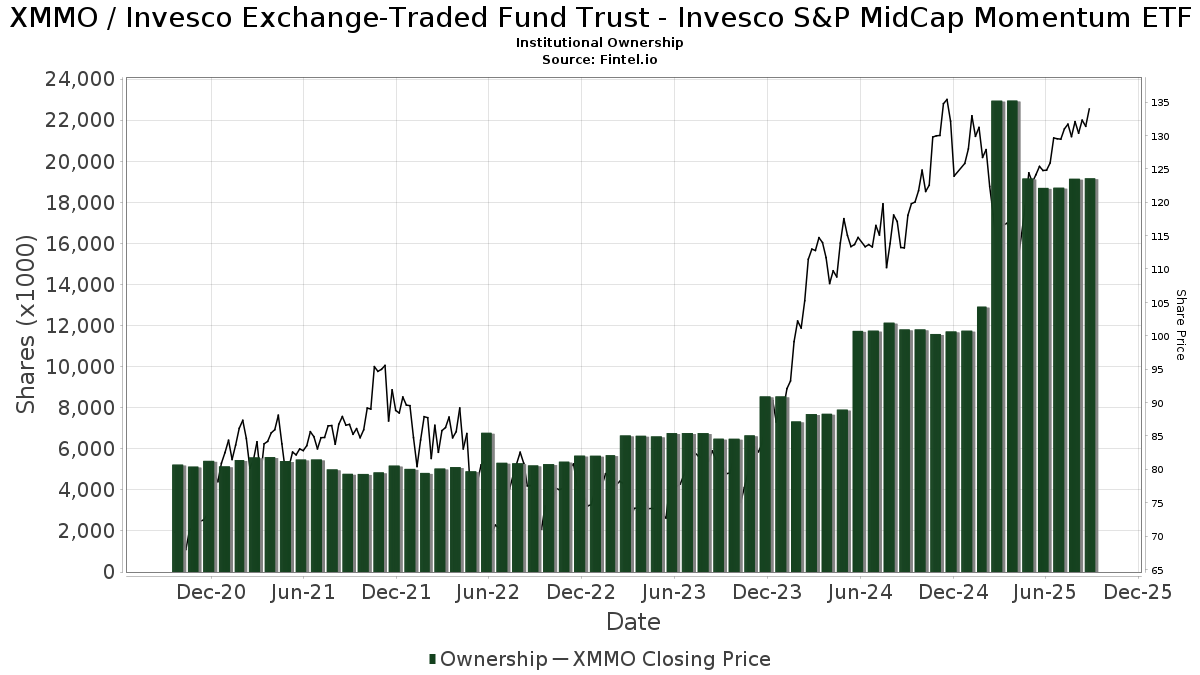
Institutionellt ägande och aktieägare
Invesco Exchange-Traded Fund Trust - Invesco S&P MidCap Momentum ETF (US:XMMO) har 363 Institutionella ägare och aktieägare som har lämnat in 13D/G- eller 13F-formulär till Securities Exchange Commission (SEC). Dessa institut innehar totalt 19,173,729 aktier. Största aktieägare inkluderar LPL Financial LLC, Morgan Stanley, Wells Fargo & Company/mn, Northwestern Mutual Wealth Management Co, Raymond James Financial Inc, Ameriprise Financial Inc, Bank Of America Corp /de/, Mainstay Capital Management Llc /adv, Cetera Investment Advisers, and Money Concepts Capital Corp .
Invesco Exchange-Traded Fund Trust - Invesco S&P MidCap Momentum ETF (ARCA:XMMO) Institutionell ägarstruktur visar institutioners och fonders nuvarande positioner i företaget, samt de senaste förändringarna i positionernas storlek. Större aktieägare kan vara enskilda investerare, fonder, hedgefonder eller institutioner. Bilaga 13D visar att investeraren äger (eller ägde) mer än 5% av företaget och avser (eller avsåg) att aktivt eftersträva en förändring av affärsstrategin. Schedule 13G indikerar en passiv investering på över 5%.
The share price as of September 12, 2025 is 135,03 / share. Previously, on September 16, 2024, the share price was 117,73 / share. This represents an increase of 14,69% over that period.
Fondsentimentets poäng
Fondsentimentet poängen(fka Ägarackumulation-poäng) visar vilka aktier som är mest köpta av fonder. Det är resultatet av en sofistikerad kvantitativ flerfaktormodell som identifierar företag med de högsta nivåerna av institutionell ackumulering. Poängsättningsmodellen använder en kombination av den totala ökningen av redovisade ägare, förändringarna i portföljallokeringarna för dessa ägare och andra mått. Siffran sträcker sig från 0 till 100, där högre siffror indikerar en högre nivå av ackumulering i förhållande till sina konkurrenter, och 50 är genomsnittet.
Uppdateringsfrekvens: Dagligen
Se Ownership Explorer, som innehåller en lista över de högst rankade företagen.
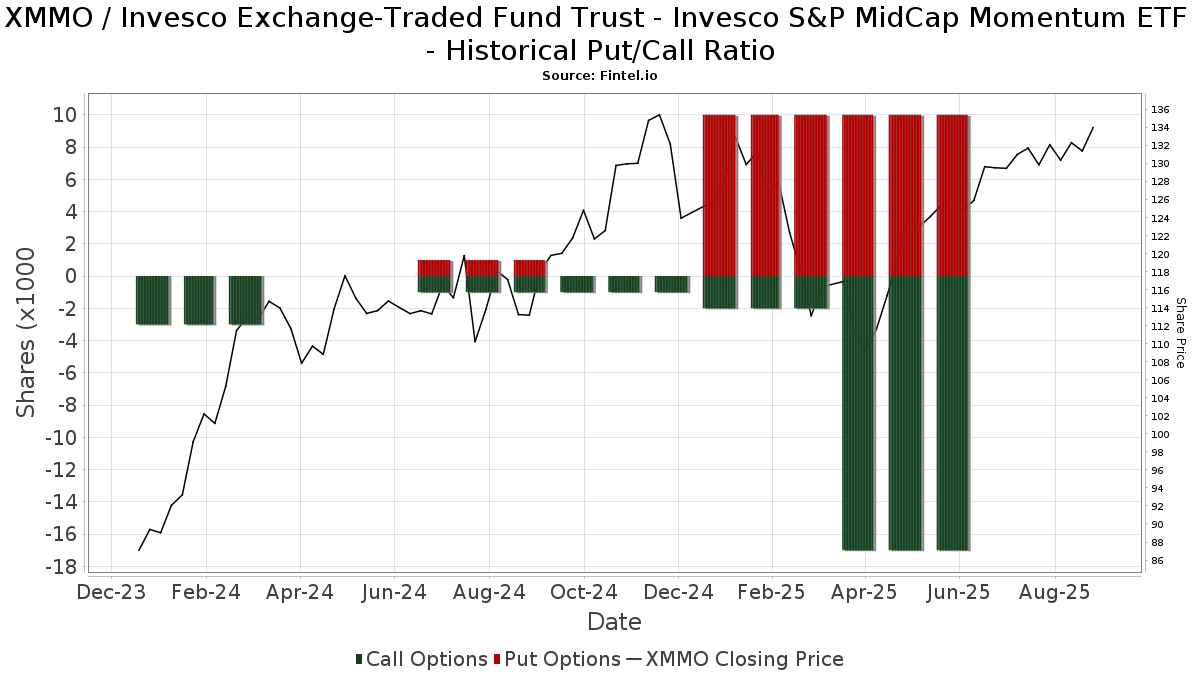
Institutionell sälj/köp-kvot
Förutom att rapportera vanliga eget kapital- och skuldemissioner måste institutioner med mer än 100MM tillgångar under förvaltning också avslöja sina innehav av sälj- och köpoptioner. Eftersom säljoptioner i allmänhet indikerar ett negativt sentiment och köpoptioner indikerar ett positivt sentiment, kan vi få en uppfattning om det övergripande institutionella sentimentet genom att plotta förhållandet mellan säljoptioner och köpoptioner. Diagrammet till höger visar det historiska förhållandet mellan sälj- och köpoptioner för detta instrument.
Genom att använda sälj/köp-kvoten som en indikator på aktieägarnas sentiment undviker man en av de största bristerna med att använda det totala institutionella ägandet, nämligen att en betydande del av de förvaltade tillgångarna investeras passivt för att följa index. Passivt förvaltade fonder köper vanligtvis inte optioner, så indikatorn för sälj/köp-kvoten ger en bättre bild av stämningen i aktivt förvaltade fonder.
13F- och NPORT-arkiveringar
Detaljer om 13F-arkiveringar är gratis. Detaljer om NP-arkiveringar kräver ett premiummedlemskap. Gröna rader indikerar nya positioner. Röda rader indikerar stängda positioner. Klicka på länk symbolen för att se hela transaktionshistoriken.
Uppgradera
för att låsa upp premiumdata och exportera till Excel ![]() .
.
| Fil Datum | Källa | Investerare | Typ | Genomsnittligt pris (beräknat) |
Aktier | Δ Aktier (%) |
Rapporterat värde (1000 USD) |
Δ Värde (%) |
Portföljallokering (%) |
|
|---|---|---|---|---|---|---|---|---|---|---|
| 2025-07-16 | 13F | St Germain D J Co Inc | 38 | 5 | ||||||
| 2025-08-14 | 13F | Susquehanna International Group, Llp | 7 708 | −38,15 | 991 | −30,06 | ||||
| 2025-08-14 | 13F | Comerica Bank | 7 124 | 7,91 | 916 | 21,97 | ||||
| 2025-07-18 | 13F | Vicus Capital | 33 680 | 12,20 | 4 332 | 26,89 | ||||
| 2025-08-11 | 13F | HighTower Advisors, LLC | 76 373 | 268,13 | 9 824 | 316,23 | ||||
| 2025-08-08 | 13F | Kane Investment Management, Inc. | 5 377 | −35,42 | 692 | −27,03 | ||||
| 2025-07-17 | 13F | Fifth Third Securities, Inc. | 81 712 | 6,45 | 10 511 | 20,36 | ||||
| 2025-08-08 | 13F | Creative Planning | 2 613 | −16,94 | 336 | −5,88 | ||||
| 2025-04-15 | 13F | Kelly Financial Services LLC | 0 | −100,00 | 0 | |||||
| 2025-07-24 | 13F | Blair William & Co/il | 41 797 | 1 318,77 | 5 376 | 1 504,78 | ||||
| 2025-08-06 | 13F | Mascagni Wealth Management, Inc. | 4 864 | 12,44 | 626 | 27,03 | ||||
| 2025-08-13 | 13F | VestGen Advisors, LLC | 40 489 | 20,90 | 5 208 | 36,73 | ||||
| 2025-08-13 | 13F | Colonial Trust Co / SC | 45 | 0,00 | 6 | 0,00 | ||||
| 2025-07-15 | 13F | Fortitude Family Office, LLC | 12 300 | 0,00 | 1 582 | 13,08 | ||||
| 2025-08-12 | 13F | LPL Financial LLC | 2 808 790 | 4,61 | 361 295 | 18,28 | ||||
| 2025-05-06 | 13F | WESPAC Advisors SoCal, LLC | 0 | −100,00 | 0 | |||||
| 2025-07-29 | 13F | Manchester Financial Inc | 103 962 | 38,04 | 13 373 | 56,09 | ||||
| 2025-08-08 | 13F | Gts Securities Llc | 4 647 | 598 | ||||||
| 2025-08-14 | 13F | Ambassador Advisors, LLC | 8 612 | 0,38 | 1 108 | 13,54 | ||||
| 2025-07-09 | 13F | Dynamic Advisor Solutions LLC | 8 097 | 54,58 | 1 041 | 74,96 | ||||
| 2025-07-10 | 13F | Capital Advisory Group Advisory Services, LLC | 4 402 | −52,91 | 566 | −46,75 | ||||
| 2025-07-22 | 13F | Merit Financial Group, LLC | 31 941 | −57,32 | 4 109 | −51,74 | ||||
| 2025-08-11 | 13F | Citigroup Inc | 145 936 | 1,57 | 18 772 | 14,85 | ||||
| 2025-07-11 | 13F | SILVER OAK SECURITIES, Inc | 3 519 | −0,87 | 453 | 12,72 | ||||
| 2025-07-25 | 13F | Atria Wealth Solutions, Inc. | 51 555 | −14,04 | 6 647 | −2,58 | ||||
| 2025-07-31 | 13F | Briaud Financial Planning, Inc | 226 | 0 | ||||||
| 2025-08-11 | 13F | TD Waterhouse Canada Inc. | 330 | 0,00 | 42 | 13,51 | ||||
| 2025-05-06 | 13F | Arlington Capital Management, Inc. | 0 | −100,00 | 0 | −100,00 | ||||
| 2025-08-13 | 13F | Capital Analysts, Inc. | 1 112 | 49,87 | 0 | |||||
| 2025-08-12 | 13F | Ameritas Investment Partners, Inc. | 22 835 | 12,42 | 2 937 | 27,14 | ||||
| 2025-04-22 | 13F | Veridan Wealth LLC | 12 848 | 11,07 | 1 462 | −2,27 | ||||
| 2025-07-28 | 13F | Holistic Planning, LLC | 3 500 | 0,00 | 450 | 13,07 | ||||
| 2025-08-18 | 13F | Geneos Wealth Management Inc. | 1 946 | −4,89 | 250 | 7,76 | ||||
| 2025-06-04 | 13F | Legacy Capital Wealth Management, Llc | 8 786 | 1 085 | ||||||
| 2025-08-13 | 13F | Northern Trust Corp | 2 904 | −33,26 | 374 | −24,49 | ||||
| 2025-08-08 | 13F | Hartland & Co., LLC | 1 400 | 0,00 | 180 | 13,21 | ||||
| 2025-07-29 | 13F | AssuredPartners Investment Advisors, LLC | 98 815 | 237,71 | 12 711 | 281,91 | ||||
| 2025-08-20 | 13F/A | Coppell Advisory Solutions LLC | 1 649 | −78,91 | 212 | −72,09 | ||||
| 2025-08-07 | 13F | Nwam Llc | 35 862 | 20,32 | 4 722 | 39,29 | ||||
| 2025-08-19 | 13F | Advisory Services Network, LLC | 3 909 | −7,92 | 510 | 5,60 | ||||
| 2025-08-14 | 13F | Fmr Llc | 14 019 | −5,42 | 1 803 | 6,94 | ||||
| 2025-08-14 | 13F | Money Concepts Capital Corp | 465 289 | 0,57 | 59 850 | 13,71 | ||||
| 2025-08-13 | 13F | Northwestern Mutual Wealth Management Co | 707 440 | −12,29 | 90 998 | −0,83 | ||||
| 2025-08-06 | 13F | Prospera Financial Services Inc | 28 964 | 11,11 | 3 728 | 25,66 | ||||
| 2025-08-14 | 13F | Betterment LLC | 0 | −100,00 | 0 | |||||
| 2025-08-13 | 13F | EverSource Wealth Advisors, LLC | 333 | −75,85 | 43 | −73,08 | ||||
| 2025-07-30 | 13F | Nottingham Advisors, Inc. | 1 660 | 214 | ||||||
| 2025-07-10 | 13F | Sovran Advisors, LLC | 11 785 | −19,34 | 1 521 | −5,12 | ||||
| 2025-08-01 | 13F | Envestnet Asset Management Inc | 294 732 | 31,58 | 37 911 | 48,78 | ||||
| 2025-05-01 | 13F | ADG Wealth Management Group, LLC | 0 | −100,00 | 0 | |||||
| 2025-07-09 | 13F | Act Wealth Management, Llc | 6 397 | 6,23 | 823 | 20,00 | ||||
| 2025-07-24 | 13F | Mainstay Capital Management Llc /adv | 558 008 | 102,31 | 71 777 | 128,76 | ||||
| 2025-08-08 | 13F | Cetera Investment Advisers | 546 873 | 11,44 | 70 344 | 26,01 | ||||
| 2025-08-14 | 13F | Bank Of America Corp /de/ | 597 656 | 7,56 | 76 877 | 21,62 | ||||
| 2025-07-15 | 13F | Family Investment Center, Inc. | 99 457 | 3,81 | 12 793 | 17,38 | ||||
| 2025-08-14 | 13F | Integrated Wealth Concepts LLC | 10 084 | 1 297 | ||||||
| 2025-08-05 | 13F | Lifeworks Advisors, LLC | 0 | −100,00 | 0 | |||||
| 2025-04-24 | 13F | Beacon Financial Advisory LLC | 0 | −100,00 | 0 | |||||
| 2025-04-10 | 13F | Brand Asset Management Group, Inc. | 0 | −100,00 | 0 | |||||
| 2025-08-01 | 13F | Bessemer Group Inc | 1 312 | 0,00 | 0 | |||||
| 2025-07-25 | 13F | Lion Street Advisors, LLC | 4 268 | −30,31 | 549 | −21,26 | ||||
| 2025-07-16 | 13F | Signature Resources Capital Management, LLC | 161 | 0,62 | 21 | 11,11 | ||||
| 2025-07-08 | 13F | Nbc Securities, Inc. | 29 | 0,00 | 0 | |||||
| 2025-07-24 | 13F | Fischer Investment Strategies, Llc | 7 388 | 950 | ||||||
| 2025-08-04 | 13F | Spire Wealth Management | 5 053 | 5,31 | 650 | 19,08 | ||||
| 2025-08-07 | 13F | PFG Advisors | 6 475 | −12,57 | 833 | −1,19 | ||||
| 2025-08-01 | 13F | Ferguson Shapiro LLC | 3 450 | −19,37 | 444 | −8,85 | ||||
| 2025-08-08 | 13F | Comprehensive Financial Planning, Inc./PA | 9 322 | 26,50 | 1 199 | 43,08 | ||||
| 2025-08-08 | 13F | Thoroughbred Financial Services, Llc | 47 040 | −1,87 | 6 | 20,00 | ||||
| 2025-07-30 | 13F | Principle Wealth Partners Llc | 1 739 | 224 | ||||||
| 2025-07-01 | 13F | Harbor Investment Advisory, Llc | 575 | 0,00 | 74 | 12,31 | ||||
| 2025-08-13 | 13F | Dana Investment Advisors, Inc. | 1 959 | 252 | ||||||
| 2025-08-08 | 13F | Sculati Wealth Management, LLC | 10 565 | −57,37 | 1 359 | −51,83 | ||||
| 2025-08-12 | 13F | Titleist Asset Management, Llc | 43 532 | 6,65 | 5 599 | 20,59 | ||||
| 2025-07-22 | 13F | Apexium Financial, Lp | 1 850 | 0,00 | 238 | 12,86 | ||||
| 2025-07-29 | 13F | Private Trust Co Na | 3 087 | −18,14 | 397 | −7,24 | ||||
| 2025-08-08 | 13F | Pnc Financial Services Group, Inc. | 2 761 | −0,54 | 355 | 12,70 | ||||
| 2025-07-22 | 13F | Unique Wealth, Llc | 2 456 | 316 | ||||||
| 2025-08-04 | 13F | Kovack Advisors, Inc. | 29 181 | −12,91 | 3 754 | −1,52 | ||||
| 2025-08-14 | 13F | UBS Group AG | 244 617 | −1,49 | 31 465 | 11,39 | ||||
| 2025-05-14 | 13F | One Capital Management, LLC | 0 | −100,00 | 0 | |||||
| 2025-07-21 | 13F | Fortis Capital Advisors, LLC | 3 574 | −83,35 | 460 | −81,20 | ||||
| 2025-08-13 | 13F | MONECO Advisors, LLC | 0 | −100,00 | 0 | −100,00 | ||||
| 2025-08-05 | 13F | EPG Wealth Management LLC | 0 | −100,00 | 0 | |||||
| 2025-08-11 | 13F | Advisor Resource Council | 3 247 | 418 | ||||||
| 2025-08-15 | 13F | Morgan Stanley | 1 674 090 | −4,14 | 215 338 | 8,39 | ||||
| 2025-08-13 | 13F | Valued Retirements, Inc. | 9 738 | −2,52 | 1 253 | 10,21 | ||||
| 2025-08-12 | 13F | Calton & Associates, Inc. | 2 764 | −0,07 | 356 | 13,06 | ||||
| 2025-07-14 | 13F | Toth Financial Advisory Corp | 0 | −100,00 | 0 | |||||
| 2025-08-04 | 13F | Bay Colony Advisory Group, Inc d/b/a Bay Colony Advisors | 2 058 | −17,52 | 265 | −6,38 | ||||
| 2025-05-09 | 13F | Goldman Sachs Group Inc | 0 | −100,00 | 0 | |||||
| 2025-08-01 | 13F | Reliant Investment Partners, LLC | 2 619 | 0,00 | 337 | 13,13 | ||||
| 2025-07-17 | 13F | Wagner Wealth Management, Llc | 0 | −100,00 | 0 | |||||
| 2025-07-17 | 13F | Sound Income Strategies, LLC | 22 304 | 182,54 | 2 869 | 219,49 | ||||
| 2025-08-08 | 13F | Avantax Advisory Services, Inc. | 72 404 | 3,42 | 9 313 | 16,94 | ||||
| 2025-07-29 | 13F | Signature Estate & Investment Advisors Llc | 26 228 | 169,06 | 3 374 | 204,42 | ||||
| 2025-08-06 | 13F | Wedbush Securities Inc | 2 826 | 9,07 | 0 | |||||
| 2025-05-01 | 13F | Park Square Financial Group, LLC | 0 | −100,00 | 0 | |||||
| 2025-07-16 | 13F | Minichmacgregor Wealth Management, Llc | 0 | −100,00 | 0 | |||||
| 2025-07-25 | 13F | Cwm, Llc | 273 609 | −3,89 | 35 | 9,38 | ||||
| 2025-07-31 | 13F | Glass Jacobson Investment Advisors llc | 0 | −100,00 | 0 | |||||
| 2025-05-27 | NP | EVCLX - The E-Valuator Conservative (15%-30%) RMS Fund Service Class Shares | 1 712 | −28,64 | 195 | −34,46 | ||||
| 2025-07-29 | 13F | Koshinski Asset Management, Inc. | 29 653 | 10,15 | 3 814 | 24,56 | ||||
| 2025-08-13 | 13F | Baird Financial Group, Inc. | 5 627 | −9,43 | 724 | 2,41 | ||||
| 2025-08-12 | 13F | Trexquant Investment LP | 2 361 | −5,86 | 304 | 6,32 | ||||
| 2025-08-04 | 13F | Atria Investments Llc | 27 574 | 71,49 | 3 547 | 93,88 | ||||
| 2025-08-26 | 13F/A | Thrivent Financial For Lutherans | 39 122 | 5 | ||||||
| 2025-08-13 | 13F | Fisher Asset Management, LLC | 0 | −100,00 | 0 | |||||
| 2025-08-14 | 13F | Sunbelt Securities, Inc. | 0 | −100,00 | 0 | |||||
| 2025-07-23 | 13F | Elm3 Financial Group, LLC | 26 394 | −9,20 | 3 395 | 2,69 | ||||
| 2025-07-31 | 13F | Longview Financial Advisors, Inc. | 2 252 | −43,42 | 290 | −36,06 | ||||
| 2025-07-09 | 13F | Reyes Financial Architecture, Inc. | 0 | −100,00 | 0 | |||||
| 2025-08-12 | 13F | Global Retirement Partners, LLC | 6 876 | −5,50 | 884 | −1,56 | ||||
| 2025-08-11 | 13F | Western Wealth Management, LLC | 11 059 | 0,09 | 1 423 | 13,22 | ||||
| 2025-07-23 | 13F | Wealth Management Nebraska | 1 681 | 216 | ||||||
| 2025-07-31 | 13F | Whipplewood Advisors, LLC | 3 490 | −90,54 | 449 | 16,06 | ||||
| 2025-08-05 | 13F | Scarborough Advisors, LLC | 2 277 | −91,03 | 293 | −89,89 | ||||
| 2025-08-12 | 13F | PSI Advisors, LLC | 0 | −100,00 | 0 | |||||
| 2025-07-07 | 13F | TruWealth Advisors, LLC | 15 436 | 28,12 | 1 986 | 44,89 | ||||
| 2025-04-29 | 13F | Crew Capital Management, Ltd. | 0 | −100,00 | 0 | |||||
| 2025-08-04 | 13F | Flagship Harbor Advisors, Llc | 30 701 | 2,92 | 3 949 | 16,36 | ||||
| 2025-08-08 | 13F | Capital Investment Advisory Services, LLC | 290 | 0,35 | 37 | 15,63 | ||||
| 2025-08-14 | 13F | Wells Fargo & Company/mn | 878 913 | 0,33 | 113 055 | 13,45 | ||||
| 2025-07-15 | 13F | Armis Advisers, LLC | 17 033 | 51,88 | 2 202 | 71,42 | ||||
| 2025-05-15 | 13F/A | Orion Portfolio Solutions, LLC | 104 706 | −78,68 | 11 911 | −80,37 | ||||
| 2025-08-11 | 13F | Private Advisor Group, LLC | 231 259 | 62,27 | 29 747 | 83,48 | ||||
| 2025-08-05 | 13F | Key FInancial Inc | 0 | −100,00 | 0 | |||||
| 2025-07-25 | 13F | Kellett Schaffner Wealth Advisors LLC | 34 019 | 6,33 | 4 376 | 20,23 | ||||
| 2025-08-14 | 13F | Moneta Group Investment Advisors Llc | 76 881 | 0,11 | 9 889 | 13,20 | ||||
| 2025-08-12 | 13F | FreeGulliver LLC | 65 307 | 1,46 | 8 400 | 14,72 | ||||
| 2025-08-08 | 13F | Foundations Investment Advisors, LLC | 163 585 | 0,78 | 21 042 | 13,95 | ||||
| 2025-07-30 | 13F | Brookstone Capital Management | 3 516 | 31,10 | 452 | 48,20 | ||||
| 2025-05-15 | 13F | Concorde Asset Management, LLC | 0 | −100,00 | 0 | |||||
| 2025-05-27 | NP | EVMLX - The E-Valuator Moderate (50%-70%) RMS Fund Service Class Shares | 14 945 | −15,26 | 1 700 | −21,95 | ||||
| 2025-07-07 | 13F | Insight Wealth Strategies, LLC | 89 549 | 1,71 | 11 523 | 15,06 | ||||
| 2025-08-12 | 13F | Howe & Rusling Inc | 47 | 0,00 | 6 | 20,00 | ||||
| 2025-05-09 | 13F | Emerald Investment Partners, Llc | 0 | −100,00 | 0 | |||||
| 2025-05-15 | 13F | Clark Capital Management Group, Inc. | 0 | −100,00 | 0 | |||||
| 2025-07-14 | 13F | AdvisorNet Financial, Inc | 100 | 0,00 | 13 | 9,09 | ||||
| 2025-07-28 | 13F | Mutual Advisors, LLC | 2 614 | 1,91 | 345 | 18,15 | ||||
| 2025-08-04 | 13F | Creative Financial Designs Inc /adv | 19 506 | 75,71 | 2 509 | 98,81 | ||||
| 2025-08-08 | 13F | New England Capital Financial Advisors LLC | 0 | −100,00 | 0 | |||||
| 2025-07-29 | 13F | International Assets Investment Management, Llc | 3 276 | −4,13 | 421 | 8,51 | ||||
| 2025-07-22 | 13F | Accel Wealth Management | 21 579 | 3,29 | 2 776 | 16,79 | ||||
| 2025-05-14 | 13F | Change Path, LLC | 0 | −100,00 | 0 | |||||
| 2025-08-12 | 13F | TCP Asset Management, LLC | 2 491 | 0,00 | 320 | 13,07 | ||||
| 2025-08-08 | 13F | Symphony Financial Services, Inc. | 32 521 | 3,99 | 4 183 | 17,60 | ||||
| 2025-04-21 | 13F | Compass Capital Corp /ma/ /adv | 0 | −100,00 | 0 | |||||
| 2025-07-17 | 13F | Grandview Asset Management LLC | 8 114 | −2,34 | 1 | |||||
| 2025-04-14 | 13F | Patriot Financial Group Insurance Agency, LLC | 0 | −100,00 | 0 | −100,00 | ||||
| 2025-04-30 | 13F | Axxcess Wealth Management, Llc | 0 | −100,00 | 0 | |||||
| 2025-08-07 | 13F | Resources Investment Advisors, LLC. | 2 040 | 6,19 | 262 | 20,18 | ||||
| 2025-04-22 | 13F | Diversified Portfolios, Inc. | 0 | −100,00 | 0 | |||||
| 2025-07-15 | 13F | Main Street Group, LTD | 2 348 | 48,42 | 302 | 68,72 | ||||
| 2025-07-25 | 13F | Hazlett, Burt & Watson, Inc. | 671 | 24,49 | 0 | |||||
| 2025-08-12 | 13F | Financial Advocates Investment Management | 13 392 | −79,34 | 1 723 | −76,65 | ||||
| 2025-08-14 | 13F | CoreCap Advisors, LLC | 209 | 27 | ||||||
| 2025-08-25 | 13F/A | Promus Capital, LLC | 453 | 58 | ||||||
| 2025-07-31 | 13F | Cambridge Investment Research Advisors, Inc. | 214 476 | −0,49 | 28 | 12,50 | ||||
| 2025-08-04 | 13F | Assetmark, Inc | 145 | −97,00 | 19 | −96,72 | ||||
| 2025-07-14 | 13F | Pacifica Partners Inc. | 200 | 0,00 | 26 | 13,64 | ||||
| 2025-08-14 | 13F | Great Valley Advisor Group, Inc. | 205 967 | −1,48 | 26 493 | 11,40 | ||||
| 2025-07-29 | 13F | Chicago Partners Investment Group LLC | 6 542 | 30,32 | 857 | 42,90 | ||||
| 2025-08-05 | 13F | Bank Of Montreal /can/ | 875 | −33,96 | 113 | −25,33 | ||||
| 2025-08-14 | 13F | Hrt Financial Lp | 4 719 | 38,02 | 1 | |||||
| 2025-04-30 | 13F | Synergy Investment Management, LLC | 0 | −100,00 | 0 | |||||
| 2025-07-15 | 13F | Financial Partners Group, Inc | 106 346 | 53,39 | 13 679 | 73,46 | ||||
| 2025-08-01 | 13F | SYM FINANCIAL Corp | 4 | 1 | ||||||
| 2025-05-15 | 13F | Kiker Wealth Management, LLC | 0 | −100,00 | 0 | |||||
| 2025-08-07 | 13F | Guardian Partners Inc. | 7 938 | 25,13 | 1 028 | 45,26 | ||||
| 2025-08-13 | 13F | Level Four Advisory Services, Llc | 52 017 | −24,58 | 6 691 | −14,71 | ||||
| 2025-07-23 | 13F | Armbruster Capital Management, Inc. | 6 959 | 0,00 | 895 | 13,15 | ||||
| 2025-07-24 | 13F | Us Bancorp \de\ | 1 093 | −21,20 | 141 | −10,83 | ||||
| 2025-07-29 | NP | MVFG - Monarch Volume Factor Global Unconstrained Index ETF | 0 | −100,00 | 0 | −100,00 | ||||
| 2025-08-08 | 13F | ProVise Management Group, LLC | 52 351 | −0,89 | 6 734 | 12,07 | ||||
| 2025-08-11 | 13F | CBIZ Investment Advisory Services, LLC | 87 | 0,00 | 11 | 22,22 | ||||
| 2025-05-27 | NP | EVAGX - The E-Valuator Aggressive Growth (85%-99%) RMS Fund Service Class Shares | 32 053 | −13,95 | 3 646 | −20,76 | ||||
| 2025-08-06 | 13F | Nvwm, Llc | 21 | 0,00 | 3 | 0,00 | ||||
| 2025-07-30 | 13F | Gimbal Financial | 122 141 | 15 711 | ||||||
| 2025-08-14 | 13F | Mariner, LLC | 9 912 | −13,90 | 1 275 | −2,67 | ||||
| 2025-07-11 | 13F | Afg Fiduciary Services Limited Partnership | 3 513 | 0,00 | 452 | 15,90 | ||||
| 2025-07-14 | 13F | Southland Equity Partners LLC | 17 662 | 3,50 | 2 272 | 17,00 | ||||
| 2025-07-17 | 13F | Smith Anglin Financial, LLC | 87 802 | 92,03 | 11 294 | 117,13 | ||||
| 2025-07-30 | 13F | Parcion Private Wealth LLC | 3 212 | 13,42 | 413 | 28,26 | ||||
| 2025-05-15 | 13F | Virtue Capital Management, LLC | 0 | −100,00 | 0 | |||||
| 2025-08-06 | 13F | Csenge Advisory Group | 3 025 | 9,56 | 376 | 24,50 | ||||
| 2025-07-28 | 13F | Harbour Investments, Inc. | 17 753 | −59,39 | 2 284 | −54,09 | ||||
| 2025-08-13 | 13F | Summit Financial, LLC | 1 715 | 221 | ||||||
| 2025-07-23 | 13F | Steel Peak Wealth Management LLC | 0 | −100,00 | 0 | |||||
| 2025-08-06 | 13F | Vantage Financial Partners, LLC | 17 046 | 9,17 | 2 193 | 23,42 | ||||
| 2025-05-27 | NP | EVGLX - The E-Valuator Growth (70%-85%) RMS Fund Service Class Shares | 46 172 | 8,36 | 5 253 | −0,21 | ||||
| 2025-08-14 | 13F | Visionary Wealth Advisors | 1 737 | 223 | ||||||
| 2025-08-06 | 13F | Golden State Wealth Management, LLC | 216 | 28 | ||||||
| 2025-08-11 | 13F | TRUE Private Wealth Advisors | 18 571 | 2 389 | ||||||
| 2025-08-13 | 13F | StoneX Group Inc. | 5 152 | 27,43 | 663 | 44,23 | ||||
| 2025-07-15 | 13F | World Equity Group, Inc. | 7 584 | 53,71 | 976 | 73,49 | ||||
| 2025-07-14 | 13F | Park Avenue Securities Llc | 20 721 | 10,80 | 3 | 0,00 | ||||
| 2025-08-14 | 13F | Two Sigma Investments, Lp | 46 200 | 5 943 | ||||||
| 2025-07-09 | 13F | Breakwater Capital Group | 6 877 | 116,67 | 885 | 144,88 | ||||
| 2025-08-14 | 13F | Marshall Investment Management, Llc | 0 | −100,00 | 0 | |||||
| 2025-08-12 | 13F | Gladstone Institutional Advisory LLC | 5 583 | −27,29 | 718 | −17,75 | ||||
| 2025-08-12 | 13F | Deutsche Bank Ag\ | 116 | −42,29 | 15 | −36,36 | ||||
| 2025-08-19 | 13F | National Asset Management, Inc. | 41 644 | −56,63 | 5 357 | −54,84 | ||||
| 2025-08-01 | 13F | First Command Advisory Services, Inc. | 1 074 | 0,00 | 138 | 13,11 | ||||
| 2025-08-13 | 13F | JBR Co Financial Management Inc | 10 397 | 9,64 | 1 337 | 24,03 | ||||
| 2025-07-25 | 13F | Envestnet Portfolio Solutions, Inc. | 3 994 | −26,15 | 514 | −16,59 | ||||
| 2025-08-14 | 13F | Citadel Advisors Llc | 3 527 | −86,92 | 454 | −85,23 | ||||
| 2025-08-14 | 13F | Ameriprise Financial Inc | 650 232 | −5,94 | 83 663 | 6,36 | ||||
| 2025-05-27 | NP | EVTTX - The E-Valuator Conservative/Moderate (30%-50%) RMS Fund Service Class Shares | 1 292 | −41,09 | 147 | −45,93 | ||||
| 2025-08-05 | 13F | Huntington National Bank | 2 327 | 10,45 | ||||||
| 2025-08-14 | 13F | Stifel Financial Corp | 316 066 | 4,24 | 40 657 | 17,86 | ||||
| 2025-08-14 | 13F | Certified Advisory Corp | 15 881 | 0,96 | 2 043 | 14,14 | ||||
| 2025-08-11 | 13F | TAGStone Capital, Inc. | 4 351 | 106,60 | 566 | |||||
| 2025-04-14 | 13F | Strategic Wealth Designers | 0 | −100,00 | 0 | −100,00 | ||||
| 2025-08-12 | 13F | Wood Tarver Financial Group, LLC | 903 | −1,74 | 0 | −100,00 | ||||
| 2025-08-01 | 13F | Brookwood Investment Group LLC | 12 739 | 336,42 | 1 639 | 393,37 | ||||
| 2025-08-14 | 13F | IHT Wealth Management, LLC | 12 739 | −5,98 | 1 639 | 6,29 | ||||
| 2025-08-11 | 13F | Aptus Capital Advisors, LLC | 16 | 0,00 | 2 | 100,00 | ||||
| 2025-04-16 | 13F | New Century Financial Group, LLC | 0 | −100,00 | 0 | |||||
| 2025-07-30 | 13F | Cullen/frost Bankers, Inc. | 929 | 0,22 | 119 | 13,33 | ||||
| 2025-07-23 | 13F | Valmark Advisers, Inc. | 8 263 | −0,18 | 1 063 | 12,86 | ||||
| 2025-08-12 | 13F | Lodestone Wealth Management LLC | 2 064 | 16,61 | 265 | 31,84 | ||||
| 2025-07-25 | 13F | Prostatis Group LLC | 19 566 | −19,38 | 2 517 | −8,84 | ||||
| 2025-07-23 | 13F | Prime Capital Investment Advisors, LLC | 39 809 | 4,76 | 5 121 | 18,46 | ||||
| 2025-08-14 | 13F | Ausdal Financial Partners, Inc. | 48 554 | −21,19 | 6 245 | −10,89 | ||||
| 2025-08-11 | 13F | Vista Cima Wealth Management LLC | 11 851 | 1,26 | 1 524 | 14,50 | ||||
| 2025-07-23 | 13F | Schrum Private Wealth Management LLC | 2 000 | 0,00 | 257 | 13,22 | ||||
| 2025-07-30 | NP | ENDW - Cambria Endowment Style ETF | 956 | 119 | ||||||
| 2025-08-12 | 13F | Coldstream Capital Management Inc | 0 | −100,00 | 0 | |||||
| 2025-08-14 | 13F | Tudor Investment Corp Et Al | 8 578 | 1 103 | ||||||
| 2025-08-15 | 13F | Kestra Advisory Services, LLC | 34 405 | −15,82 | 4 425 | −4,82 | ||||
| 2025-08-06 | 13F | Centerpoint Advisory Group | 6 406 | 2,78 | 824 | 16,22 | ||||
| 2025-08-05 | 13F | Simplex Trading, Llc | 178 | 61,82 | 0 | |||||
| 2025-08-12 | 13F | O'shaughnessy Asset Management, Llc | 244 | −29,28 | 31 | −20,51 | ||||
| 2025-08-15 | 13F | Equitable Holdings, Inc. | 121 320 | 6,93 | 15 605 | 20,91 | ||||
| 2025-08-14 | 13F | Arete Wealth Advisors, LLC | 19 570 | 204,35 | 3 | |||||
| 2025-08-06 | 13F | OneAscent Wealth Management LLC | 2 034 | 0 | ||||||
| 2025-08-14 | 13F | Old Mission Capital Llc | 2 092 | 269 | ||||||
| 2025-08-08 | 13F | Good Life Advisors, LLC | 2 324 | 4,73 | 299 | 18,25 | ||||
| 2025-08-14 | 13F | Wiley Bros.-aintree Capital, Llc | 3 402 | −13,74 | 438 | −2,02 | ||||
| 2025-07-29 | 13F | Elevation Capital Advisory, LLC | 12 746 | −85,16 | 1 640 | −83,22 | ||||
| 2025-05-15 | 13F | Glenmede Trust Co Na | 1 437 | 1,20 | 163 | −6,86 | ||||
| 2025-08-12 | 13F | Archer Investment Corp | 265 | 0,00 | 34 | 13,33 | ||||
| 2025-08-04 | 13F | Fortune 45 LLC | 0 | −100,00 | 0 | |||||
| 2025-08-01 | 13F | GoalVest Advisory LLC | 0 | −100,00 | 0 | |||||
| 2025-08-06 | 13F | New Millennium Group LLC | 24 446 | −0,22 | 3 145 | 12,81 | ||||
| 2025-08-28 | 13F | Stark Wealth Management LLC | 1 589 | 204 | ||||||
| 2025-07-23 | 13F | Kingswood Wealth Advisors, Llc | 8 788 | −16,12 | 1 130 | −5,12 | ||||
| 2025-08-12 | 13F | Proequities, Inc. | 0 | 0 | ||||||
| 2025-08-12 | 13F | J.w. Cole Advisors, Inc. | 77 981 | 2,30 | 10 031 | 15,66 | ||||
| 2025-07-07 | 13F | Nova Wealth Management, Inc. | 3 548 | 11,47 | 456 | 25,97 | ||||
| 2025-08-04 | 13F | Savvy Advisors, Inc. | 14 814 | 1,12 | 1 906 | 14,35 | ||||
| 2025-07-14 | 13F | Abound Wealth Management | 59 | 0,00 | 8 | 16,67 | ||||
| 2025-07-21 | 13F | Ameritas Advisory Services, LLC | 40 580 | −2,12 | 5 220 | 10,25 | ||||
| 2025-08-01 | 13F | Advisory Alpha, LLC | 1 890 | 0,27 | 243 | 13,55 | ||||
| 2025-07-24 | 13F | IFP Advisors, Inc | 716 | −54,25 | 92 | −48,02 | ||||
| 2025-08-05 | 13F | C2P Capital Advisory Group, LLC d.b.a. Prosperity Capital Advisors | 1 924 | 247 | ||||||
| 2025-08-13 | 13F | Congress Wealth Management LLC / DE / | 106 552 | 0,93 | 13 706 | 14,11 | ||||
| 2025-08-15 | 13F | Captrust Financial Advisors | 1 754 | 226 | ||||||
| 2025-08-11 | 13F | Wealthspire Advisors, LLC | 3 920 | −1,51 | 504 | 11,50 | ||||
| 2025-05-08 | 13F | Pasadena Private Wealth, LLC | 0 | −100,00 | 0 | −100,00 | ||||
| 2025-05-14 | 13F | Atomi Financial Group, Inc. | 0 | −100,00 | 0 | |||||
| 2025-07-25 | 13F | NorthRock Partners, LLC | 1 325 | 0,23 | 170 | 13,33 | ||||
| 2025-08-14 | 13F | Jane Street Group, Llc | 0 | −100,00 | 0 | −100,00 | ||||
| 2025-04-25 | 13F | Essex Financial Services, Inc. | 0 | −100,00 | 0 | |||||
| 2025-08-11 | 13F | Principal Securities, Inc. | 34 560 | −86,11 | 4 445 | −85,54 | ||||
| 2025-07-10 | 13F | Redhawk Wealth Advisors, Inc. | 13 088 | −64,99 | 1 683 | −60,42 | ||||
| 2025-07-29 | 13F | Systelligence, LLC | 0 | −100,00 | 0 | |||||
| 2025-07-21 | 13F | Ameriflex Group, Inc. | 257 | −9,82 | 33 | 0,00 | ||||
| 2025-05-07 | 13F | Sunpointe, LLC | 0 | −100,00 | 0 | |||||
| 2025-08-13 | 13F | Cerity Partners LLC | 27 884 | 3 587 | ||||||
| 2025-07-15 | 13F | FLP Wealth Management, LLC | 9 955 | 1,23 | 1 132 | −6,75 | ||||
| 2025-04-30 | 13F | BCJ Capital Management, LLC | 0 | −100,00 | 0 | |||||
| 2025-09-04 | 13F | Beacon Capital Management, Inc. | 388 | 50 | ||||||
| 2025-08-12 | 13F | OneAscent Financial Services LLC | 19 851 | −27,71 | 3 | −33,33 | ||||
| 2025-04-25 | 13F | Colonial River Wealth Management, LLC | 0 | −100,00 | 0 | |||||
| 2025-07-25 | 13F | Commonwealth Financial Services, LLC | 8 605 | −7,11 | 1 107 | 5,03 | ||||
| 2025-08-14 | 13F | Federation des caisses Desjardins du Quebec | 905 | 116 | ||||||
| 2025-05-15 | 13F | JDM Financial Group LLC | 0 | −100,00 | 0 | |||||
| 2025-04-09 | 13F | Worth Asset Management, LLC | 0 | −100,00 | 0 | |||||
| 2025-08-14 | 13F | Blue Capital, Inc. | 0 | −100,00 | 0 | |||||
| 2025-08-25 | 13F | Silverlake Wealth Management Llc | 2 800 | 0,00 | 360 | 13,21 | ||||
| 2025-07-24 | 13F | Trust Co Of Toledo Na /oh/ | 9 116 | 1 173 | ||||||
| 2025-07-31 | 13F | City State Bank | 350 | 0,00 | 45 | 15,38 | ||||
| 2025-07-11 | 13F | Farther Finance Advisors, LLC | 5 059 | 130,16 | 651 | 157,94 | ||||
| 2025-05-20 | 13F | Blue Rock Wealth Management LLC | 2 025 | 10,96 | 230 | 2,22 | ||||
| 2025-08-06 | 13F | First Horizon Advisors, Inc. | 120 | 15 | ||||||
| 2025-07-11 | 13F | OxenFree Capital LLC | 8 620 | −0,02 | 1 109 | 20,70 | ||||
| 2025-08-14 | 13F | Win Advisors, Inc | 14 874 | 1 913 | ||||||
| 2025-05-16 | 13F | Cape Investment Advisory, Inc. | 0 | −100,00 | 0 | |||||
| 2025-08-27 | 13F/A | Brinker Capital Investments, LLC | 133 371 | 27,38 | 17 156 | 44,03 | ||||
| 2025-08-13 | 13F | Brown Advisory Inc | 10 609 | 0,00 | 1 365 | 13,10 | ||||
| 2025-07-02 | 13F | Central Pacific Bank - Trust Division | 17 | 0,00 | 2 | 100,00 | ||||
| 2025-04-21 | 13F | United Advisor Group, LLC | 0 | −100,00 | 0 | |||||
| 2025-08-08 | 13F | Larson Financial Group LLC | 2 028 | 281,92 | 261 | 333,33 | ||||
| 2025-08-12 | 13F | Jpmorgan Chase & Co | 5 576 | −49,60 | 717 | −43,00 | ||||
| 2025-08-13 | 13F | Luminist Capital LLC | 18 | 0,00 | 2 | 0,00 | ||||
| 2025-08-13 | 13F | Townsquare Capital Llc | 0 | −100,00 | 0 | |||||
| 2025-08-14 | 13F | Pine Harbor Wealth Management, LLC | 3 854 | 0,00 | 496 | 13,01 | ||||
| 2025-08-12 | 13F | Bokf, Na | 568 | 0,00 | 73 | 14,06 | ||||
| 2025-08-07 | 13F | Davidson Capital Management Inc. | 389 462 | 43,21 | 50 096 | 61,93 | ||||
| 2025-08-07 | 13F | CENTRAL TRUST Co | 16 000 | 2 058 | ||||||
| 2025-07-10 | 13F | Focus Financial Network, Inc. | 119 851 | 0,00 | 15 416 | 13,07 | ||||
| 2025-07-16 | 13F | Meridian Financial, LLC | 3 150 | 0,00 | 405 | 13,13 | ||||
| 2025-04-22 | 13F | Castleview Partners, Llc | 0 | −100,00 | 0 | |||||
| 2025-08-13 | 13F | Jones Financial Companies Lllp | 261 537 | 28,06 | 33 610 | 45,48 | ||||
| 2025-07-29 | 13F | Stratos Wealth Advisors, LLC | 33 610 | 81,24 | 4 323 | 104,98 | ||||
| 2025-04-25 | 13F | Red Tortoise LLC | 0 | −100,00 | 0 | |||||
| 2025-08-01 | 13F | Liberty Wealth Management Llc | 0 | −100,00 | 0 | |||||
| 2025-07-30 | 13F | TFB Advisors LLC | 6 523 | −1,54 | 839 | 11,42 | ||||
| 2025-08-18 | 13F/A | National Bank Of Canada /fi/ | 138 | 0,00 | 18 | 13,33 | ||||
| 2025-07-28 | 13F | RFG Advisory, LLC | 2 671 | 344 | ||||||
| 2025-07-29 | 13F | LMG Wealth Partners, LLC | 59 927 | −0,26 | 7 708 | 12,77 | ||||
| 2025-07-18 | 13F | Truist Financial Corp | 3 028 | −88,99 | 390 | −87,56 | ||||
| 2025-08-12 | 13F | Guerra Advisors Inc | 2 472 | −9,38 | 318 | 2,26 | ||||
| 2025-07-15 | 13F | Unified Investment Management | 1 565 | 201 | ||||||
| 2025-08-01 | 13F | Belvedere Trading LLC | 1 942 | −74,80 | 250 | −71,58 | ||||
| 2025-08-01 | 13F | Belvedere Trading LLC | Call | 3 200 | 28,00 | 412 | 44,72 | |||
| 2025-08-14 | 13F | Tennessee Valley Asset Management Partners | 0 | −100,00 | 0 | |||||
| 2025-08-01 | 13F | Belvedere Trading LLC | Put | 10 100 | 0,00 | 1 299 | 13,15 | |||
| 2025-07-11 | 13F | Pinnacle Bancorp, Inc. | 69 | 0,00 | 9 | 14,29 | ||||
| 2025-07-14 | 13F | Hoey Investments, Inc | 580 | 0,00 | 75 | 13,85 | ||||
| 2025-09-03 | 13F | American Trust | 8 255 | 1 062 | ||||||
| 2025-07-10 | 13F | Secure Asset Management, LLC | 60 369 | 6,61 | 7 765 | 20,56 | ||||
| 2025-07-16 | 13F | Strategic Investment Solutions, Inc. /IL | 83 | 0,00 | 11 | 11,11 | ||||
| 2025-07-21 | 13F | Jackson Wealth Management, LLC | 6 107 | 2,60 | 786 | 16,10 | ||||
| 2025-07-23 | 13F | Clear Creek Financial Management, LLC | 6 396 | 823 | ||||||
| 2025-08-07 | 13F | Flagship Wealth Advisors, Llc | 58 251 | −6,64 | 7 493 | 5,57 | ||||
| 2025-08-08 | 13F | Meridian Wealth Management, LLC | 0 | −100,00 | 0 | |||||
| 2025-07-23 | 13F | Capstone Wealth Management Group, Llc | 0 | −100,00 | 0 | |||||
| 2025-08-07 | 13F | Parkside Financial Bank & Trust | 481 | 62 | ||||||
| 2025-08-13 | 13F | Continuum Advisory, LLC | 2 896 | 0,56 | 373 | 13,76 | ||||
| 2025-07-16 | 13F | Diversified Enterprises, LLC | 18 286 | −1,73 | 2 352 | 11,15 | ||||
| 2025-07-16 | 13F | Swisher Financial Concepts, Inc. | 5 992 | 15,72 | 771 | 30,73 | ||||
| 2025-08-04 | 13F | Crescent Sterling, Ltd. | 2 136 | 6,59 | 275 | 20,70 | ||||
| 2025-07-10 | 13F | Wealth Enhancement Advisory Services, Llc | 163 732 | −20,86 | 21 387 | −9,13 | ||||
| 2025-07-24 | 13F | JNBA Financial Advisors | 89 | 32,84 | 11 | 57,14 | ||||
| 2025-08-04 | 13F | Pensionmark Financial Group, Llc | 4 627 | 1,74 | 595 | 15,09 | ||||
| 2025-08-13 | 13F | GeoWealth Management, LLC | 0 | −100,00 | 0 | |||||
| 2025-08-14 | 13F | Qube Research & Technologies Ltd | 94 844 | −16,21 | 12 200 | −5,26 | ||||
| 2025-07-29 | 13F | Harbor Asset Planning, Inc. | 1 649 | 212 | ||||||
| 2025-04-09 | 13F | SigFig Wealth Management, LLC | 0 | −100,00 | 0 | |||||
| 2025-08-14 | 13F | Jupiter Wealth Management LLC | 16 050 | 2 120 | ||||||
| 2025-08-08 | 13F | IMA Wealth, Inc. | 0 | −100,00 | 0 | |||||
| 2025-07-07 | 13F | Investors Research Corp | 2 734 | 55,69 | 352 | 76,38 | ||||
| 2025-08-13 | 13F | Renaissance Technologies Llc | 4 800 | 617 | ||||||
| 2025-04-22 | 13F | Synergy Financial Management, LLC | 0 | −100,00 | 0 | |||||
| 2025-07-10 | 13F | American Financial Advisors, LLC | 3 448 | −10,40 | 444 | 1,37 | ||||
| 2025-08-12 | 13F | Steward Partners Investment Advisory, Llc | 15 352 | 6,60 | 1 975 | 20,51 | ||||
| 2025-07-22 | 13F | Belpointe Asset Management LLC | 14 991 | −55,43 | 1 928 | −49,61 | ||||
| 2025-05-14 | 13F | Per Stirling Capital Management, LLC. | 0 | −100,00 | 0 | |||||
| 2025-08-07 | 13F | 49 Wealth Management, Llc | 2 331 | −18,61 | 300 | −8,00 | ||||
| 2025-08-13 | 13F | Financial Freedom, LLC | 6 351 | 10,05 | 817 | 24,39 | ||||
| 2025-04-15 | 13F | Noble Wealth Management PBC | 1 299 | 0,15 | 148 | −8,12 | ||||
| 2025-08-05 | 13F | Bank of New York Mellon Corp | 1 602 | 206 | ||||||
| 2025-07-16 | 13F | Maridea Wealth Management LLC | 4 872 | 627 | ||||||
| 2025-07-30 | 13F | Patten Group, Inc. | 6 418 | −4,12 | 826 | 8,41 | ||||
| 2025-08-13 | 13F | IAG Wealth Partners, LLC | 55 | 0,00 | 7 | 16,67 | ||||
| 2025-05-06 | 13F | Richardson Financial Services Inc. | 0 | −100,00 | 0 | |||||
| 2025-08-06 | 13F | AE Wealth Management LLC | 21 189 | 8,62 | 2 726 | 22,80 | ||||
| 2025-07-24 | 13F | MFA Wealth Services | 18 716 | 5,85 | 2 407 | 19,69 | ||||
| 2025-08-06 | 13F | Commonwealth Equity Services, Llc | 307 733 | 5,42 | 40 | 18,18 | ||||
| 2025-07-10 | 13F | Peoples Bank/KS | 0 | −100,00 | 0 | |||||
| 2025-05-14 | 13F | Absolute Capital Management, LLC | 0 | −100,00 | 0 | −100,00 | ||||
| 2025-07-25 | 13F | We Are One Seven, LLC | 7 512 | −5,12 | 966 | 7,33 | ||||
| 2025-08-14 | 13F | GWM Advisors LLC | 45 809 | −7,46 | 5 892 | 4,64 | ||||
| 2025-08-15 | 13F | Tower Research Capital LLC (TRC) | 6 504 | 837 | ||||||
| 2025-07-18 | 13F | Institute for Wealth Management, LLC. | 47 922 | −0,90 | 6 164 | 12,07 | ||||
| 2025-07-18 | 13F | Cooper Financial Group | 0 | −100,00 | 0 | |||||
| 2025-08-04 | 13F | Integrity Alliance, Llc. | 15 392 | −62,26 | 1 980 | −57,34 | ||||
| 2025-08-14 | 13F | EP Wealth Advisors, Inc. | 2 591 | 0,00 | 333 | 13,27 | ||||
| 2025-05-14 | 13F | Barometer Capital Management Inc. | 0 | −100,00 | 0 | |||||
| 2025-08-08 | 13F | Tanglewood Legacy Advisors, LLC | 245 | 0,00 | 32 | 14,81 | ||||
| 2025-08-13 | 13F | Smith, Moore & Co. | 29 817 | −3,82 | 3 835 | 8,76 | ||||
| 2025-08-06 | 13F | Founders Financial Securities Llc | 12 155 | 1 563 | ||||||
| 2025-08-14 | 13F | Jane Street Group, Llc | Call | 14 000 | 1 801 | |||||
| 2025-07-14 | 13F | Ridgewood Investments LLC | 120 | 0,00 | 15 | 15,38 | ||||
| 2025-07-18 | 13F | Lowery Thomas, Llc | 24 142 | −9,28 | 3 105 | 2,58 | ||||
| 2025-07-22 | 13F | Wealthcare Advisory Partners LLC | 12 899 | 1 659 | ||||||
| 2025-04-23 | 13F | Crewe Advisors LLC | 0 | −100,00 | 0 | |||||
| 2025-08-13 | 13F/A | Claudia M.p. Batlle, Crp (r) Llc | 51 004 | 1 550,08 | 6 561 | 1 768,95 | ||||
| 2025-08-14 | 13F | Snowden Capital Advisors LLC | 2 284 | 294 | ||||||
| 2025-07-14 | 13F | Sowell Financial Services LLC | 12 983 | 6,70 | 1 670 | 20,66 | ||||
| 2025-04-29 | 13F | Lee Danner & Bass Inc | 0 | −100,00 | 0 | −100,00 | ||||
| 2025-05-06 | 13F | Tempus Wealth Planning, LLC | 0 | −100,00 | 0 | |||||
| 2025-08-06 | 13F | Atlas Legacy Advisors, LLC | 59 193 | 1,22 | 7 614 | 10,19 | ||||
| 2025-07-07 | 13F | Verde Capital Management | 15 838 | −2,12 | 2 037 | 10,71 | ||||
| 2025-05-13 | 13F | Quadrature Capital Ltd | 0 | −100,00 | 0 | |||||
| 2025-08-01 | 13F | Y-Intercept (Hong Kong) Ltd | 2 717 | −46,87 | 349 | −39,93 | ||||
| 2025-07-17 | 13F | TBH Global Asset Management, LLC | 6 603 | 196,36 | 753 | 95,58 | ||||
| 2025-08-14 | 13F | Raymond James Financial Inc | 667 770 | 5,02 | 85 895 | 18,75 | ||||
| 2025-07-31 | 13F | Richards, Merrill & Peterson, Inc. | 1 089 | 0,00 | 140 | 13,82 | ||||
| 2025-08-14 | 13F | Ancora Advisors, LLC | 8 549 | −1,70 | 1 100 | 11,12 | ||||
| 2025-07-30 | 13F | Journey Advisory Group, LLC | 9 204 | 331,30 | 1 184 | 388,84 | ||||
| 2025-08-14 | 13F | Royal Bank Of Canada | 244 363 | 16,07 | 31 432 | 31,25 | ||||
| 2025-08-14 | 13F | Mml Investors Services, Llc | 225 618 | 0,35 | 29 | 16,00 | ||||
| 2025-08-07 | 13F | PCG Wealth Advisors, LLC | 0 | −100,00 | 0 | |||||
| 2025-08-01 | 13F | Anson Capital, Inc. | 21 522 | −2,94 | 2 768 | 9,75 | ||||
| 2025-07-30 | 13F | D.a. Davidson & Co. | 2 393 | 28,17 | 308 | 44,81 | ||||
| 2025-07-15 | 13F | Fifth Third Bancorp | 1 500 | 0,00 | 193 | 12,94 | ||||
| 2025-08-14 | 13F | Benjamin Edwards Inc | 33 177 | 53,29 | 4 268 | 73,31 | ||||
| 2025-08-01 | 13F | GPM Growth Investors, Inc. | 11 693 | 0,50 | 1 504 | 13,68 | ||||
| 2025-05-02 | 13F | Transcendent Capital Group LLC | 0 | −100,00 | 0 | |||||
| 2025-08-04 | 13F | IFG Advisory, LLC | 3 141 | 69,42 | 404 | 92,38 | ||||
| 2025-08-14 | 13F | Riggs Asset Managment Co. Inc. | 2 584 | −6,78 | 332 | 5,40 | ||||
| 2025-08-18 | 13F | Tactive Advisors, LLC | 8 083 | 1 040 | ||||||
| 2025-07-14 | 13F | MY Wealth Management Inc. | 3 743 | −8,19 | 481 | 3,89 | ||||
| 2025-07-21 | 13F | Washington Growth Strategies Llc | 0 | −100,00 | 0 | |||||
| 2025-08-12 | 13F | Jaffetilchin Investment Partners, LLC | 2 044 | −5,63 | 263 | 6,50 | ||||
| 2025-08-05 | 13F | Sigma Planning Corp | 19 466 | 8,79 | 2 504 | 23,00 | ||||
| 2025-07-15 | 13F | Affinity Wealth Management Llc | 317 585 | −0,63 | 40 851 | 12,35 | ||||
| 2025-08-07 | 13F | Allworth Financial LP | 525 | 68 | ||||||
| 2025-07-30 | 13F | Capital Wealth Alliance, LLC | 1 800 | 0,00 | 232 | 13,24 | ||||
| 2025-07-02 | 13F | HBW Advisory Services LLC | 28 278 | 173,51 | 3 637 | 209,27 | ||||
| 2025-08-11 | 13F | Brass Tax Wealth Management, Inc | 7 667 | −10,35 | 986 | 1,44 | ||||
| 2025-09-04 | 13F/A | Advisor Group Holdings, Inc. | 453 697 | 20,53 | 58 397 | 36,29 | ||||
| 2025-07-31 | 13F | Oppenheimer & Co Inc | 10 265 | −4,90 | 1 320 | 7,58 | ||||
| 2025-07-11 | 13F | Ullmann Financial Group, Inc. | 36 907 | 0,08 | 4 747 | 13,16 | ||||
| 2025-08-04 | 13F | Arkadios Wealth Advisors | 9 221 | 0,67 | 1 186 | 13,82 | ||||
| 2025-08-12 | 13F | Spectrum Wealth Advisory Group, LLC | 23 284 | −0,18 | 2 995 | 12,89 | ||||
| 2025-08-14 | 13F | D. E. Shaw & Co., Inc. | 2 113 | 272 | ||||||
| 2025-07-11 | 13F | Seacrest Wealth Management, Llc | 5 994 | 132,42 | 771 | 163,14 | ||||
| 2025-08-13 | 13F | Beacon Pointe Advisors, LLC | 2 667 | 12,82 | 343 | 27,99 | ||||
| 2025-08-14 | 13F | Mercer Global Advisors Inc /adv | 4 212 | 5,06 | 542 | 18,64 | ||||
| 2025-08-05 | 13F | Atlas Private Wealth Advisors | 2 962 | 22,19 | 381 | 38,55 | ||||
| 2025-07-31 | 13F | Cornerstone Management, Inc. | 12 091 | 1 555 | ||||||
| 2025-05-15 | 13F | Millennium Management Llc | 0 | −100,00 | 0 | −100,00 | ||||
| 2025-08-15 | 13F | Nikulski Financial, Inc. | 2 551 | 328 | ||||||
| 2025-07-23 | 13F | Gentry Private Wealth, Llc | 2 457 | −1,48 | 316 | 11,66 | ||||
| 2025-08-08 | 13F | Kingsview Wealth Management, LLC | 16 302 | 20,22 | 2 097 | 35,93 | ||||
| 2025-07-22 | 13F | Hrc Wealth Management, Llc | 2 669 | −12,86 | 343 | −1,44 | ||||
| 2025-08-01 | 13F | Gwn Securities Inc. | 2 155 | −70,90 | 277 | −69,19 | ||||
| 2025-08-19 | 13F | Newbridge Financial Services Group, Inc. | 101 | 0,00 | 13 | 18,18 | ||||
| 2025-08-11 | 13F | Comprehensive Wealth Management, LLC | 8 414 | −40,21 | 1 082 | −32,37 | ||||
| 2025-08-14 | 13F | Aqr Capital Management Llc | 14 036 | 9,36 | 1 805 | 23,63 | ||||
| 2025-07-16 | 13F | Register Financial Advisors LLC | 107 | 0,00 | 14 | 8,33 | ||||
| 2025-08-14 | 13F | CIBC World Markets Inc. | 8 603 | −8,01 | 1 107 | 4,05 | ||||
| 2025-08-12 | 13F | Nemes Rush Group LLC | 0 | −100,00 | 0 | |||||
| 2025-07-29 | 13F | Stratos Wealth Partners, LTD. | 20 252 | 4,72 | 2 605 | 18,41 | ||||
| 2025-04-21 | 13F | Nelson, Van Denburg & Campbell Wealth Management Group, LLC | 0 | −100,00 | 0 | |||||
| 2025-08-14 | 13F | Glenmede Investment Management, LP | 1 420 | 183 | ||||||
| 2025-03-28 | 13F/A | Berkeley, Inc | 0 | −100,00 | 0 | |||||
| 2025-07-16 | 13F | Independent Wealth Network Inc. | 8 644 | 6,78 | 1 112 | 20,76 | ||||
| 2025-07-30 | 13F | Fiduciary Planning LLC | 38 726 | −6,43 | 4 981 | 5,80 | ||||
| 2025-08-11 | 13F | Independent Advisor Alliance | 3 062 | 394 | ||||||
| 2025-07-09 | 13F | Fermata Advisors, LLC | 3 213 | −74,79 | 413 | −71,50 | ||||
| 2025-04-08 | 13F | Parallel Advisors, LLC | 0 | −100,00 | 0 | |||||
| 2025-09-11 | 13F | Milestones Private Investment Advisors LLC | 3 944 | 507 | ||||||
| 2025-07-22 | 13F | Coastal Investment Advisors, Inc. | 0 | −100,00 | 0 | |||||
| 2025-07-08 | 13F | Goldstone Financial Group, LLC | 2 407 | 0,59 | 314 | 15,44 | ||||
| 2025-08-05 | 13F | GPS Wealth Strategies Group, LLC | 244 | 0,00 | 31 | 14,81 | ||||
| 2025-04-21 | 13F | Centennial Wealth Advisory LLC | 0 | −100,00 | 0 | |||||
| 2025-07-23 | 13F | Foresight Capital Management Advisors, Inc. | 15 339 | −14,41 | 1 973 | −3,19 | ||||
| 2025-07-17 | 13F | Janney Montgomery Scott LLC | 8 492 | −8,99 | 1 | 0,00 |
Other Listings
| MX:XMMO |