Grundläggande statistik
| Institutionella aktier (lång) | 213 008 732 - 67,48% (ex 13D/G) - change of 6,79MM shares 3,29% MRQ |
| Institutionellt värde (lång) | $ 10 466 719 USD ($1000) |
Institutionellt ägande och aktieägare
Viking Holdings Ltd (US:VIK) har 365 Institutionella ägare och aktieägare som har lämnat in 13D/G- eller 13F-formulär till Securities Exchange Commission (SEC). Dessa institut innehar totalt 213,008,732 aktier. Största aktieägare inkluderar Capital Research Global Investors, Canada Pension Plan Investment Board, Select Equity Group, L.P., T. Rowe Price Investment Management, Inc., Invesco Ltd., Fmr Llc, Holocene Advisors, LP, BlackRock, Inc., Massachusetts Financial Services Co /ma/, and Norges Bank .
Viking Holdings Ltd (NYSE:VIK) Institutionell ägarstruktur visar institutioners och fonders nuvarande positioner i företaget, samt de senaste förändringarna i positionernas storlek. Större aktieägare kan vara enskilda investerare, fonder, hedgefonder eller institutioner. Bilaga 13D visar att investeraren äger (eller ägde) mer än 5% av företaget och avser (eller avsåg) att aktivt eftersträva en förändring av affärsstrategin. Schedule 13G indikerar en passiv investering på över 5%.
The share price as of September 9, 2025 is 63,66 / share. Previously, on September 10, 2024, the share price was 31,28 / share. This represents an increase of 103,52% over that period.

Fondsentimentets poäng
Fondsentimentet poängen(fka Ägarackumulation-poäng) visar vilka aktier som är mest köpta av fonder. Det är resultatet av en sofistikerad kvantitativ flerfaktormodell som identifierar företag med de högsta nivåerna av institutionell ackumulering. Poängsättningsmodellen använder en kombination av den totala ökningen av redovisade ägare, förändringarna i portföljallokeringarna för dessa ägare och andra mått. Siffran sträcker sig från 0 till 100, där högre siffror indikerar en högre nivå av ackumulering i förhållande till sina konkurrenter, och 50 är genomsnittet.
Uppdateringsfrekvens: Dagligen
Se Ownership Explorer, som innehåller en lista över de högst rankade företagen.
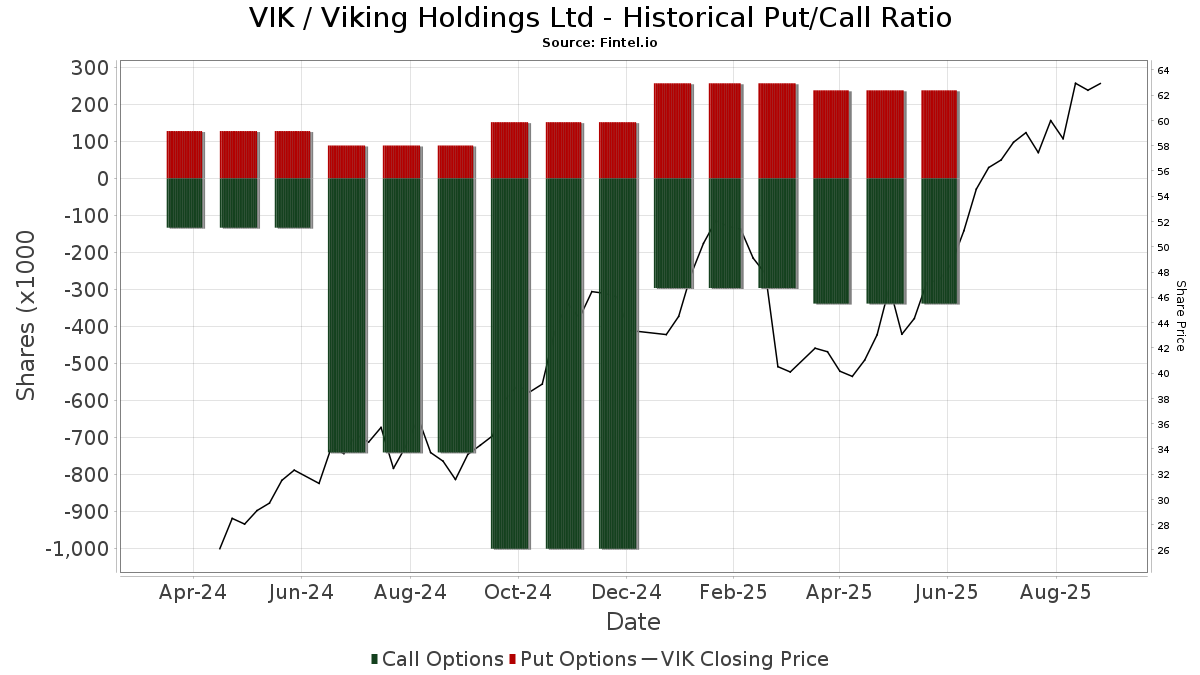
Institutionell sälj/köp-kvot
Förutom att rapportera vanliga eget kapital- och skuldemissioner måste institutioner med mer än 100MM tillgångar under förvaltning också avslöja sina innehav av sälj- och köpoptioner. Eftersom säljoptioner i allmänhet indikerar ett negativt sentiment och köpoptioner indikerar ett positivt sentiment, kan vi få en uppfattning om det övergripande institutionella sentimentet genom att plotta förhållandet mellan säljoptioner och köpoptioner. Diagrammet till höger visar det historiska förhållandet mellan sälj- och köpoptioner för detta instrument.
Genom att använda sälj/köp-kvoten som en indikator på aktieägarnas sentiment undviker man en av de största bristerna med att använda det totala institutionella ägandet, nämligen att en betydande del av de förvaltade tillgångarna investeras passivt för att följa index. Passivt förvaltade fonder köper vanligtvis inte optioner, så indikatorn för sälj/köp-kvoten ger en bättre bild av stämningen i aktivt förvaltade fonder.
13D/G-Arkiveringar
Vi presenterar 13D/G-arkiveringar separat från 13F-arkiveringar på grund av att de behandlas olika av SEC. 13D/G-arkiveringar kan lämnas in av grupper av investerare (med en ledare), medan 13F-arkiveringar inte kan det. Detta leder till situationer där en investerare kan lämna in en 13D/G-ansökan med ett värde för de totala aktierna (vilket motsvarar alla aktier som ägs av investerargruppen), men sedan lämna in en 13F-ansökan med ett annat värde för de totala aktierna (vilket motsvarar enbart deras eget ägande). Detta innebär att aktieägandet i 13D/G-arkiveringar och 13F-arkiveringar ofta inte är direkt jämförbara, så vi presenterar dem separat.
Notera: Från och med den 16 maj 2021 visar vi inte längre ägare som inte har lämnat in en 13D/G under det senaste året. Tidigare visade vi hela historiken för 13D/G-arkiveringar. I allmänhet måste enheter som är skyldiga att lämna in 13D/G-arkiveringar lämna in minst en gång per år innan de lämnar in en stängningsarkivering. Fonder avslutar dock ibland positioner utan att lämna in en avslutande arkivering (dvs. de avvecklar), så att visa hela historiken resulterade ibland i förvirring om det nuvarande ägandet. För att förhindra förvirring visar vi nu endast "nuvarande" ägare - det vill säga ägare som har lämnat in en ansökan under det senaste året.
Upgrade to unlock premium data.
| Fil Datum | Formulär | Investerare | Föregående aktier |
Senaste aktier |
Δ Aktier (Procent) |
Ägande (Procent) |
Δ Ägande (Procent) |
|
|---|---|---|---|---|---|---|---|---|
| 2025-08-14 | TPG GP A, LLC | 21,438,949 | 0 | -100.00 | 0.00 | -100.00 | ||
| 2025-08-14 | CANADA PENSION PLAN INVESTMENT BOARD | 40,437,712 | 31,344,744 | -22.49 | 9.90 | -22.66 | ||
| 2025-07-07 | Capital Research Global Investors | 28,167,867 | 32,238,381 | 14.45 | 10.20 | 14.61 | ||
| 2025-02-14 | Select Equity Group, L.P. | 17,279,911 | 5.70 | |||||
| 2024-12-02 | Viking Capital Ltd | 227,571,340 | 236,304,740 | 3.84 | 53.60 | 1.71 |
13F- och NPORT-arkiveringar
Detaljer om 13F-arkiveringar är gratis. Detaljer om NP-arkiveringar kräver ett premiummedlemskap. Gröna rader indikerar nya positioner. Röda rader indikerar stängda positioner. Klicka på länk symbolen för att se hela transaktionshistoriken.
Uppgradera
för att låsa upp premiumdata och exportera till Excel ![]() .
.
| Fil Datum | Källa | Investerare | Typ | Genomsnittligt pris (beräknat) |
Aktier | Δ Aktier (%) |
Rapporterat värde (1000 USD) |
Δ Värde (%) |
Portföljallokering (%) |
|
|---|---|---|---|---|---|---|---|---|---|---|
| 2025-07-07 | 13F | HMS Capital Management, LLC | 4 824 | 257 | ||||||
| 2025-05-13 | 13F | Seven Grand Managers, Llc | 0 | −100,00 | 0 | |||||
| 2025-08-14 | 13F | Ubs Asset Management Americas Inc | 123 138 | 6 562 | ||||||
| 2025-08-13 | 13F | Blueshift Asset Management, LLC | 0 | −100,00 | 0 | |||||
| 2025-07-14 | 13F | AdvisorNet Financial, Inc | 4 | −84,62 | 0 | −100,00 | ||||
| 2025-08-14 | 13F | Fund 1 Investments, LLC | 0 | −100,00 | 0 | |||||
| 2025-08-26 | NP | TMSL - T. Rowe Price Small-Mid Cap ETF | 32 930 | 18,27 | 1 755 | 58,59 | ||||
| 2025-08-01 | 13F | Teacher Retirement System Of Texas | 547 695 | −31,07 | 29 187 | −7,60 | ||||
| 2025-04-07 | 13F/A | Wealth High Governance Capital Ltda | 0 | −100,00 | 0 | |||||
| 2025-08-14 | 13F | Fortress Investment Group LLC | 0 | −100,00 | 0 | |||||
| 2025-08-15 | 13F | WealthCollab, LLC | 25 | 0,00 | 1 | |||||
| 2025-08-08 | 13F | New England Capital Financial Advisors LLC | 170 | 0,00 | 9 | 50,00 | ||||
| 2025-08-13 | 13F | OMERS ADMINISTRATION Corp | 15 500 | −37,50 | 826 | −16,24 | ||||
| 2025-08-14 | 13F | Utah Retirement Systems | 10 744 | 573 | ||||||
| 2025-08-04 | 13F | Spire Wealth Management | 14 805 | 789 | ||||||
| 2025-07-22 | 13F | Merit Financial Group, LLC | 19 379 | −0,77 | 1 033 | 32,99 | ||||
| 2025-05-15 | 13F | Federation des caisses Desjardins du Quebec | 0 | −100,00 | 0 | |||||
| 2025-08-05 | 13F | Versor Investments LP | 12 165 | 53,33 | 648 | 105,71 | ||||
| 2025-05-15 | 13F | Scientech Research LLC | 0 | −100,00 | 0 | |||||
| 2025-08-12 | 13F | Franklin Resources Inc | 1 015 800 | −58,82 | 54 132 | −44,80 | ||||
| 2025-07-16 | 13F | Brown, Lisle/cummings, Inc. | 500 | 0,00 | 27 | 36,84 | ||||
| 2025-07-22 | NP | DSMFX - Destinations Small-Mid Cap Equity Fund Class I | 18 302 | −47,91 | 817 | −51,66 | ||||
| 2025-05-29 | NP | MEFAX - MassMutual Select Mid Cap Growth Fund Class A | 492 769 | 0,65 | 19 588 | −9,19 | ||||
| 2025-08-14 | 13F | Treasurer of the State of North Carolina | 94 950 | 5 | ||||||
| 2025-08-14 | 13F | Sei Investments Co | 320 657 | −4,62 | 17 088 | 27,87 | ||||
| 2025-08-12 | 13F | Prudential Financial Inc | 5 690 | 303 | ||||||
| 2025-08-13 | 13F | Natixis Advisors, L.p. | 10 076 | 0,05 | 1 | |||||
| 2025-08-14 | 13F | Longaeva Partners L.P. | 336 233 | 10,70 | 17 918 | 48,42 | ||||
| 2025-07-30 | 13F | Pittenger & Anderson Inc | 500 | 27 | ||||||
| 2025-07-31 | 13F | Carnegie Capital Asset Management, LLC | 39 105 | 4,41 | 2 084 | 62,99 | ||||
| 2025-08-14 | 13F | UBS Group AG | Call | 0 | −100,00 | 0 | −100,00 | |||
| 2025-07-11 | 13F | Harbour Capital Advisors, LLC | 15 180 | −2,50 | 828 | 38,93 | ||||
| 2025-08-21 | NP | LIONX - Issachar Fund Class N Shares | 7 200 | 384 | ||||||
| 2025-08-14 | 13F | Point72 (DIFC) Ltd | 0 | −100,00 | 0 | |||||
| 2025-08-13 | 13F | Capula Management Ltd | 0 | −100,00 | 0 | |||||
| 2025-08-15 | 13F | Morgan Stanley | 1 692 363 | 8,58 | 90 186 | 45,57 | ||||
| 2025-08-05 | 13F | Simplex Trading, Llc | 0 | −100,00 | 0 | |||||
| 2025-08-13 | 13F | Twin Peaks Wealth Advisors, LLC | 2 | 0 | ||||||
| 2025-08-13 | 13F | Orvieto Partners, L.P. | 20 000 | 0,00 | 1 066 | 33,96 | ||||
| 2025-08-14 | 13F | Boothbay Fund Management, Llc | 215 423 | −10,55 | 11 480 | 19,91 | ||||
| 2025-08-14 | 13F | Quarry LP | 576 | 31 | ||||||
| 2025-08-13 | 13F | Northwestern Mutual Wealth Management Co | 0 | −100,00 | 0 | |||||
| 2025-08-14 | 13F | 140 Summer Partners LP | 946 337 | −7,91 | 50 430 | 23,46 | ||||
| 2025-07-21 | 13F | River Street Advisors LLC | 15 998 | 853 | ||||||
| 2025-08-29 | NP | JAFEX - Total Stock Market Index Trust NAV | 5 057 | 3,56 | 269 | 38,66 | ||||
| 2025-08-14 | 13F | Quantedge Capital Pte Ltd | 0 | −100,00 | 0 | |||||
| 2025-08-12 | 13F | Proequities, Inc. | 0 | 0 | ||||||
| 2025-06-30 | NP | AIM INTERNATIONAL MUTUAL FUNDS (INVESCO INTERNATIONAL MUTUAL FUNDS) - Invesco Oppenheimer Global Opportunities Fund Class R5 | 322 486 | 13 232 | ||||||
| 2025-08-05 | 13F | American Capital Advisory, LLC | 4 | −78,95 | 0 | |||||
| 2025-08-12 | 13F | Rhumbline Advisers | 216 845 | 3 277,65 | 11 556 | 4 431,37 | ||||
| 2025-08-04 | 13F | Simon Quick Advisors, Llc | 16 973 | −2,26 | 904 | 31,01 | ||||
| 2025-06-26 | NP | KCGIX - Knights of Columbus Large Cap Growth Fund I Shares | 41 316 | 1 695 | ||||||
| 2025-08-08 | 13F/A | Sterling Capital Management LLC | 308 | 16 | ||||||
| 2025-08-14 | 13F | UBS Group AG | 1 011 124 | −15,96 | 53 883 | 12,67 | ||||
| 2025-08-27 | NP | OHIO NATIONAL FUND INC - ON Janus Henderson Enterprise Portfolio | 6 913 | 11,50 | 368 | 49,59 | ||||
| 2025-07-23 | 13F | Maryland State Retirement & Pension System | 9 879 | 526 | ||||||
| 2025-08-14 | 13F | Headlands Technologies LLC | 7 325 | 390 | ||||||
| 2025-07-25 | 13F | Richardson Financial Services Inc. | 16 | 0,00 | 1 | |||||
| 2025-08-14 | 13F | Two Sigma Investments, Lp | 2 089 788 | −3,39 | 111 365 | 29,52 | ||||
| 2025-08-14 | 13F | FACT Capital, LP | 204 944 | 0,00 | 10 921 | 34,07 | ||||
| 2025-08-28 | NP | TIAA SEPARATE ACCOUNT VA 1 - Stock Index Account Teachers Personal Annuity Individual Deferred Variable Annuity | 4 441 | 237 | ||||||
| 2025-08-08 | 13F | Principal Financial Group Inc | 50 805 | 2 707 | ||||||
| 2025-04-30 | 13F | China Universal Asset Management Co., Ltd. | 0 | −100,00 | 0 | |||||
| 2025-08-13 | 13F | Invesco Ltd. | 10 577 113 | 400,30 | 563 654 | 570,71 | ||||
| 2025-07-09 | 13F | Radnor Capital Management, LLC | 28 430 | 6,96 | 2 | 0,00 | ||||
| 2025-08-12 | 13F | CIBC Private Wealth Group, LLC | 125 | −16,67 | 7 | 20,00 | ||||
| 2025-07-28 | 13F | Td Asset Management Inc | 953 410 | 36,00 | 50 807 | 82,33 | ||||
| 2025-07-02 | 13F | Central Pacific Bank - Trust Division | 11 887 | 2,36 | 633 | 37,31 | ||||
| 2025-07-22 | 13F | Knights of Columbus Asset Advisors LLC | 42 404 | 51,69 | 2 260 | 103,33 | ||||
| 2025-08-14 | 13F | Raymond James Financial Inc | 397 671 | −26,33 | 21 192 | −1,24 | ||||
| 2025-08-18 | 13F | Geneos Wealth Management Inc. | 300 | 0,00 | 16 | 36,36 | ||||
| 2025-05-05 | 13F | Lindbrook Capital, Llc | 0 | −100,00 | 0 | −100,00 | ||||
| 2025-08-12 | 13F | Picton Mahoney Asset Management | 7 096 | 0 | ||||||
| 2025-08-14 | 13F | Skye Global Management LP | 33 600 | 1 791 | ||||||
| 2025-08-05 | 13F | Key FInancial Inc | 200 | 0,00 | 11 | 42,86 | ||||
| 2025-07-24 | 13F | IFP Advisors, Inc | 50 | 0,00 | 3 | 100,00 | ||||
| 2025-08-13 | 13F | Colonial Trust Advisors | 73 615 | 19,60 | 3 923 | 60,34 | ||||
| 2025-05-29 | NP | PUTNAM VARIABLE TRUST - Putnam VT Research Fund Class IA Shares | 7 244 | 0,00 | 288 | −10,03 | ||||
| 2025-08-13 | 13F | State Board Of Administration Of Florida Retirement System | 11 315 | 603 | ||||||
| 2025-07-30 | NP | ONOF - Global X Adaptive U.S. Risk Management ETF This fund is a listed as child fund of Mirae Asset Global Investments Co., Ltd. and if that institution has disclosed ownership in this security, then these positions will not be double counted when calculating total shares and total value | 301 | 13 | ||||||
| 2025-08-12 | 13F | DnB Asset Management AS | 397 465 | −54,54 | 21 181 | −39,09 | ||||
| 2025-08-14 | 13F | Group One Trading, L.p. | 77 | −98,97 | 4 | −98,65 | ||||
| 2025-08-14 | 13F | Prelude Capital Management, Llc | 11 258 | −57,34 | 600 | −42,90 | ||||
| 2025-03-31 | NP | PNRAX - Putnam Research Fund Class A Shares | 41 659 | −18,30 | 2 109 | 5,40 | ||||
| 2025-08-14 | 13F | Discovery Capital Management, Llc / Ct | 100 000 | 5 329 | ||||||
| 2025-05-29 | NP | HCIGX - The Institutional Growth Equity Portfolio HC Strategic Shares | 0 | −100,00 | 0 | −100,00 | ||||
| 2025-05-30 | NP | WIGTX - Seven Canyons World Innovators Fund Institutional Class | 18 400 | 731 | ||||||
| 2025-08-14 | 13F | ThornTree Capital Partners LP | 785 860 | −18,06 | 41 878 | 9,85 | ||||
| 2025-08-14 | 13F | Mml Investors Services, Llc | 5 326 | 0 | ||||||
| 2025-08-11 | 13F | Greenland Capital Management LP | 0 | −100,00 | 0 | |||||
| 2025-08-13 | 13F | Federated Hermes, Inc. | 1 759 101 | 4,43 | 93 742 | 40,00 | ||||
| 2025-08-13 | 13F | ExodusPoint Capital Management, LP | 0 | −100,00 | 0 | |||||
| 2025-08-22 | NP | Columbia Funds Variable Series Trust II - Columbia Variable Portfolio - Mid Cap Growth Fund Class 3 | 107 953 | −1,08 | 5 753 | 32,63 | ||||
| 2025-07-24 | 13F | U S Global Investors Inc | 0 | −100,00 | 0 | |||||
| 2025-08-27 | 13F/A | Squarepoint Ops LLC | 0 | −100,00 | 0 | −100,00 | ||||
| 2025-08-15 | 13F | Blue Chip Partners, Inc. | 11 170 | 10,91 | 595 | 48,75 | ||||
| 2025-08-12 | 13F | Artisan Partners Limited Partnership | 2 198 739 | 2,07 | 117 171 | 36,83 | ||||
| 2025-08-13 | 13F | Raab & Moskowitz Asset Management LLC | 9 455 | 504 | ||||||
| 2025-08-19 | 13F | Campbell Capital Management Inc | 25 000 | 1 332 | ||||||
| 2025-07-31 | 13F | Cambridge Investment Research Advisors, Inc. | 7 805 | 48,55 | 0 | |||||
| 2025-08-08 | 13F | SG Americas Securities, LLC | 0 | −100,00 | 0 | |||||
| 2025-05-15 | 13F | Weiss Asset Management LP | 24 995 | 24,98 | 994 | 42,47 | ||||
| 2025-08-12 | 13F | American Century Companies Inc | 881 213 | 0,70 | 46 960 | 35,01 | ||||
| 2025-08-08 | 13F | Your Advocates Ltd., LLP | 100 | 0,00 | 5 | 66,67 | ||||
| 2025-05-29 | NP | JACFX - John Hancock Mid Cap Growth Fund Class NAV | 265 053 | −22,75 | 10 536 | −30,31 | ||||
| 2025-05-06 | 13F | MCF Advisors LLC | 0 | −100,00 | 0 | |||||
| 2025-08-13 | 13F | Capital Fund Management S.a. | 0 | −100,00 | 0 | |||||
| 2025-08-07 | 13F | Allworth Financial LP | 150 | −1,32 | 8 | 16,67 | ||||
| 2025-08-14 | 13F | Voya Investment Management Llc | 88 310 | 4 706 | ||||||
| 2025-07-14 | 13F | Westend Capital Management LLC | 279 771 | 3,25 | 14 909 | 38,42 | ||||
| 2025-08-11 | 13F | Monashee Investment Management LLC | 0 | −100,00 | 0 | |||||
| 2025-08-13 | 13F | Hsbc Holdings Plc | 57 526 | −17,76 | 3 077 | 12,92 | ||||
| 2025-08-26 | NP | WCFOX - WCM Focused International Opportunities Fund Investor Class Shares | 19 380 | −1,33 | 1 033 | 32,31 | ||||
| 2025-08-05 | 13F | Pier Capital, LLC | 90 | 0,00 | 5 | 33,33 | ||||
| 2025-08-12 | 13F | Catalyst Funds Management Pty Ltd | 0 | −100,00 | 0 | |||||
| 2025-08-12 | 13F | Coldstream Capital Management Inc | 0 | −100,00 | 0 | |||||
| 2025-07-24 | 13F | Costello Asset Management, INC | 964 | 14,63 | 51 | 54,55 | ||||
| 2025-08-06 | 13F | Nvwm, Llc | 13 169 | −39,23 | 702 | −18,58 | ||||
| 2025-08-18 | 13F/A | National Bank Of Canada /fi/ | 256 083 | 13 647 | ||||||
| 2025-08-14 | 13F | Riposte Capital Llc | 200 000 | 100,00 | 10 658 | 168,13 | ||||
| 2025-03-31 | NP | PCONX - PUTNAM CONVERTIBLE SECURITIES FUND Class C Shares | 54 280 | 0,00 | 2 748 | 29,01 | ||||
| 2025-08-14 | 13F | Ionic Capital Management LLC | 4 254 | −16,23 | 227 | 12,44 | ||||
| 2025-08-12 | 13F | Deutsche Bank Ag\ | 9 563 | 45,49 | 510 | 95,02 | ||||
| 2025-08-12 | 13F | Park Square Financial Group, LLC | 300 | 0,00 | 16 | 36,36 | ||||
| 2025-08-13 | 13F | Diametric Capital, LP | 18 275 | 124,62 | 974 | 201,24 | ||||
| 2025-07-31 | 13F | Briaud Financial Planning, Inc | 300 | 0 | ||||||
| 2025-08-14 | 13F | Man Group plc | 689 162 | 66,16 | 36 725 | 122,76 | ||||
| 2025-08-04 | 13F | Strs Ohio | 4 858 | 259 | ||||||
| 2025-08-14 | 13F | FIL Ltd | 109 719 | 5 847 | ||||||
| 2025-05-15 | 13F | Aqr Capital Management Llc | 0 | −100,00 | 0 | −100,00 | ||||
| 2025-05-30 | NP | MML SERIES INVESTMENT FUND - MML Mid Cap Growth Fund Initial Class | 33 902 | 8,90 | 1 348 | −1,75 | ||||
| 2025-08-14 | 13F | Daiwa Securities Group Inc. | 17 300 | 1 | ||||||
| 2025-05-12 | 13F | Pinpoint Asset Management Ltd | 14 993 | 596 | ||||||
| 2025-08-14 | 13F | Millennium Management Llc | 267 823 | −79,66 | 14 272 | −72,73 | ||||
| 2025-08-11 | 13F | VSM Wealth Advisory, LLC | 40 | 0,00 | 2 | 100,00 | ||||
| 2025-08-08 | 13F | Massachusetts Financial Services Co /ma/ | 4 501 814 | 69,35 | 239 902 | 127,04 | ||||
| 2025-08-14 | 13F | Lighthouse Investment Partners, LLC | 329 743 | 17 572 | ||||||
| 2025-08-06 | 13F | Golden State Wealth Management, LLC | 1 982 | 20,12 | 106 | 61,54 | ||||
| 2025-08-08 | 13F | Hartland & Co., LLC | 235 | −22,70 | 13 | 0,00 | ||||
| 2025-08-04 | 13F | GAM Holding AG | 224 801 | −31,04 | 11 980 | −7,56 | ||||
| 2025-07-25 | NP | CBSAX - Columbia Mid Cap Growth Fund Class A | 400 194 | −21,05 | 17 865 | −26,73 | ||||
| 2025-07-25 | 13F | Asset Planning,Inc | 6 135 | 0,00 | 327 | 34,16 | ||||
| 2025-08-14 | 13F | Tudor Investment Corp Et Al | 961 020 | 42,07 | 51 213 | 90,47 | ||||
| 2025-08-14 | 13F | Tudor Investment Corp Et Al | Call | 5 600 | 298 | |||||
| 2025-08-14 | 13F | Goldman Sachs Group Inc | 1 090 795 | −13,40 | 58 128 | 16,10 | ||||
| 2025-08-13 | 13F | Healthcare Of Ontario Pension Plan Trust Fund | 500 000 | −50,00 | 26 645 | −32,97 | ||||
| 2025-08-13 | 13F | Russell Investments Group, Ltd. | 321 627 | 13,50 | 17 128 | 52,05 | ||||
| 2025-08-14 | 13F | Tudor Investment Corp Et Al | Put | 5 900 | −25,32 | 314 | 0,00 | |||
| 2025-08-14 | 13F | Citadel Advisors Llc | 3 523 699 | 3,78 | 187 778 | 39,12 | ||||
| 2025-08-14 | 13F | Citadel Advisors Llc | Call | 30 400 | 216,67 | 1 620 | 325,20 | |||
| 2025-08-14 | 13F | Citadel Advisors Llc | Put | 77 100 | −15,92 | 4 109 | 12,70 | |||
| 2025-08-19 | 13F | Hohimer Wealth Management, Llc | 14 405 | 768 | ||||||
| 2025-08-27 | NP | Aim Variable Insurance Funds (invesco Variable Insurance Funds) - Invesco V.i. Global Core Equity Fund Series I | 14 876 | 793 | ||||||
| 2025-07-28 | 13F | BRYN MAWR TRUST Co | 8 028 | 11,22 | 428 | 49,30 | ||||
| 2025-08-14 | 13F | Point72 Asia (Singapore) Pte. Ltd. | 0 | −100,00 | 0 | |||||
| 2025-08-14 | 13F | Driehaus Capital Management Llc | 277 191 | 6,38 | 14 772 | 42,62 | ||||
| 2025-08-28 | NP | SLGFX - SIMT Large Cap Index Fund Class F | 4 100 | 218 | ||||||
| 2025-08-14 | 13F | Goldentree Asset Management Lp | 0 | −100,00 | 0 | |||||
| 2025-08-14 | 13F | Engineers Gate Manager LP | 95 041 | −57,37 | 5 065 | −42,86 | ||||
| 2025-08-13 | 13F | Arrowstreet Capital, Limited Partnership | 13 792 | −98,57 | 735 | −98,08 | ||||
| 2025-07-28 | 13F | Harbour Investments, Inc. | 1 277 | 0,00 | 68 | 36,00 | ||||
| 2025-08-06 | 13F | Harvest Portfolios Group Inc. | 28 920 | 9,19 | 1 541 | 46,48 | ||||
| 2025-08-14 | 13F | Money Concepts Capital Corp | 22 541 | −1,79 | 1 201 | 31,69 | ||||
| 2025-08-12 | 13F | Nuveen, LLC | 551 689 | 29 400 | ||||||
| 2025-08-14 | 13F | Wellington Management Group Llp | 114 685 | −94,88 | 6 112 | −93,14 | ||||
| 2025-08-08 | 13F | Pnc Financial Services Group, Inc. | 117 | 6 | ||||||
| 2025-05-09 | 13F | Levin Capital Strategies, L.p. | 0 | −100,00 | 0 | −100,00 | ||||
| 2025-08-13 | 13F | Walleye Trading LLC | Put | 30 800 | −14,92 | 1 641 | 14,12 | |||
| 2025-08-13 | 13F | Walleye Trading LLC | Call | 78 900 | 162,13 | 4 205 | 251,51 | |||
| 2025-05-14 | 13F | Natixis | 0 | −100,00 | 0 | −100,00 | ||||
| 2025-08-04 | 13F | Amalgamated Bank | 15 297 | 1 | ||||||
| 2025-07-31 | 13F | R Squared Ltd | 7 225 | 385 | ||||||
| 2025-08-14 | 13F | Kovitz Investment Group Partners, LLC | 210 494 | 4,97 | 11 217 | 40,72 | ||||
| 2025-08-14 | 13F | Thunderbird Partners Llp | 0 | −100,00 | 0 | |||||
| 2025-08-27 | NP | AIM VARIABLE INSURANCE FUNDS (INVESCO VARIABLE INSURANCE FUNDS) - Invesco Oppenheimer V.I. Discovery Mid Cap Growth Fund Series II | 203 662 | 0,00 | 10 853 | 34,07 | ||||
| 2025-08-14 | 13F | Point72 Asset Management, L.P. | 2 994 914 | 1 821,32 | 159 599 | 2 475,82 | ||||
| 2025-07-16 | 13F | Moisand Fitzgerald Tamayo, LLC | 182 | 0,00 | 10 | 28,57 | ||||
| 2025-07-31 | 13F | Caitong International Asset Management Co., Ltd | 118 | −91,88 | 6 | −89,47 | ||||
| 2025-08-14 | 13F | Hrt Financial Lp | 0 | −100,00 | 0 | |||||
| 2025-08-14 | 13F | Capstone Investment Advisors, Llc | 11 318 | −10,68 | 603 | 19,88 | ||||
| 2025-08-14 | 13F | Price T Rowe Associates Inc /md/ | 2 397 875 | 75,89 | 128 | 135,19 | ||||
| 2025-08-14 | 13F | Shellback Capital, LP | 0 | −100,00 | 0 | |||||
| 2025-08-04 | 13F | AdvisorShares Investments LLC | 2 178 | −45,55 | 116 | −27,95 | ||||
| 2025-08-01 | 13F | Y-Intercept (Hong Kong) Ltd | 0 | −100,00 | 0 | |||||
| 2025-08-14 | 13F | State Street Corp | 1 812 120 | 34 748,46 | 96 568 | 46 777,18 | ||||
| 2025-08-12 | 13F | Accredited Wealth Management, LLC | 100 | 0,00 | 5 | 66,67 | ||||
| 2025-08-12 | 13F | MAI Capital Management | 5 | 0,00 | 0 | |||||
| 2025-08-13 | 13F | Mackenzie Financial Corp | 7 990 | 426 | ||||||
| 2025-08-13 | 13F | Knollwood Investment Advisory, LLC | 20 037 | 0,00 | 1 068 | 34,05 | ||||
| 2025-08-14 | 13F | Sunbelt Securities, Inc. | 1 998 | 0,00 | 88 | 11,39 | ||||
| 2025-07-17 | 13F | Beacon Capital Management, LLC | 17 | −63,83 | 1 | −100,00 | ||||
| 2025-08-12 | 13F | XTX Topco Ltd | 0 | −100,00 | 0 | |||||
| 2025-08-13 | 13F | Quantbot Technologies LP | 116 609 | 71,43 | 6 214 | 129,89 | ||||
| 2025-07-21 | 13F | Old Second National Bank Of Aurora | 47 428 | 2 527 | ||||||
| 2025-08-21 | NP | MXHYX - Great-West High Yield Bond Fund Investor Class | 36 900 | 0,00 | 1 966 | 34,11 | ||||
| 2025-08-27 | NP | BBGSX - Bridge Builder Small/Mid Cap Growth Fund | 766 099 | 26,45 | 40 825 | 69,52 | ||||
| 2025-08-14 | 13F | Hook Mill Capital Partners, LP | 782 026 | 70,50 | 41 674 | 128,58 | ||||
| 2025-08-13 | 13F | Northern Trust Corp | 404 996 | 1 340,34 | 21 582 | 1 832,14 | ||||
| 2025-08-14 | 13F | Principia Wealth Advisory, LLC | 32 | 28,00 | 2 | 0,00 | ||||
| 2025-08-13 | 13F | Centiva Capital, LP | 0 | −100,00 | 0 | |||||
| 2025-08-14 | 13F | Royal Bank Of Canada | 581 683 | 973,08 | 30 997 | 1 338,38 | ||||
| 2025-08-01 | 13F | Bessemer Group Inc | 25 363 | −0,36 | 1 | 0,00 | ||||
| 2025-08-14 | 13F | Financial Network Wealth Advisors LLC | 100 | 0,00 | 5 | 66,67 | ||||
| 2025-07-14 | 13F | U.S. Capital Wealth Advisors, LLC | 19 260 | 0,00 | 1 026 | 34,12 | ||||
| 2025-08-13 | 13F | New York State Common Retirement Fund | 82 084 | 7 423,74 | 4 | |||||
| 2025-07-24 | 13F | Cascade Investment Group, Inc. | 8 225 | 0,00 | 438 | 34,36 | ||||
| 2025-07-16 | 13F | Signaturefd, Llc | 150 | 8 | ||||||
| 2025-08-11 | 13F | Crestwood Capital Management, L.P. | 391 522 | −8,21 | 20 864 | 23,06 | ||||
| 2025-07-23 | 13F | Vontobel Holding Ltd. | 9 443 | 0,00 | 503 | 34,13 | ||||
| 2025-08-13 | 13F | Amundi | 445 840 | −47,50 | 24 325 | −25,29 | ||||
| 2025-08-13 | 13F | Jones Financial Companies Lllp | 8 664 | 25,69 | 457 | 68,27 | ||||
| 2025-03-31 | NP | Putnam Funds Trust - Putnam Multi-cap Core Fund Class A | 485 273 | −4,41 | 24 569 | 23,30 | ||||
| 2025-05-07 | 13F/A | Symmetry Investments LP | 13 500 | 471 | ||||||
| 2025-08-11 | 13F | Vanguard Group Inc | 590 505 | 414,86 | 31 468 | 590,24 | ||||
| 2025-05-27 | NP | USLUX - Holmes Macro Trends Fund | 10 800 | −45,45 | 429 | −50,80 | ||||
| 2025-06-27 | NP | AAARX - Strategic Allocation: Aggressive Fund R Class This fund is a listed as child fund of American Century Companies Inc and if that institution has disclosed ownership in this security, then these positions will not be double counted when calculating total shares and total value | 5 765 | 0,00 | 237 | −18,90 | ||||
| 2025-08-14 | 13F | Winton Capital Group Ltd | 68 375 | 3 644 | ||||||
| 2025-05-15 | 13F | PharVision Advisers, LLC | 0 | −100,00 | 0 | −100,00 | ||||
| 2025-08-14 | 13F | California State Teachers Retirement System | 12 821 | 683 | ||||||
| 2025-07-16 | 13F | West Branch Capital LLC | 0 | −100,00 | 0 | |||||
| 2025-08-14 | 13F | Bnp Paribas Arbitrage, Sa | 459 758 | −35,13 | 24 501 | −13,04 | ||||
| 2025-08-13 | 13F | Teca Partners, LP | 468 209 | 24 951 | ||||||
| 2025-08-12 | 13F | BlackRock, Inc. | 5 159 986 | 1 311,00 | 274 976 | 1 791,68 | ||||
| 2025-08-13 | 13F | Colonial Trust Co / SC | 38 300 | 34,94 | 2 041 | 80,94 | ||||
| 2025-08-14 | 13F | KADENSA CAPITAL Ltd | 600 187 | 42,41 | 31 984 | 90,92 | ||||
| 2025-08-14 | 13F | Evercore Wealth Management, LLC | 1 678 470 | 6,00 | 89 446 | 42,11 | ||||
| 2025-08-14 | 13F/A | Barclays Plc | 126 289 | −6,02 | 7 | 20,00 | ||||
| 2025-06-27 | NP | TWSMX - Strategic Allocation: Moderate Fund Investor Class This fund is a listed as child fund of American Century Companies Inc and if that institution has disclosed ownership in this security, then these positions will not be double counted when calculating total shares and total value | 5 021 | 0,00 | 206 | −18,90 | ||||
| 2025-07-18 | 13F | Renaissance Capital LLC | 158 875 | 28,51 | 8 466 | 72,28 | ||||
| 2025-04-21 | 13F | Nelson, Van Denburg & Campbell Wealth Management Group, LLC | 0 | −100,00 | 0 | |||||
| 2025-09-04 | 13F/A | Advisor Group Holdings, Inc. | 32 144 | 62,37 | 1 713 | 117,81 | ||||
| 2025-08-14 | 13F | Xponance, Inc. | 28 593 | 1 524 | ||||||
| 2025-07-31 | 13F | CVA Family Office, LLC | 12 | 0,00 | 1 | |||||
| 2025-08-14 | 13F | Pentwater Capital Management LP | 0 | −100,00 | 0 | |||||
| 2025-08-13 | 13F | Walleye Capital LLC | 45 847 | 25,66 | 2 443 | 68,48 | ||||
| 2025-08-13 | 13F | Walleye Capital LLC | Put | 23 100 | −32,46 | 1 231 | −9,49 | |||
| 2025-08-13 | 13F | Walleye Capital LLC | Call | 17 700 | −60,93 | 943 | −47,61 | |||
| 2025-07-24 | 13F | Us Bancorp \de\ | 15 017 | 43,18 | 800 | 92,31 | ||||
| 2025-08-08 | 13F | Pinnbrook Capital Management Lp | 47 213 | 2 516 | ||||||
| 2025-08-14 | 13F | Stifel Financial Corp | 144 619 | 203,53 | 7 707 | 307,08 | ||||
| 2025-07-29 | 13F | Private Trust Co Na | 545 | 29 | ||||||
| 2025-08-07 | 13F | Lisanti Capital Growth, LLC | 33 320 | 0,00 | 1 776 | 34,06 | ||||
| 2025-05-13 | 13F | Quadrature Capital Ltd | 0 | −100,00 | 0 | −100,00 | ||||
| 2025-08-14 | 13F | Hilltop Holdings Inc. | 11 220 | 598 | ||||||
| 2025-08-14 | 13F | Sandia Investment Management LP | 5 000 | −50,00 | 266 | −33,00 | ||||
| 2025-08-14 | 13F | Graham Capital Management, L.P. | 42 603 | 55,64 | 2 270 | 108,64 | ||||
| 2025-06-26 | NP | KCXIX - Knights of Columbus U.S. All Cap Index Fund I Shares | 616 | 25 | ||||||
| 2025-08-27 | NP | ALLIANZ VARIABLE INSURANCE PRODUCTS TRUST - AZL Russell 1000 Growth Index Fund Class 2 | 4 161 | 222 | ||||||
| 2025-08-14 | 13F | Jane Street Group, Llc | Put | 12 600 | −28,41 | 671 | −4,01 | |||
| 2025-08-14 | 13F | Jane Street Group, Llc | 164 792 | 8 782 | ||||||
| 2025-04-25 | NP | PMSAX - Global Multi-Strategy Fund Class A | 959 | −23,03 | 46 | −19,30 | ||||
| 2025-08-11 | 13F | FSC Wealth Advisors, LLC | 110 | 0,00 | 6 | 25,00 | ||||
| 2025-08-14 | 13F | Jane Street Group, Llc | Call | 43 600 | 2 323 | |||||
| 2025-08-11 | 13F | Cornerstone Planning Group LLC | 7 | 0 | ||||||
| 2025-05-29 | NP | MMBUX - MassMutual Select T. Rowe Price Small and Mid Cap Blend Fund Class I | 8 802 | −62,86 | 350 | −66,57 | ||||
| 2025-08-14 | 13F | Susquehanna International Group, Llp | 0 | −100,00 | 0 | |||||
| 2025-08-26 | NP | GEIZX - Growth Equity Index Fund Investor | 2 274 | 121 | ||||||
| 2025-04-29 | NP | SCPAX - Siit Large Cap Disciplined Equity Fund - Class A | 0 | −100,00 | 0 | −100,00 | ||||
| 2025-07-15 | 13F | Public Employees Retirement System Of Ohio | 63 107 | 3 363 | ||||||
| 2025-04-29 | NP | SLCAX - Siit Large Cap Fund - Class A | 0 | −100,00 | 0 | −100,00 | ||||
| 2025-07-24 | 13F | Jfs Wealth Advisors, Llc | 400 | 21 | ||||||
| 2025-08-13 | 13F | Railway Pension Investments Ltd | 319 400 | 17 021 | ||||||
| 2025-07-25 | 13F | Cwm, Llc | 110 | 57,14 | 0 | |||||
| 2025-08-14 | 13F | Sculptor Capital LP | 1 518 000 | 10,24 | 80 894 | 47,79 | ||||
| 2025-07-18 | 13F | Truist Financial Corp | 4 035 | 215 | ||||||
| 2025-05-09 | 13F/A | Oversea-Chinese Banking CORP Ltd | 0 | −100,00 | 0 | −100,00 | ||||
| 2025-06-30 | NP | AIM INVESTMENT FUNDS (INVESCO INVESTMENT FUNDS) - Invesco Oppenheimer Discovery Mid Cap Growth Fund Class R6 | 1 376 810 | 3,53 | 56 491 | −16,10 | ||||
| 2025-05-15 | 13F | Twinbeech Capital Lp | 0 | −100,00 | 0 | −100,00 | ||||
| 2025-08-14 | 13F | Polymer Capital Management (HK) LTD | 5 152 | 275 | ||||||
| 2025-08-13 | 13F | Hbk Investments L P | 20 000 | 1 066 | ||||||
| 2025-08-13 | 13F | Norges Bank | 4 445 687 | 236 911 | ||||||
| 2025-05-30 | NP | RAYD - Rayliant Quantitative Developed Market Equity ETF | 3 924 | −83,35 | 156 | −85,07 | ||||
| 2025-08-14 | 13F | Qube Research & Technologies Ltd | 1 164 474 | −30,09 | 62 055 | −6,28 | ||||
| 2025-08-14 | 13F | Two Sigma Advisers, Lp | 2 612 800 | −14,21 | 139 236 | 15,02 | ||||
| 2025-08-14 | 13F | Quantessence Capital LLC | 0 | −100,00 | 0 | |||||
| 2025-08-14 | 13F | Diversify Wealth Management, Llc | 65 247 | 6,39 | 3 895 | 54,50 | ||||
| 2025-08-11 | 13F | Baldwin Investment Management, LLC | 26 505 | 0,19 | 1 412 | 34,35 | ||||
| 2025-07-22 | 13F | Gsa Capital Partners Llp | 8 733 | −31,14 | 0 | |||||
| 2025-07-24 | 13F | Stonebridge Financial Group, LLC | 0 | −100,00 | 0 | |||||
| 2025-08-14 | 13F | D1 Capital Partners L.P. | 1 150 443 | 61 307 | ||||||
| 2025-08-12 | 13F | LPL Financial LLC | 66 669 | 31,40 | 3 553 | 76,19 | ||||
| 2025-08-14 | 13F | Voloridge Investment Management, Llc | 883 018 | −25,70 | 47 056 | −0,39 | ||||
| 2025-05-12 | 13F | Entropy Technologies, LP | 0 | −100,00 | 0 | |||||
| 2025-08-13 | 13F | EverSource Wealth Advisors, LLC | 89 | −81,80 | 5 | −78,95 | ||||
| 2025-08-14 | 13F | Fmr Llc | 7 139 911 | 15,01 | 380 486 | 54,18 | ||||
| 2025-07-14 | 13F | GAMMA Investing LLC | 19 | 111,11 | 1 | |||||
| 2025-07-16 | 13F | Highline Wealth Partners Llc | 91 | 0,00 | 5 | 33,33 | ||||
| 2025-08-04 | 13F | Wealth Management Associates, Inc. | 4 690 | 250 | ||||||
| 2025-08-14 | 13F | T. Rowe Price Investment Management, Inc. | 12 609 091 | 42,83 | 672 | 91,71 | ||||
| 2025-08-14 | 13F | Mpwm Advisory Solutions, Llc | 200 | 0,00 | 11 | 42,86 | ||||
| 2025-07-08 | 13F | Parallel Advisors, LLC | 69 764 | 9,09 | 3 718 | 46,28 | ||||
| 2025-08-11 | 13F | Citigroup Inc | 33 263 | −70,41 | 1 773 | −60,34 | ||||
| 2025-03-31 | NP | PGEOX - GEORGE PUTNAM FUND OF BOSTON Class A Shares | 93 961 | −20,91 | 4 757 | 2,02 | ||||
| 2025-08-14 | 13F | Select Equity Group, L.P. | 17 880 920 | −4,16 | 952 874 | 28,49 | ||||
| 2025-06-26 | NP | SVBAX - Balanced Fund Class A | 630 773 | 54,81 | 25 881 | 25,45 | ||||
| 2025-06-27 | NP | TWHIX - Heritage Fund Investor Class This fund is a listed as child fund of American Century Companies Inc and if that institution has disclosed ownership in this security, then these positions will not be double counted when calculating total shares and total value | 744 076 | 0,00 | 30 529 | −18,96 | ||||
| 2025-08-08 | 13F | Westbourne Investment Advisors, Inc. | 3 765 | 201 | ||||||
| 2025-08-13 | 13F | Victory Capital Management Inc | 596 148 | 294,79 | 31 769 | 429,29 | ||||
| 2025-08-14 | 13F | Hood River Capital Management LLC | 234 828 | −2,96 | 12 514 | 30,09 | ||||
| 2025-08-14 | 13F | Wells Fargo & Company/mn | 98 929 | 7,18 | 5 272 | 43,66 | ||||
| 2025-07-31 | 13F | Oppenheimer & Co Inc | 7 197 | −6,50 | 384 | 25,57 | ||||
| 2025-08-27 | NP | BBGLX - Bridge Builder Large Cap Growth Fund | 19 673 | 1 048 | ||||||
| 2025-08-14 | 13F | Canada Pension Plan Investment Board | 31 344 744 | −22,49 | 1 670 361 | 3,92 | ||||
| 2025-08-13 | 13F | Capital Analysts, Inc. | 200 | 0 | ||||||
| 2025-08-15 | 13F | Captrust Financial Advisors | 48 800 | 10,10 | 2 601 | 47,64 | ||||
| 2025-08-27 | NP | AWSAX - INVESCO Global Core Equity Fund Class A | 119 714 | 6 380 | ||||||
| 2025-08-14 | 13F | Burkehill Global Management, LP | 400 000 | −46,67 | 21 316 | −28,50 | ||||
| 2025-07-22 | 13F | Chung Wu Investment Group, LLC | 7 100 | 1,43 | 378 | 35,97 | ||||
| 2025-08-08 | 13F | Police & Firemen's Retirement System of New Jersey | 30 706 | 1 636 | ||||||
| 2025-08-14 | 13F | Zimmer Partners, LP | 0 | −100,00 | 0 | |||||
| 2025-08-15 | 13F | Tower Research Capital LLC (TRC) | 2 219 | 79,97 | 118 | 140,82 | ||||
| 2025-08-12 | 13F | Charles Schwab Investment Management Inc | 150 160 | 165,27 | 8 002 | 255,64 | ||||
| 2025-08-13 | 13F | MetLife Investment Management, LLC | 12 638 | 673 | ||||||
| 2025-08-12 | 13F | Pathstone Holdings, LLC | 22 470 | −14,39 | 1 197 | 14,77 | ||||
| 2025-08-14 | 13F | Holocene Advisors, LP | 5 706 427 | 57,91 | 304 095 | 111,70 | ||||
| 2025-08-14 | 13F | Sciencast Management LP | 35 323 | 382,16 | 1 882 | 546,74 | ||||
| 2025-08-14 | 13F | Ameriprise Financial Inc | 510 592 | −0,30 | 27 209 | 33,67 | ||||
| 2025-08-15 | 13F | Morse Asset Management, Inc | 23 249 | 1 239 | ||||||
| 2025-04-29 | NP | PHYIX - PUTNAM HIGH YIELD FUND Class Y Shares | 71 600 | 0,00 | 3 444 | 3,55 | ||||
| 2025-07-29 | 13F | Empirical Asset Management, LLC | 8 880 | −2,20 | 473 | 31,39 | ||||
| 2025-08-08 | 13F | Gts Securities Llc | 0 | −100,00 | 0 | |||||
| 2025-08-08 | 13F | SBI Securities Co., Ltd. | 12 | −45,45 | 1 | |||||
| 2025-07-21 | 13F/A | Point72 Asset Management, L.P. | Call | 0 | −100,00 | 0 | −100,00 | |||
| 2025-08-04 | 13F | Keybank National Association/oh | 5 634 | −38,74 | 300 | −17,81 | ||||
| 2025-08-14 | 13F | GWM Advisors LLC | 1 540 | 6,94 | 82 | 43,86 | ||||
| 2025-08-18 | 13F | N.E.W. Advisory Services LLC | 500 | 0,00 | 27 | 36,84 | ||||
| 2025-07-25 | 13F | Allspring Global Investments Holdings, LLC | 1 094 169 | −6,41 | 59 096 | 24,84 | ||||
| 2025-08-08 | 13F | Vestcor Inc | 0 | −100,00 | 0 | |||||
| 2025-08-11 | 13F | Principal Securities, Inc. | 145 | 8 | ||||||
| 2025-05-29 | NP | PUTNAM VARIABLE TRUST - Putnam VT Sustainable Leaders Fund Class IA Shares | 184 900 | −14,87 | 7 350 | −23,20 | ||||
| 2025-08-21 | NP | MXMGX - Great-West T. Rowe Price Mid Cap Growth Fund Investor Class | 429 461 | 47,56 | 22 886 | 97,83 | ||||
| 2025-07-30 | 13F | Stephens Investment Management Group LLC | 608 493 | 32 427 | ||||||
| 2025-08-14 | 13F | Schonfeld Strategic Advisors LLC | 163 484 | 151,30 | 8 712 | 237,02 | ||||
| 2025-07-11 | 13F | Farther Finance Advisors, LLC | 2 250 | 4 400,00 | 120 | 5 850,00 | ||||
| 2025-08-14 | 13F | LMR Partners LLP | 105 000 | 5 595 | ||||||
| 2025-08-14 | 13F | D. E. Shaw & Co., Inc. | 257 562 | 13 725 | ||||||
| 2025-07-10 | 13F | Atticus Wealth Management, Llc | 10 | 1 | ||||||
| 2025-05-29 | NP | JAEVX - Mid Cap Stock Trust NAV | 131 423 | −18,85 | 5 224 | −26,78 | ||||
| 2025-08-13 | 13F | Renaissance Technologies Llc | 1 374 305 | −39,88 | 73 237 | −19,41 | ||||
| 2025-06-27 | NP | OOTO - Direxion Daily Travel & Vacation Bull 2X Shares | 814 | −37,38 | 33 | −49,23 | ||||
| 2025-05-14 | 13F | EntryPoint Capital, LLC | 0 | −100,00 | 0 | −100,00 | ||||
| 2025-08-12 | 13F | Legal & General Group Plc | 47 710 | 28,69 | 2 543 | 72,57 | ||||
| 2025-07-21 | 13F | Cromwell Holdings LLC | 17 | 1 | ||||||
| 2025-08-11 | 13F | TD Waterhouse Canada Inc. | 1 000 | 0,00 | 54 | 35,00 | ||||
| 2025-07-23 | 13F | Nbt Bank N A /ny | 75 | 0,00 | 4 | 50,00 | ||||
| 2025-08-13 | 13F | Cerity Partners LLC | 8 510 | −55,46 | 453 | −40,32 | ||||
| 2025-05-08 | 13F | Parkside Financial Bank & Trust | 0 | −100,00 | 0 | |||||
| 2025-07-31 | 13F | Optimum Investment Advisors | 427 | 0,00 | 23 | 37,50 | ||||
| 2025-08-14 | 13F | Manufacturers Life Insurance Company, The | 646 807 | −5,41 | 34 468 | 26,82 | ||||
| 2025-06-27 | NP | AACRX - Strategic Allocation: Conservative Fund R Class This fund is a listed as child fund of American Century Companies Inc and if that institution has disclosed ownership in this security, then these positions will not be double counted when calculating total shares and total value | 1 312 | 0,00 | 54 | −19,70 | ||||
| 2025-08-01 | 13F | Envestnet Asset Management Inc | 29 179 | 6,44 | 1 555 | 42,70 | ||||
| 2025-07-09 | 13F | Byrne Asset Management LLC | 120 | −20,00 | 6 | 20,00 | ||||
| 2025-08-12 | 13F | Jefferies Financial Group Inc. | 0 | −100,00 | 0 | |||||
| 2025-08-04 | 13F | Quaker Wealth Management, LLC | Put | 0 | −100,00 | 0 | ||||
| 2025-07-28 | NP | QGRO - American Century STOXX U.S. Quality Growth ETF This fund is a listed as child fund of American Century Companies Inc and if that institution has disclosed ownership in this security, then these positions will not be double counted when calculating total shares and total value | 55 879 | 2 494 | ||||||
| 2025-08-11 | 13F | Primecap Management Co/ca/ | 934 073 | 22,29 | 49 777 | 63,95 | ||||
| 2025-08-07 | 13F | Freemont Management S.A. | 50 000 | 2 664 | ||||||
| 2025-08-13 | 13F | Jump Financial, LLC | 73 892 | −53,99 | 3 938 | −38,33 | ||||
| 2025-08-25 | NP | PRINCIPAL VARIABLE CONTRACTS FUNDS INC - LargeCap Growth Account I Class 1 | 591 | 31 | ||||||
| 2025-08-06 | 13F | Commonwealth Equity Services, Llc | 8 824 | −10,97 | 0 | |||||
| 2025-08-11 | 13F | Westover Capital Advisors, LLC | 4 500 | 240 | ||||||
| 2025-08-14 | 13F | Tpg Gp A, Llc | 0 | −100,00 | 0 | −100,00 | ||||
| 2025-05-15 | 13F | Rakuten Investment Management, Inc. | 325 | 13 | ||||||
| 2025-08-14 | 13F | Steadfast Capital Management Lp | 972 635 | 1 338,81 | 51 832 | 1 828,95 | ||||
| 2025-08-14 | 13F | PDT Partners, LLC | 97 839 | −14,36 | 5 214 | 14,80 | ||||
| 2025-08-14 | 13F | Jain Global LLC | 0 | −100,00 | 0 | |||||
| 2025-08-14 | 13F | Forest Avenue Capital Management LP | 3 801 316 | 164,36 | 202 572 | 254,41 | ||||
| 2025-08-14 | 13F | Nebula Research & Development LLC | 30 257 | 274,98 | 1 612 | 403,75 | ||||
| 2025-08-06 | 13F | Tabor Asset Management, LP | 92 361 | 22,08 | 4 922 | 63,65 | ||||
| 2025-05-13 | 13F | M&G Plc | 0 | −100,00 | 0 | −100,00 | ||||
| 2025-08-13 | 13F | Walleye Trading LLC | 0 | −100,00 | 0 | −100,00 | ||||
| 2025-08-14 | 13F | Mane Global Capital Management Lp | 1 056 961 | 56 325 | ||||||
| 2025-08-14 | 13F | CIBC World Markets Inc. | 31 153 | 12,27 | 1 660 | 50,64 | ||||
| 2025-06-10 | 13F/A | Militia Capital Partners, LP | 0 | −100,00 | 0 | −100,00 | ||||
| 2025-08-18 | 13F | Wolverine Trading, Llc | Call | 30 200 | 36,04 | 1 592 | 82,36 | |||
| 2025-07-30 | 13F | FNY Investment Advisers, LLC | 133 | 0 | ||||||
| 2025-08-12 | 13F | Global Retirement Partners, LLC | 834 | 19,83 | 44 | 46,67 | ||||
| 2025-08-18 | 13F | Wolverine Trading, Llc | Put | 22 300 | 0,00 | 1 176 | 33,98 | |||
| 2025-08-14 | 13F | Verition Fund Management LLC | 192 346 | −43,28 | 10 250 | −23,96 | ||||
| 2025-07-24 | 13F | Acima Private Wealth, Llc | 100 | 0,00 | 5 | 66,67 | ||||
| 2025-08-05 | 13F | Bank of New York Mellon Corp | 292 676 | 1 063,49 | 15 597 | 1 461,16 | ||||
| 2025-08-11 | 13F | Bell Investment Advisors, Inc | 48 | −26,15 | 3 | 0,00 | ||||
| 2025-08-18 | 13F | Wolverine Trading, Llc | 0 | −100,00 | 0 | −100,00 | ||||
| 2025-08-14 | 13F | Blackstone Group Inc | 0 | −100,00 | 0 | |||||
| 2025-08-14 | 13F | Lazard Asset Management Llc | 22 787 | 1 | ||||||
| 2025-07-11 | 13F | Fruth Investment Management | 69 819 | −0,97 | 4 | 50,00 | ||||
| 2025-07-16 | 13F | American National Bank | 2 000 | 0,00 | 107 | 34,18 | ||||
| 2025-08-26 | NP | IWB - iShares Russell 1000 ETF | 146 806 | 7 823 | ||||||
| 2025-08-08 | 13F | Larson Financial Group LLC | 6 000 | 320 | ||||||
| 2025-08-08 | 13F | Geode Capital Management, Llc | 1 319 430 | 1 659,78 | 70 312 | 2 259,46 | ||||
| 2025-08-07 | 13F | Commerce Bank | 9 078 | 1,59 | 484 | 36,06 | ||||
| 2025-08-12 | 13F | Southeast Asset Advisors Inc. | 87 090 | 0,09 | 4 641 | 34,21 | ||||
| 2025-08-12 | 13F | Trexquant Investment LP | 81 245 | 4 330 | ||||||
| 2025-08-11 | 13F | Universal- Beteiligungs- und Servicegesellschaft mbH | 59 746 | 3 184 | ||||||
| 2025-08-14 | 13F | Anomaly Capital Management, LP | 0 | −100,00 | 0 | |||||
| 2025-04-15 | 13F | SJS Investment Consulting Inc. | 0 | −100,00 | 0 | −100,00 | ||||
| 2025-08-07 | 13F | Acadian Asset Management Llc | 111 812 | 762,88 | 6 | |||||
| 2025-07-31 | 13F | Fedenia Advisers LLC | 5 355 | 285 | ||||||
| 2025-08-14 | 13F | Balyasny Asset Management Llc | 838 905 | 7,59 | 44 705 | 44,24 | ||||
| 2025-07-31 | 13F | Orion Capital Management LLC | 2 005 | 0,00 | 107 | 34,18 | ||||
| 2025-08-14 | 13F | MIRAE ASSET GLOBAL ETFS HOLDINGS Ltd. | 995 | 53 | ||||||
| 2025-08-26 | NP | DSMDX - Driehaus Small/Mid Cap Growth Fund | 6 813 | 5,99 | 363 | 42,35 | ||||
| 2025-08-14 | 13F | Susquehanna International Group, Llp | Call | 131 900 | 1,38 | 7 029 | 35,91 | |||
| 2025-08-27 | NP | BBTSX - Bridge Builder Tax Managed Small/Mid Cap Fund | 121 234 | 0,00 | 6 461 | 34,05 | ||||
| 2025-08-14 | 13F | Susquehanna International Group, Llp | Put | 67 000 | 39,87 | 3 570 | 87,50 | |||
| 2025-08-05 | 13F | Huntington National Bank | 21 | 1 | ||||||
| 2025-05-29 | NP | PUTNAM VARIABLE TRUST - Putnam VT Multi-Cap Core Fund Class IA Shares | 15 473 | −2,32 | 615 | −11,76 | ||||
| 2025-08-12 | 13F | Manchester Capital Management LLC | 6 | 0 | ||||||
| 2025-06-23 | NP | IYY - iShares Dow Jones U.S. ETF | 3 862 | 1,90 | 158 | −17,28 | ||||
| 2025-05-15 | 13F | Maplelane Capital, Llc | Call | 0 | −100,00 | 0 | −100,00 | |||
| 2025-08-08 | 13F | Cetera Investment Advisers | 6 562 | −6,46 | 350 | 25,54 | ||||
| 2025-07-29 | 13F | Tradewinds Capital Management, LLC | 5 | 0 | ||||||
| 2025-08-14 | 13F | Bank Of America Corp /de/ | 1 404 278 | 27,36 | 74 834 | 70,73 | ||||
| 2025-05-05 | 13F | Del-Sette Capital Management, LLC | 0 | −100,00 | 0 | −100,00 | ||||
| 2025-04-29 | NP | Putnam ETF Trust - Putnam Sustainable Leaders ETF - | 137 633 | −35,79 | 6 620 | −33,51 | ||||
| 2025-08-12 | 13F | Magnetar Financial LLC | 6 454 | 344 | ||||||
| 2025-08-14 | 13F | GCM Grosvenor Holdings, LLC | 300 042 | −8,61 | 15 989 | 22,52 | ||||
| 2025-08-26 | NP | IWF - iShares Russell 1000 Growth ETF | 768 707 | 40 964 | ||||||
| 2025-08-14 | 13F | Soros Fund Management Llc | 0 | −100,00 | 0 | |||||
| 2025-08-19 | 13F | State of Wyoming | 1 | −99,98 | 0 | −100,00 | ||||
| 2025-08-11 | 13F | Qsemble Capital Management, LP | 61 090 | 136,57 | 3 255 | 217,25 | ||||
| 2025-08-12 | 13F | Ci Investments Inc. | 360 | −16,28 | 0 | |||||
| 2025-06-30 | NP | AIM INVESTMENT FUNDS (INVESCO INVESTMENT FUNDS) - Invesco Oppenheimer Global Allocation Fund Class R | 10 813 | 0,00 | 444 | −19,01 | ||||
| 2025-05-29 | NP | PUTNAM VARIABLE TRUST - Putnam VT High Yield Fund Class IA Shares | 11 800 | 0,00 | 469 | −9,63 | ||||
| 2025-07-31 | 13F | Acuitas Investments, LLC | 0 | −100,00 | 0 | |||||
| 2025-08-12 | 13F | Cumberland Partners Ltd | 37 500 | 1 998 | ||||||
| 2025-08-14 | 13F | Hudson Bay Capital Management LP | 0 | −100,00 | 0 | |||||
| 2025-05-15 | 13F | Integrated Wealth Concepts LLC | 0 | −100,00 | 0 | −100,00 | ||||
| 2025-07-14 | 13F | Hoey Investments, Inc | 100 | 5 | ||||||
| 2025-08-13 | 13F | Marshall Wace, Llp | 386 197 | 2 325,86 | 20 580 | 3 156,33 | ||||
| 2025-08-12 | 13F | Jpmorgan Chase & Co | 1 467 311 | 74,61 | 78 193 | 134,09 | ||||
| 2025-07-18 | 13F | Bartlett & Co. Wealth Management Llc | 200 | 0,00 | 11 | 42,86 | ||||
| 2025-08-14 | 13F | Interval Partners, LP | 453 319 | 24 157 | ||||||
| 2025-08-14 | 13F | J. Goldman & Co LP | 66 202 | 14,59 | 3 528 | 53,61 | ||||
| 2025-08-14 | 13F | CIBC Asset Management Inc | 9 452 | 0,00 | 504 | 34,13 | ||||
| 2025-07-29 | 13F | Wcm Investment Management, Llc | 121 049 | 0,04 | 6 382 | 34,05 | ||||
| 2025-06-26 | NP | USMIX - Extended Market Index Fund | 20 310 | 3,81 | 833 | −15,86 | ||||
| 2025-08-14 | 13F | Alliancebernstein L.p. | 1 307 779 | 0,76 | 69 692 | 35,09 | ||||
| 2025-08-14 | 13F | Adage Capital Partners Gp, L.l.c. | 228 000 | 12 150 | ||||||
| 2025-08-14 | 13F | Cubist Systematic Strategies, LLC | 55 460 | −78,68 | 2 955 | −71,42 | ||||
| 2025-08-14 | 13F | Ghisallo Capital Management LLC | 250 000 | 0,00 | 13 322 | 34,06 | ||||
| 2025-05-15 | 13F | Maplelane Capital, Llc | 0 | −100,00 | 0 | −100,00 | ||||
| 2025-08-26 | NP | TLSTX - Stock Index Fund | 2 538 | 135 | ||||||
| 2025-08-12 | 13F | Steward Partners Investment Advisory, Llc | 199 | 7,57 | 11 | 42,86 | ||||
| 2025-08-13 | 13F | Capital Research Global Investors | 32 238 381 | 14,45 | 1 717 967 | 53,44 | ||||
| 2025-05-13 | 13F | Arrowpoint Investment Partners (Singapore) Pte. Ltd. | Put | 0 | −100,00 | 0 | −100,00 | |||
| 2025-07-31 | 13F | Sumitomo Mitsui Trust Holdings, Inc. | 44 847 | 14,41 | 2 390 | 53,34 | ||||
| 2025-05-13 | 13F | Arrowpoint Investment Partners (Singapore) Pte. Ltd. | 0 | −100,00 | 0 | −100,00 | ||||
| 2025-05-15 | 13F | Alyeska Investment Group, L.P. | 0 | −100,00 | 0 | |||||
| 2025-08-04 | 13F | Pinnacle Associates Ltd | 3 850 | 205 | ||||||
| 2025-05-13 | 13F | Arrowpoint Investment Partners (Singapore) Pte. Ltd. | Call | 0 | −100,00 | 0 | −100,00 | |||
| 2025-08-14 | 13F | Freestone Grove Partners LP | 361 720 | −18,76 | 19 276 | 8,92 | ||||
| 2025-08-28 | NP | GFLW - VictoryShares Free Cash Flow Growth ETF | 116 303 | −11,01 | 6 198 | 19,29 |