Grundläggande statistik
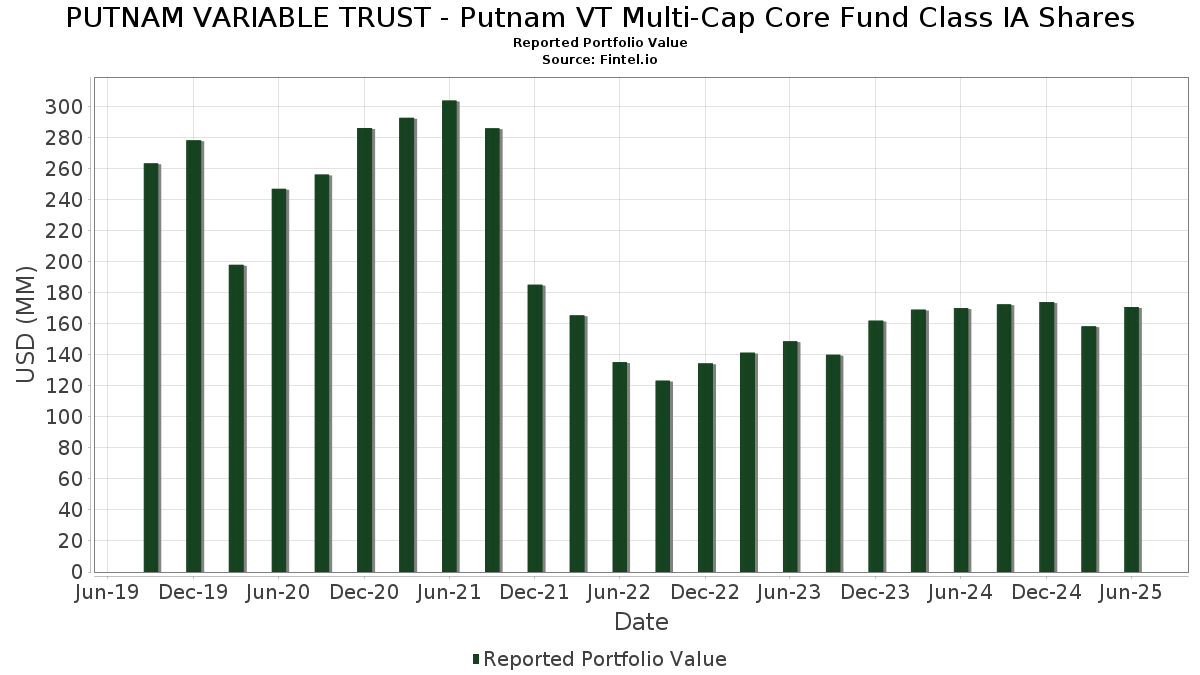
| Portföljvärde | $ 170 941 271 |
| Aktuella positioner | 137 |
Senaste innehav, resultat, förvaltat kapital (från 13F, 13D)
PUTNAM VARIABLE TRUST - Putnam VT Multi-Cap Core Fund Class IA Shares har redovisat 137 totala innehav i sina senaste SEC-arkiveringar. Det senaste portföljvärdet beräknas vara $ 170 941 271 USD. Faktiskt förvaltade tillgångar (AUM) är detta värde plus likvida medel (som inte redovisas). PUTNAM VARIABLE TRUST - Putnam VT Multi-Cap Core Fund Class IA Sharess största innehav är Microsoft Corporation (US:MSFT) , NVIDIA Corporation (US:NVDA) , Apple Inc. (US:AAPL) , Amazon.com, Inc. (US:AMZN) , and Meta Platforms, Inc. (US:META) . PUTNAM VARIABLE TRUST - Putnam VT Multi-Cap Core Fund Class IA Sharess nya positioner inkluderar Netflix, Inc. (US:NFLX) , Amcor plc (US:AMCR) , Jefferies Financial Group Inc. (US:JEF) , Humana Inc. (US:HUM) , and ADT Inc. (US:ADT) .
Största ökningarna detta kvartal
Vi använder förändringen i portföljallokeringen eftersom det är det mest meningsfulla måttet. Förändringar kan bero på transaktioner eller förändringar i aktiekurser.
| Värdepapper | Aktier (MM) |
Värde (MM$) |
Portfölj % av | ΔPortfölj % av |
|---|---|---|---|---|
| 3,80 | 3,80 | 2,2744 | 2,2744 | |
| 3,47 | 3,47 | 2,0798 | 1,6193 | |
| 0,07 | 10,80 | 6,4668 | 1,4660 | |
| 0,02 | 11,11 | 6,6544 | 1,1800 | |
| 0,01 | 3,76 | 2,2501 | 0,7603 | |
| 0,00 | 0,78 | 0,4668 | 0,4668 | |
| 0,01 | 2,62 | 1,5686 | 0,4019 | |
| 0,01 | 5,63 | 3,3736 | 0,3128 | |
| 0,01 | 2,12 | 1,2697 | 0,2902 | |
| 0,05 | 0,44 | 0,2641 | 0,2641 |
Största minskningarna detta kvartal
Vi använder förändringen i portföljallokeringen eftersom det är det mest meningsfulla måttet. Förändringar kan bero på transaktioner eller förändringar i aktiepriser.
| Värdepapper | Aktier (MM) |
Värde (MM$) |
Portfölj % av | ΔPortfölj % av |
|---|---|---|---|---|
| 0,04 | 8,50 | 5,0916 | −1,4182 | |
| 0,01 | 1,25 | 0,7514 | −0,5869 | |
| 0,00 | 1,30 | 0,7815 | −0,5815 | |
| 0,01 | 3,32 | 1,9861 | −0,5459 | |
| 0,02 | 2,09 | 1,2526 | −0,5305 | |
| 0,01 | 3,27 | 1,9614 | −0,3949 | |
| 0,01 | 2,06 | 1,2314 | −0,3422 | |
| 0,02 | 1,14 | 0,6836 | −0,3392 | |
| 0,02 | 1,91 | 1,1420 | −0,3169 | |
| 0,01 | 1,45 | 0,8673 | −0,3087 |
13F- och fond arkiveringar
Denna blankett lämnades in den 2025-08-26 för rapporteringsperioden 2025-06-30. Klicka på länksymbolen för att se hela transaktionshistoriken.
Uppgradera för att låsa upp premiumdata och exportera till Excel![]() .
.
| Värdepapper | Typ | Genomsnittligt aktiepris | Aktier (MM) |
ΔAktier (%) |
ΔAktier (%) |
Värde ($MM) |
Portfölj (%) |
ΔPortfölj (%) |
|
|---|---|---|---|---|---|---|---|---|---|
| MSFT / Microsoft Corporation | 0,02 | −2,27 | 11,11 | 29,50 | 6,6544 | 1,1800 | |||
| NVDA / NVIDIA Corporation | 0,07 | −5,50 | 10,80 | 37,75 | 6,4668 | 1,4660 | |||
| AAPL / Apple Inc. | 0,04 | −9,79 | 8,50 | −16,68 | 5,0916 | −1,4182 | |||
| AMZN / Amazon.com, Inc. | 0,03 | −9,82 | 6,34 | 3,99 | 3,7967 | −0,0928 | |||
| META / Meta Platforms, Inc. | 0,01 | −8,31 | 5,63 | 17,43 | 3,3736 | 0,3128 | |||
| GOOG / Alphabet Inc. | 0,03 | −13,74 | 5,44 | −2,07 | 3,2591 | −0,2858 | |||
| Putnam Cash Collateral Pool LLC / STIV (99311N9A5) | 3,80 | 3,80 | 2,2744 | 2,2744 | |||||
| AVGO / Broadcom Inc. | 0,01 | −2,27 | 3,76 | 60,90 | 2,2501 | 0,7603 | |||
| US74676P6640 / SHORT TERM INV FUND | 3,47 | 381,10 | 3,47 | 381,55 | 2,0798 | 1,6193 | |||
| BRK.B / Berkshire Hathaway Inc. | 0,01 | −8,39 | 3,32 | −16,43 | 1,9861 | −0,5459 | |||
| MA / Mastercard Incorporated | 0,01 | −13,51 | 3,27 | −11,35 | 1,9614 | −0,3949 | |||
| JPM / JPMorgan Chase & Co. | 0,01 | −2,27 | 2,75 | 15,50 | 1,6465 | 0,1280 | |||
| TSLA / Tesla, Inc. | 0,01 | 16,85 | 2,62 | 43,27 | 1,5686 | 0,4019 | |||
| GS / The Goldman Sachs Group, Inc. | 0,00 | −13,14 | 2,61 | 12,53 | 1,5603 | 0,0832 | |||
| BAC / Bank of America Corporation | 0,05 | −2,28 | 2,28 | 10,81 | 1,3633 | 0,0527 | |||
| AMP / Ameriprise Financial, Inc. | 0,00 | −13,98 | 2,22 | −5,18 | 1,3275 | −0,1637 | |||
| RJF / Raymond James Financial, Inc. | 0,01 | −2,27 | 2,14 | 7,87 | 1,2810 | 0,0163 | |||
| LLY / Eli Lilly and Company | 0,00 | −2,21 | 2,14 | −7,74 | 1,2792 | −0,1973 | |||
| ORCL / Oracle Corporation | 0,01 | −11,69 | 2,12 | 38,11 | 1,2697 | 0,2902 | |||
| C / Citigroup Inc. | 0,02 | −2,28 | 2,09 | 17,19 | 1,2537 | 0,1139 | |||
| WMT / Walmart Inc. | 0,02 | −32,81 | 2,09 | −25,16 | 1,2526 | −0,5305 | |||
| KO / The Coca-Cola Company | 0,03 | −2,28 | 2,08 | −3,43 | 1,2464 | −0,1290 | |||
| CBRE / CBRE Group, Inc. | 0,01 | −22,20 | 2,06 | −16,63 | 1,2314 | −0,3422 | |||
| APO / Apollo Global Management, Inc. | 0,01 | −16,05 | 2,06 | −13,03 | 1,2311 | −0,2768 | |||
| CSCO / Cisco Systems, Inc. | 0,03 | −2,28 | 1,94 | 9,86 | 1,1609 | 0,0353 | |||
| OTIS / Otis Worldwide Corporation | 0,02 | −13,09 | 1,91 | −16,62 | 1,1420 | −0,3169 | |||
| BK / The Bank of New York Mellon Corporation | 0,02 | −2,27 | 1,87 | 6,14 | 1,1181 | −0,0039 | |||
| XOM / Exxon Mobil Corporation | 0,02 | 1,00 | 1,69 | −8,44 | 1,0141 | −0,1660 | |||
| LRCX / Lam Research Corporation | 0,02 | −2,27 | 1,68 | 30,89 | 1,0050 | 0,1868 | |||
| UNP / Union Pacific Corporation | 0,01 | −2,27 | 1,66 | −4,82 | 0,9929 | −0,1183 | |||
| IGV / iShares Trust - iShares Expanded Tech-Software Sector ETF | 0,02 | −2,28 | 1,65 | 20,26 | 0,9887 | 0,1128 | |||
| NRG / NRG Energy, Inc. | 0,01 | −17,70 | 1,62 | 38,46 | 0,9705 | 0,2237 | |||
| LOW / Lowe's Companies, Inc. | 0,01 | −17,41 | 1,45 | −21,43 | 0,8673 | −0,3087 | |||
| ABBV / AbbVie Inc. | 0,01 | −2,27 | 1,42 | −13,39 | 0,8489 | −0,1955 | |||
| MCK / McKesson Corporation | 0,00 | −27,49 | 1,39 | −21,08 | 0,8347 | −0,2915 | |||
| T / AT&T Inc. | 0,05 | −2,28 | 1,37 | 0,00 | 0,8214 | −0,0536 | |||
| PCG / PG&E Corporation | 0,10 | −3,93 | 1,36 | −22,08 | 0,8120 | −0,2977 | |||
| PG / The Procter & Gamble Company | 0,01 | −2,27 | 1,35 | −8,64 | 0,8106 | −0,1345 | |||
| CRM / Salesforce, Inc. | 0,00 | −2,26 | 1,34 | −0,67 | 0,7997 | −0,0580 | |||
| JNJ / Johnson & Johnson | 0,01 | −9,75 | 1,31 | −16,87 | 0,7822 | −0,2202 | |||
| UNH / UnitedHealth Group Incorporated | 0,00 | 2,55 | 1,30 | −38,95 | 0,7815 | −0,5815 | |||
| XLI / The Select Sector SPDR Trust - The Industrial Select Sector SPDR Fund | 0,01 | −80,59 | 1,25 | −64,86 | 0,7514 | −0,5869 | |||
| LUV / Southwest Airlines Co. | 0,04 | −2,28 | 1,21 | −5,61 | 0,7256 | −0,0932 | |||
| GLPI / Gaming and Leisure Properties, Inc. | 0,02 | −22,36 | 1,14 | −28,82 | 0,6836 | −0,3392 | |||
| PHM / PulteGroup, Inc. | 0,01 | −20,52 | 1,10 | −18,47 | 0,6586 | −0,2019 | |||
| COP / ConocoPhillips | 0,01 | −5,50 | 1,10 | −19,26 | 0,6579 | −0,2101 | |||
| HLT / Hilton Worldwide Holdings Inc. | 0,00 | −2,25 | 1,10 | 14,39 | 0,6575 | 0,0453 | |||
| IBM / International Business Machines Corporation | 0,00 | −2,26 | 1,10 | 15,84 | 0,6573 | 0,0530 | |||
| DIS / The Walt Disney Company | 0,01 | 2,94 | 1,06 | 29,48 | 0,6366 | 0,1123 | |||
| BA / The Boeing Company | 0,00 | 24,62 | 1,04 | 53,25 | 0,6207 | 0,1888 | |||
| FCX / Freeport-McMoRan Inc. | 0,02 | −2,28 | 1,02 | 11,84 | 0,6113 | 0,0293 | |||
| QCOM / QUALCOMM Incorporated | 0,01 | −2,27 | 1,01 | 1,31 | 0,6045 | −0,0310 | |||
| MCD / McDonald's Corporation | 0,00 | −2,25 | 0,97 | −8,53 | 0,5780 | −0,0954 | |||
| HON / Honeywell International Inc. | 0,00 | −2,24 | 0,95 | 7,50 | 0,5668 | 0,0052 | |||
| MRK / Merck & Co., Inc. | 0,01 | −2,27 | 0,93 | −13,88 | 0,5581 | −0,1317 | |||
| URI / United Rentals, Inc. | 0,00 | 5,04 | 0,90 | 26,23 | 0,5365 | 0,0839 | |||
| ACGL / Arch Capital Group Ltd. | 0,01 | 2,12 | 0,83 | −3,36 | 0,4999 | −0,0510 | |||
| GDDY / GoDaddy Inc. | 0,00 | −2,25 | 0,83 | −2,24 | 0,4960 | −0,0448 | |||
| UMG / Universal Music Group N.V. | 0,03 | −2,27 | 0,82 | 14,83 | 0,4919 | 0,0355 | |||
| Viking Holdings Ltd. / EC (BMG93A5A1010) | 0,02 | −2,27 | 0,81 | 30,89 | 0,4826 | 0,0902 | |||
| THC / Tenet Healthcare Corporation | 0,00 | −2,25 | 0,79 | 27,86 | 0,4760 | 0,0796 | |||
| IT / Gartner, Inc. | 0,00 | −5,68 | 0,79 | −9,17 | 0,4747 | −0,0820 | |||
| NFLX / Netflix, Inc. | 0,00 | 0,78 | 0,4668 | 0,4668 | |||||
| NUE / Nucor Corporation | 0,01 | −2,27 | 0,75 | 5,20 | 0,4482 | −0,0056 | |||
| UMBF / UMB Financial Corporation | 0,01 | 11,83 | 0,73 | 16,22 | 0,4383 | 0,0369 | |||
| KR / The Kroger Co. | 0,01 | −30,44 | 0,71 | −26,28 | 0,4235 | −0,1886 | |||
| NEE / NextEra Energy, Inc. | 0,01 | 2,81 | 0,69 | 0,58 | 0,4150 | −0,0241 | |||
| ADBE / Adobe Inc. | 0,00 | 9,97 | 0,67 | 10,87 | 0,4036 | 0,0160 | |||
| US21871X1090 / Corebridge Financial, Inc. | 0,02 | −4,68 | 0,66 | 7,13 | 0,3961 | 0,0024 | |||
| RTX / RTX Corporation | 0,00 | −2,25 | 0,65 | 7,82 | 0,3883 | 0,0044 | |||
| HD / The Home Depot, Inc. | 0,00 | −2,22 | 0,63 | −2,18 | 0,3770 | −0,0336 | |||
| TAP / Molson Coors Beverage Company | 0,01 | −2,28 | 0,63 | −22,84 | 0,3748 | −0,1423 | |||
| CEG / Constellation Energy Corporation | 0,00 | −25,22 | 0,62 | 19,92 | 0,3713 | 0,0409 | |||
| REGN / Regeneron Pharmaceuticals, Inc. | 0,00 | −2,16 | 0,62 | −19,05 | 0,3694 | −0,1165 | |||
| BLK / BlackRock, Inc. | 0,00 | 13,76 | 0,62 | 26,02 | 0,3689 | 0,0573 | |||
| AR / Antero Resources Corporation | 0,01 | −2,46 | 0,60 | −2,78 | 0,3564 | −0,0344 | |||
| NOC / Northrop Grumman Corporation | 0,00 | −2,18 | 0,58 | −4,59 | 0,3491 | −0,0402 | |||
| TGT / Target Corporation | 0,01 | −24,37 | 0,57 | −28,61 | 0,3413 | −0,1672 | |||
| EA / Electronic Arts Inc. | 0,00 | −2,25 | 0,55 | 7,99 | 0,3324 | 0,0046 | |||
| CVS / CVS Health Corporation | 0,01 | −6,29 | 0,55 | −4,55 | 0,3268 | −0,0381 | |||
| DE / Deere & Company | 0,00 | −2,19 | 0,54 | 6,04 | 0,3258 | −0,0017 | |||
| MDT / Medtronic plc | 0,01 | −2,27 | 0,54 | −5,09 | 0,3241 | −0,0401 | |||
| AMGN / Amgen Inc. | 0,00 | −2,19 | 0,52 | −12,40 | 0,3135 | −0,0675 | |||
| AGO / Assured Guaranty Ltd. | 0,01 | −2,27 | 0,50 | −3,32 | 0,2965 | −0,0304 | |||
| KVUE / Kenvue Inc. | 0,02 | −20,17 | 0,49 | −30,34 | 0,2929 | −0,1550 | |||
| EBAY / eBay Inc. | 0,01 | −2,26 | 0,49 | 7,54 | 0,2908 | 0,0025 | |||
| EMN / Eastman Chemical Company | 0,01 | −31,17 | 0,48 | −41,69 | 0,2902 | −0,2398 | |||
| BBY / Best Buy Co., Inc. | 0,01 | −2,26 | 0,48 | −10,87 | 0,2899 | −0,0566 | |||
| TMO / Thermo Fisher Scientific Inc. | 0,00 | 19,46 | 0,47 | −2,71 | 0,2802 | −0,0264 | |||
| STWD / Starwood Property Trust, Inc. | 0,02 | −2,28 | 0,46 | −0,86 | 0,2766 | −0,0204 | |||
| MS / Morgan Stanley | 0,00 | 21,63 | 0,45 | 76,28 | 0,2675 | 0,1159 | |||
| GM / General Motors Company | 0,01 | −2,27 | 0,44 | 2,32 | 0,2644 | −0,0110 | |||
| AMCR / Amcor plc | 0,05 | 0,44 | 0,2641 | 0,2641 | |||||
| FDX / FedEx Corporation | 0,00 | −2,27 | 0,43 | −8,88 | 0,2584 | −0,0437 | |||
| KKR / KKR & Co. Inc. | 0,00 | −71,39 | 0,43 | −11,55 | 0,2574 | −0,1437 | |||
| PR / Permian Resources Corporation | 0,03 | 11,44 | 0,43 | 9,46 | 0,2568 | 0,0072 | |||
| CASY / Casey's General Stores, Inc. | 0,00 | −2,15 | 0,42 | 14,88 | 0,2503 | 0,0185 | |||
| FITB / Fifth Third Bancorp | 0,01 | 4,76 | 0,41 | 9,81 | 0,2484 | 0,0077 | |||
| DD / DuPont de Nemours, Inc. | 0,01 | 52,68 | 0,41 | 40,00 | 0,2479 | 0,0596 | |||
| CMCSA / Comcast Corporation | 0,01 | 24,35 | 0,41 | 20,41 | 0,2474 | 0,0283 | |||
| HCA / HCA Healthcare, Inc. | 0,00 | −2,14 | 0,39 | 8,73 | 0,2313 | 0,0042 | |||
| AZN / AstraZeneca PLC - Depositary Receipt (Common Stock) | 0,01 | −2,26 | 0,38 | −7,09 | 0,2279 | −0,0334 | |||
| NYT / The New York Times Company | 0,01 | −2,26 | 0,37 | 10,54 | 0,2199 | 0,0075 | |||
| CTAS / Cintas Corporation | 0,00 | −2,20 | 0,36 | 5,95 | 0,2136 | −0,0010 | |||
| TPG / TPG Inc. | 0,01 | −2,26 | 0,36 | 8,21 | 0,2133 | 0,0031 | |||
| AHH / Armada Hoffler Properties, Inc. | 0,05 | −2,28 | 0,35 | −10,61 | 0,2123 | −0,0407 | |||
| HIW / Highwoods Properties, Inc. | 0,01 | 33,71 | 0,35 | 40,24 | 0,2070 | 0,0498 | |||
| GRDN / Guardian Pharmacy Services, Inc. | 0,02 | 26,00 | 0,34 | 26,49 | 0,2031 | 0,0318 | |||
| LKQ / LKQ Corporation | 0,01 | −20,90 | 0,32 | −31,20 | 0,1932 | −0,1059 | |||
| INTC / Intel Corporation | 0,01 | −2,27 | 0,32 | −3,61 | 0,1922 | −0,0202 | |||
| JEF / Jefferies Financial Group Inc. | 0,01 | 0,30 | 0,1798 | 0,1798 | |||||
| BIO / Bio-Rad Laboratories, Inc. | 0,00 | −2,23 | 0,29 | −3,06 | 0,1710 | −0,0170 | |||
| MTN / Vail Resorts, Inc. | 0,00 | 0,00 | 0,28 | −1,73 | 0,1705 | −0,0145 | |||
| LULU / lululemon athletica inc. | 0,00 | 49,41 | 0,27 | 25,46 | 0,1626 | 0,0245 | |||
| HUM / Humana Inc. | 0,00 | 0,27 | 0,1621 | 0,1621 | |||||
| CSGP / CoStar Group, Inc. | 0,00 | −1,03 | 0,26 | 0,77 | 0,1569 | −0,0095 | |||
| CHTR / Charter Communications, Inc. | 0,00 | −2,15 | 0,26 | 8,79 | 0,1557 | 0,0029 | |||
| FSBC / Five Star Bancorp | 0,01 | −2,27 | 0,24 | 0,41 | 0,1453 | −0,0090 | |||
| FICO / Fair Isaac Corporation | 0,00 | −1,54 | 0,23 | −2,51 | 0,1401 | −0,0128 | |||
| RPRX / Royalty Pharma plc | 0,01 | −2,28 | 0,23 | 13,24 | 0,1387 | 0,0081 | |||
| HSY / The Hershey Company | 0,00 | −2,21 | 0,23 | −5,00 | 0,1366 | −0,0168 | |||
| SNA / Snap-on Incorporated | 0,00 | −2,18 | 0,22 | −9,72 | 0,1338 | −0,0240 | |||
| GHC / Graham Holdings Company | 0,00 | −1,74 | 0,21 | −3,18 | 0,1281 | −0,0129 | |||
| ARDT / Ardent Health, Inc. | 0,02 | −30,34 | 0,21 | −30,90 | 0,1248 | −0,0673 | |||
| AIG / American International Group, Inc. | 0,00 | 0,20 | 0,1213 | 0,1213 | |||||
| U.S. Treasury Bills / STIV (US912797QS94) | 0,20 | 0,1176 | 0,1176 | ||||||
| PINS / Pinterest, Inc. | 0,00 | −31,58 | 0,17 | −15,08 | 0,1013 | −0,0161 | |||
| ELV / Elevance Health, Inc. | 0,00 | −52,32 | 0,17 | −57,51 | 0,1004 | −0,1505 | |||
| ADT / ADT Inc. | 0,02 | 0,17 | 0,1000 | 0,1000 | |||||
| FWRG / First Watch Restaurant Group, Inc. | 0,01 | −7,77 | 0,14 | −10,90 | 0,0833 | −0,0166 | |||
| VYX / NCR Voyix Corporation | 0,01 | −2,26 | 0,09 | 18,06 | 0,0509 | 0,0048 | |||
| NYXH / Nyxoah SA | 0,01 | −2,28 | 0,07 | 5,88 | 0,0432 | −0,0007 | |||
| FND / Floor & Decor Holdings, Inc. | 0,00 | −2,20 | 0,07 | −8,22 | 0,0404 | −0,0062 | |||
| CAI / Caris Life Sciences, Inc. | 0,00 | 0,03 | 0,0197 | 0,0197 | |||||
| S&P 500 E-Mini Index / DE (N/A) | 0,01 | 0,0056 | 0,0056 | ||||||
| Russell 2000 E-Mini Index / DE (N/A) | 0,00 | 0,0008 | 0,0008 | ||||||
| KRMN / Karman Holdings Inc. | 0,00 | −100,00 | 0,00 | −100,00 | −0,0304 | ||||
| Vail Resorts, Inc. / DE (N/A) | −0,00 | −0,0005 | −0,0005 |