Grundläggande statistik
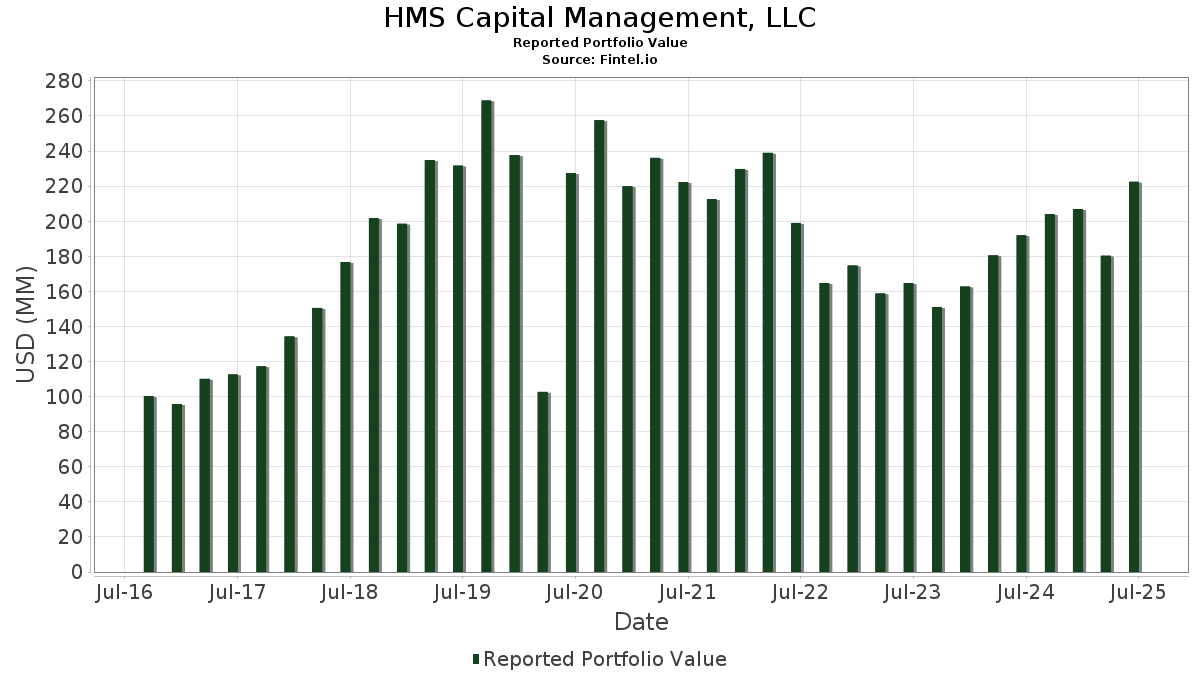
| Portföljvärde | $ 222 464 182 |
| Aktuella positioner | 106 |
Senaste innehav, resultat, förvaltat kapital (från 13F, 13D)
HMS Capital Management, LLC har redovisat 106 totala innehav i sina senaste SEC-arkiveringar. Det senaste portföljvärdet beräknas vara $ 222 464 182 USD. Faktiskt förvaltade tillgångar (AUM) är detta värde plus likvida medel (som inte redovisas). HMS Capital Management, LLCs största innehav är SPDR S&P 500 ETF (US:SPY) , iShares Trust - iShares MSCI EAFE ETF (US:EFA) , iShares Trust - iShares iBoxx $ Investment Grade Corporate Bond ETF (US:LQD) , Invesco QQQ Trust, Series 1 (US:QQQ) , and Global X Funds - Global X Artificial Intelligence & Technology ETF (US:AIQ) . HMS Capital Management, LLCs nya positioner inkluderar American Healthcare REIT, Inc. (US:AHR) , Sprouts Farmers Market, Inc. (US:SFM) , Howmet Aerospace Inc. (US:HWM) , Viking Holdings Ltd (US:VIK) , and .
Största ökningarna detta kvartal
Vi använder förändringen i portföljallokeringen eftersom det är det mest meningsfulla måttet. Förändringar kan bero på transaktioner eller förändringar i aktiekurser.
| Värdepapper | Aktier (MM) |
Värde (MM$) |
Portfölj % av | ΔPortfölj % av |
|---|---|---|---|---|
| 0,17 | 15,30 | 6,8775 | 6,8775 | |
| 0,05 | 8,38 | 3,7659 | 0,8381 | |
| 0,06 | 4,82 | 2,1647 | 0,7042 | |
| 0,02 | 4,48 | 2,0119 | 0,6281 | |
| 0,19 | 8,51 | 3,8241 | 0,6162 | |
| 0,02 | 2,38 | 1,0676 | 0,3410 | |
| 0,01 | 4,54 | 2,0397 | 0,3237 | |
| 0,00 | 3,82 | 1,7162 | 0,3112 | |
| 0,05 | 0,62 | 0,2808 | 0,2808 | |
| 0,02 | 11,55 | 5,1897 | 0,1966 |
Största minskningarna detta kvartal
Vi använder förändringen i portföljallokeringen eftersom det är det mest meningsfulla måttet. Förändringar kan bero på transaktioner eller förändringar i aktiepriser.
| Värdepapper | Aktier (MM) |
Värde (MM$) |
Portfölj % av | ΔPortfölj % av |
|---|---|---|---|---|
| 0,01 | 1,04 | 0,4654 | −3,1197 | |
| 0,13 | 14,36 | 6,4561 | −1,4210 | |
| 0,01 | 2,09 | 0,9406 | −1,2409 | |
| 0,03 | 4,40 | 1,9797 | −0,5189 | |
| 0,06 | 34,10 | 15,3261 | −0,3923 | |
| 0,02 | 1,07 | 0,4821 | −0,3384 | |
| 0,04 | 3,63 | 1,6312 | −0,3176 | |
| 0,04 | 3,03 | 1,3620 | −0,3037 | |
| 0,01 | 1,92 | 0,8627 | −0,2356 | |
| 0,00 | 3,13 | 1,4087 | −0,2264 |
13F- och fond arkiveringar
Denna blankett lämnades in den 2025-07-07 för rapporteringsperioden 2025-06-30. Klicka på länksymbolen för att se hela transaktionshistoriken.
Uppgradera för att låsa upp premiumdata och exportera till Excel![]() .
.
| Värdepapper | Typ | Genomsnittligt aktiepris | Aktier (MM) |
ΔAktier (%) |
ΔAktier (%) |
Värde ($MM) |
Portfölj (%) |
ΔPortfölj (%) |
|
|---|---|---|---|---|---|---|---|---|---|
| SPY / SPDR S&P 500 ETF | 0,06 | −1,79 | 34,10 | 20,31 | 15,3261 | −0,3923 | |||
| EFA / iShares Trust - iShares MSCI EAFE ETF | 0,17 | 15,30 | 6,8775 | 6,8775 | |||||
| LQD / iShares Trust - iShares iBoxx $ Investment Grade Corporate Bond ETF | 0,13 | −1,60 | 14,36 | 1,13 | 6,4561 | −1,4210 | |||
| QQQ / Invesco QQQ Trust, Series 1 | 0,02 | −1,50 | 11,55 | 28,25 | 5,1897 | 0,1966 | |||
| AIQ / Global X Funds - Global X Artificial Intelligence & Technology ETF | 0,19 | 8,30 | 8,51 | 47,10 | 3,8241 | 0,6162 | |||
| NVDA / NVIDIA Corporation | 0,05 | −1,92 | 8,38 | 58,72 | 3,7659 | 0,8381 | |||
| MSFT / Microsoft Corporation | 0,01 | −6,33 | 6,11 | 30,19 | 2,7450 | 0,1435 | |||
| CWB / SPDR Series Trust - SPDR Bloomberg Convertible Securities ETF | 0,06 | 60,19 | 4,82 | 82,87 | 2,1647 | 0,7042 | |||
| GSCE / GS Connect S&P GSCI Enhanced Commodity Total Return ETN | 0,01 | −3,55 | 4,54 | 46,64 | 2,0397 | 0,3237 | |||
| AVGO / Broadcom Inc. | 0,02 | 0,32 | 4,48 | 79,43 | 2,0119 | 0,6281 | |||
| IWP / iShares Trust - iShares Russell Mid-Cap Growth ETF | 0,03 | −25,21 | 4,40 | −2,24 | 1,9797 | −0,5189 | |||
| NFLX / Netflix, Inc. | 0,00 | −2,33 | 3,82 | 50,69 | 1,7162 | 0,3112 | |||
| XLE / The Select Sector SPDR Trust - The Energy Select Sector SPDR Fund | 0,04 | −4,71 | 3,63 | 3,27 | 1,6312 | −0,3176 | |||
| AMZN / Amazon.com, Inc. | 0,01 | −2,24 | 3,27 | 22,36 | 1,4716 | −0,0121 | |||
| AAPL / Apple Inc. | 0,02 | −1,81 | 3,26 | 11,03 | 1,4664 | −0,1634 | |||
| META / Meta Platforms, Inc. | 0,00 | −0,96 | 3,20 | 41,58 | 1,4406 | 0,1855 | |||
| JPM / JPMorgan Chase & Co. | 0,01 | −3,43 | 3,19 | 30,57 | 1,4323 | 0,0787 | |||
| MCK / McKesson Corporation | 0,00 | −3,97 | 3,13 | 6,28 | 1,4087 | −0,2264 | |||
| FTNT / Fortinet, Inc. | 0,03 | −0,32 | 3,07 | 19,76 | 1,3815 | −0,0418 | |||
| HYG / iShares Trust - iShares iBoxx $ High Yield Corporate Bond ETF | 0,04 | −4,81 | 3,03 | 0,90 | 1,3620 | −0,3037 | |||
| BKNG / Booking Holdings Inc. | 0,00 | −1,02 | 2,80 | 35,07 | 1,2588 | 0,1085 | |||
| CMG / Chipotle Mexican Grill, Inc. | 0,05 | −3,61 | 2,77 | 15,97 | 1,2437 | −0,0795 | |||
| GOOGL / Alphabet Inc. | 0,01 | −0,63 | 2,50 | 19,31 | 1,1249 | −0,0382 | |||
| MU / Micron Technology, Inc. | 0,02 | 0,56 | 2,38 | 81,30 | 1,0676 | 0,3410 | |||
| HCA / HCA Healthcare, Inc. | 0,01 | −5,73 | 2,16 | 9,60 | 0,9697 | −0,1222 | |||
| WMT / Walmart Inc. | 0,02 | −1,88 | 2,11 | 14,50 | 0,9476 | −0,0739 | |||
| BAC / Bank of America Corporation | 0,04 | −6,24 | 2,10 | 24,75 | 0,9428 | 0,0100 | |||
| IWD / iShares Trust - iShares Russell 1000 Value ETF | 0,01 | −53,66 | 2,09 | −46,81 | 0,9406 | −1,2409 | |||
| PH / Parker-Hannifin Corporation | 0,00 | −1,45 | 2,09 | 29,50 | 0,9375 | 0,0441 | |||
| WM / Waste Management, Inc. | 0,01 | −6,58 | 1,92 | −3,08 | 0,8627 | −0,2356 | |||
| MA / Mastercard Incorporated | 0,00 | −2,60 | 1,87 | 12,70 | 0,8418 | −0,0797 | |||
| IWF / iShares Trust - iShares Russell 1000 Growth ETF | 0,00 | 0,00 | 1,86 | 30,18 | 0,8342 | 0,0438 | |||
| MSI / Motorola Solutions, Inc. | 0,00 | −3,17 | 1,80 | 0,95 | 0,8094 | −0,1795 | |||
| SYK / Stryker Corporation | 0,00 | −3,10 | 1,68 | 11,01 | 0,7572 | −0,0845 | |||
| VOO / Vanguard Index Funds - Vanguard S&P 500 ETF | 0,00 | −8,96 | 1,62 | 11,56 | 0,7287 | −0,0773 | |||
| PG / The Procter & Gamble Company | 0,01 | −4,46 | 1,57 | −5,02 | 0,7055 | −0,2109 | |||
| ACN / Accenture plc | 0,00 | −1,76 | 1,47 | 3,09 | 0,6603 | −0,1296 | |||
| QCOM / QUALCOMM Incorporated | 0,01 | −3,90 | 1,41 | 17,99 | 0,6338 | −0,0290 | |||
| AJG / Arthur J. Gallagher & Co. | 0,00 | −3,26 | 1,40 | −0,36 | 0,6281 | −0,1499 | |||
| CDNS / Cadence Design Systems, Inc. | 0,00 | −4,13 | 1,39 | 26,32 | 0,6236 | 0,0146 | |||
| LLY / Eli Lilly and Company | 0,00 | −6,64 | 1,26 | 0,48 | 0,5668 | −0,1288 | |||
| KO / The Coca-Cola Company | 0,02 | −7,01 | 1,23 | −3,76 | 0,5530 | −0,1560 | |||
| AMD / Advanced Micro Devices, Inc. | 0,01 | −5,29 | 1,18 | 60,76 | 0,5306 | 0,1232 | |||
| MCD / McDonald's Corporation | 0,00 | −10,00 | 1,17 | −12,32 | 0,5249 | −0,2136 | |||
| CPRT / Copart, Inc. | 0,02 | −19,90 | 1,07 | −27,52 | 0,4821 | −0,3384 | |||
| XHB / SPDR Series Trust - SPDR S&P Homebuilders ETF | 0,01 | −85,38 | 1,04 | −83,99 | 0,4654 | −3,1197 | |||
| MUB / iShares Trust - iShares National Muni Bond ETF | 0,01 | 5,48 | 1,03 | 6,08 | 0,4634 | −0,0752 | |||
| URI / United Rentals, Inc. | 0,00 | −8,37 | 1,01 | 23,06 | 0,4560 | −0,0012 | |||
| SJM / The J. M. Smucker Company | 0,01 | −5,07 | 0,94 | −17,51 | 0,4236 | −0,2101 | |||
| IVW / iShares Trust - iShares S&P 500 Growth ETF | 0,01 | −5,26 | 0,79 | 24,10 | 0,3568 | 0,0021 | |||
| STRL / Sterling Infrastructure, Inc. | 0,00 | −32,90 | 0,78 | 41,89 | 0,3506 | 0,0458 | |||
| CW / Curtiss-Wright Corporation | 0,00 | −1,12 | 0,78 | 67,82 | 0,3497 | 0,0925 | |||
| MPWR / Monolithic Power Systems, Inc. | 0,00 | 0,00 | 0,74 | 49,70 | 0,3346 | 0,0588 | |||
| J / Jacobs Solutions Inc. | 0,01 | −4,37 | 0,74 | 13,11 | 0,3340 | −0,0301 | |||
| FIX / Comfort Systems USA, Inc. | 0,00 | −30,79 | 0,73 | 18,85 | 0,3262 | −0,0123 | |||
| COOP / Mr. Cooper Group Inc. | 0,00 | −1,49 | 0,72 | 13,95 | 0,3233 | −0,0270 | |||
| CB / Chubb Limited | 0,00 | −6,05 | 0,69 | −0,72 | 0,3097 | −0,0754 | |||
| AGI / Alamos Gold Inc. | 0,03 | −0,85 | 0,67 | 7,32 | 0,3032 | −0,0453 | |||
| IVV / iShares Trust - iShares Core S&P 500 ETF | 0,00 | −0,75 | 0,66 | 21,75 | 0,2947 | −0,0041 | |||
| CSW / CSW Industrials, Inc. | 0,00 | −7,14 | 0,65 | 0,94 | 0,2900 | −0,0648 | |||
| STLD / Steel Dynamics, Inc. | 0,00 | −6,52 | 0,63 | 7,68 | 0,2840 | −0,0411 | |||
| SPY / SPDR S&P 500 ETF | Put | 0,05 | 0,62 | 0,2808 | 0,2808 | ||||
| CLS / Celestica Inc. | 0,00 | −1,95 | 0,61 | 117,79 | 0,2751 | 0,1190 | |||
| NOW / ServiceNow, Inc. | 0,00 | −15,65 | 0,61 | 17,79 | 0,2740 | −0,0127 | |||
| USFD / US Foods Holding Corp. | 0,01 | −1,73 | 0,60 | 25,10 | 0,2713 | 0,0038 | |||
| SN / SharkNinja, Inc. | 0,01 | −0,95 | 0,60 | 39,53 | 0,2699 | 0,0313 | |||
| ROAD / Construction Partners, Inc. | 0,01 | −1,55 | 0,60 | 49,87 | 0,2676 | 0,0474 | |||
| SKWD / Skyward Specialty Insurance Group, Inc. | 0,01 | −1,41 | 0,60 | 18,76 | 0,2676 | −0,0104 | |||
| AA / Alcoa Corporation | 0,02 | −3,35 | 0,59 | 16,04 | 0,2636 | −0,0168 | |||
| PNFP / Pinnacle Financial Partners, Inc. | 0,01 | 0,00 | 0,58 | 26,09 | 0,2611 | 0,0059 | |||
| NVMI / Nova Ltd. | 0,00 | 0,00 | 0,55 | 61,36 | 0,2463 | 0,0579 | |||
| CRS / Carpenter Technology Corporation | 0,00 | −2,99 | 0,52 | 75,08 | 0,2338 | 0,0690 | |||
| TXRH / Texas Roadhouse, Inc. | 0,00 | −1,36 | 0,52 | 19,17 | 0,2324 | −0,0079 | |||
| CBZ / CBIZ, Inc. | 0,01 | −1,10 | 0,50 | −0,20 | 0,2256 | −0,0530 | |||
| IJK / iShares Trust - iShares S&P Mid-Cap 400 Growth ETF | 0,01 | −34,52 | 0,48 | −20,89 | 0,2165 | −0,1207 | |||
| CLH / Clean Harbors, Inc. | 0,00 | −1,30 | 0,47 | 22,60 | 0,2124 | −0,0016 | |||
| MTSI / MACOM Technology Solutions Holdings, Inc. | 0,00 | −1,33 | 0,46 | 57,24 | 0,2052 | 0,0444 | |||
| FOUR / Shift4 Payments, Inc. | 0,00 | −0,66 | 0,45 | 31,76 | 0,2017 | 0,0128 | |||
| FTI / TechnipFMC plc | 0,01 | −3,24 | 0,43 | 38,02 | 0,1946 | 0,0204 | |||
| AHR / American Healthcare REIT, Inc. | 0,01 | 0,43 | 0,1934 | 0,1934 | |||||
| TBBK / The Bancorp, Inc. | 0,01 | −3,16 | 0,43 | 34,80 | 0,1934 | 0,0164 | |||
| SFM / Sprouts Farmers Market, Inc. | 0,00 | 0,43 | 0,1922 | 0,1922 | |||||
| VRTX / Vertex Pharmaceuticals Incorporated | 0,00 | −11,40 | 0,42 | −16,77 | 0,1897 | −0,0919 | |||
| NVT / nVent Electric plc | 0,01 | −1,23 | 0,42 | 56,51 | 0,1897 | 0,0401 | |||
| NFG / National Fuel Gas Company | 0,00 | −2,63 | 0,42 | 12,60 | 0,1890 | −0,0181 | |||
| IWR / iShares Trust - iShares Russell Mid-Cap ETF | 0,00 | 0,00 | 0,40 | 20,60 | 0,1816 | −0,0044 | |||
| WAY / Waystar Holding Corp. | 0,01 | 0,84 | 0,40 | 15,45 | 0,1781 | −0,0126 | |||
| ONON / On Holding AG | 0,01 | 26,65 | 0,37 | 60,52 | 0,1686 | 0,0393 | |||
| UTHR / United Therapeutics Corporation | 0,00 | −3,19 | 0,37 | −4,44 | 0,1646 | −0,0484 | |||
| APPF / AppFolio, Inc. | 0,00 | −3,27 | 0,35 | 3,81 | 0,1592 | −0,0302 | |||
| EXLS / ExlService Holdings, Inc. | 0,01 | −2,30 | 0,35 | 1,15 | 0,1590 | −0,0346 | |||
| XLK / The Select Sector SPDR Trust - The Technology Select Sector SPDR Fund | 0,00 | −21,32 | 0,35 | 8,72 | 0,1571 | −0,0214 | |||
| VGRSX / Vanguard REIT Index Fund | 0,00 | −56,32 | 0,33 | −49,08 | 0,1493 | −0,2127 | |||
| AROC / Archrock, Inc. | 0,01 | −1,54 | 0,33 | 13,36 | 0,1490 | −0,0131 | |||
| ANET / Arista Networks Inc | 0,00 | −1,63 | 0,32 | 47,93 | 0,1445 | 0,0237 | |||
| HWM / Howmet Aerospace Inc. | 0,00 | 0,31 | 0,1415 | 0,1415 | |||||
| MMYT / MakeMyTrip Limited | 0,00 | −1,20 | 0,31 | 6,44 | 0,1412 | −0,0226 | |||
| XOM / Exxon Mobil Corporation | 0,00 | −29,15 | 0,31 | −25,90 | 0,1392 | −0,0923 | |||
| VTI / Vanguard Index Funds - Vanguard Total Stock Market ETF | 0,00 | −39,52 | 0,29 | −25,89 | 0,1317 | −0,0872 | |||
| V / Visa Inc. | 0,00 | 0,00 | 0,28 | 13,41 | 0,1258 | −0,0107 | |||
| GPC / Genuine Parts Company | 0,00 | 0,00 | 0,27 | 9,92 | 0,1200 | −0,0147 | |||
| VIK / Viking Holdings Ltd | 0,00 | 0,26 | 0,1156 | 0,1156 | |||||
| MMC / Marsh & McLennan Companies, Inc. | 0,00 | 0,00 | 0,23 | −2,15 | 0,1025 | −0,0269 | |||
| COST / Costco Wholesale Corporation | 0,00 | −18,12 | 0,22 | −10,80 | 0,1006 | −0,0384 | |||
| CRM / Salesforce, Inc. | 0,00 | 0,22 | 0,0973 | 0,0973 | |||||
| LIN / Linde plc | 0,00 | −20,43 | 0,21 | −12,13 | 0,0945 | −0,0385 | |||
| SAIA / Saia, Inc. | 0,00 | −100,00 | 0,00 | 0,0000 | |||||
| UNH / UnitedHealth Group Incorporated | 0,00 | −100,00 | 0,00 | 0,0000 | |||||
| IVE / iShares Trust - iShares S&P 500 Value ETF | 0,00 | −100,00 | 0,00 | 0,0000 | |||||
| SNPS / Synopsys, Inc. | 0,00 | −100,00 | 0,00 | 0,0000 | |||||
| AFL / Aflac Incorporated | 0,00 | −100,00 | 0,00 | 0,0000 |