Grundläggande statistik
| Institutionella ägare | 284 total, 284 long only, 0 short only, 0 long/short - change of 6,34% MRQ |
| Genomsnittlig portföljallokering | 0.4056 % - change of −10,63% MRQ |
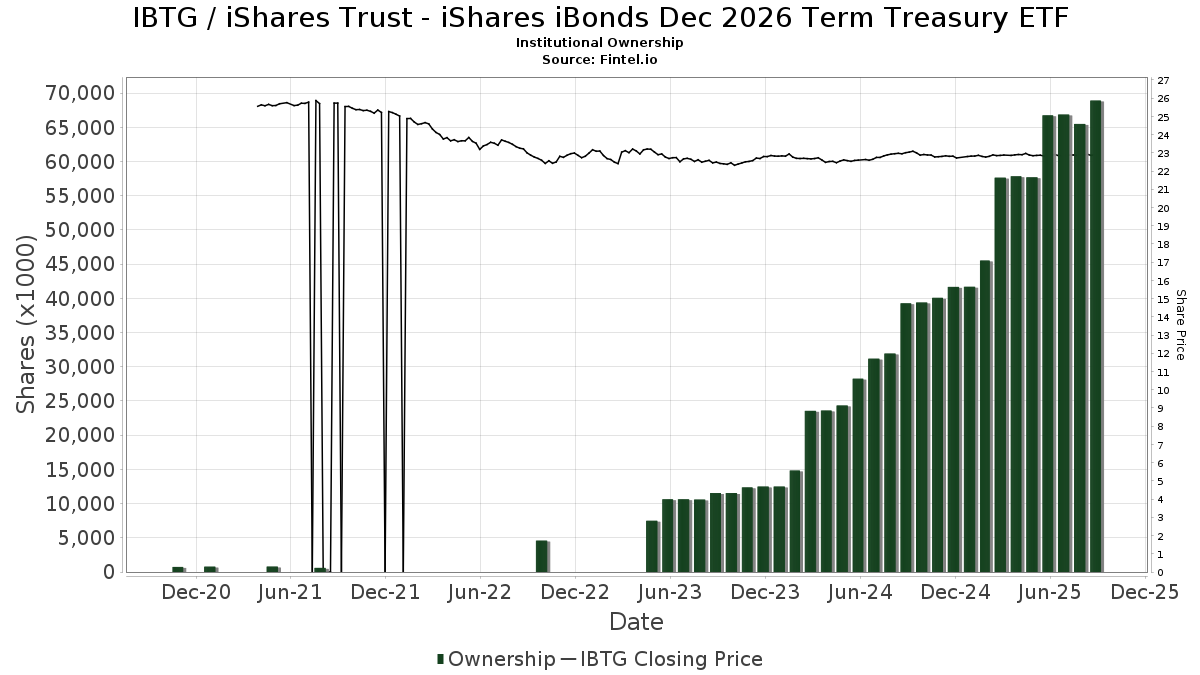
| Institutionella aktier (lång) | 68 907 019 (ex 13D/G) - change of 2,16MM shares 3,23% MRQ |
| Institutionellt värde (lång) | $ 1 528 402 USD ($1000) |
Institutionellt ägande och aktieägare
iShares Trust - iShares iBonds Dec 2026 Term Treasury ETF (US:IBTG) har 284 Institutionella ägare och aktieägare som har lämnat in 13D/G- eller 13F-formulär till Securities Exchange Commission (SEC). Dessa institut innehar totalt 68,907,019 aktier. Största aktieägare inkluderar Kovitz Investment Group Partners, LLC, Hm Payson & Co, Morgan Stanley, Bank Of America Corp /de/, Colony Group, LLC, Wells Fargo & Company/mn, Capital Investment Advisors, LLC, GWM Advisors LLC, Raymond James Financial Inc, and UBS Group AG .
iShares Trust - iShares iBonds Dec 2026 Term Treasury ETF (NasdaqGM:IBTG) Institutionell ägarstruktur visar institutioners och fonders nuvarande positioner i företaget, samt de senaste förändringarna i positionernas storlek. Större aktieägare kan vara enskilda investerare, fonder, hedgefonder eller institutioner. Bilaga 13D visar att investeraren äger (eller ägde) mer än 5% av företaget och avser (eller avsåg) att aktivt eftersträva en förändring av affärsstrategin. Schedule 13G indikerar en passiv investering på över 5%.
The share price as of September 12, 2025 is 22,92 / share. Previously, on September 16, 2024, the share price was 23,06 / share. This represents a decline of 0,63% over that period.
Fondsentimentets poäng
Fondsentimentet poängen(fka Ägarackumulation-poäng) visar vilka aktier som är mest köpta av fonder. Det är resultatet av en sofistikerad kvantitativ flerfaktormodell som identifierar företag med de högsta nivåerna av institutionell ackumulering. Poängsättningsmodellen använder en kombination av den totala ökningen av redovisade ägare, förändringarna i portföljallokeringarna för dessa ägare och andra mått. Siffran sträcker sig från 0 till 100, där högre siffror indikerar en högre nivå av ackumulering i förhållande till sina konkurrenter, och 50 är genomsnittet.
Uppdateringsfrekvens: Dagligen
Se Ownership Explorer, som innehåller en lista över de högst rankade företagen.
Institutionell sälj/köp-kvot
Förutom att rapportera vanliga eget kapital- och skuldemissioner måste institutioner med mer än 100MM tillgångar under förvaltning också avslöja sina innehav av sälj- och köpoptioner. Eftersom säljoptioner i allmänhet indikerar ett negativt sentiment och köpoptioner indikerar ett positivt sentiment, kan vi få en uppfattning om det övergripande institutionella sentimentet genom att plotta förhållandet mellan säljoptioner och köpoptioner. Diagrammet till höger visar det historiska förhållandet mellan sälj- och köpoptioner för detta instrument.
Genom att använda sälj/köp-kvoten som en indikator på aktieägarnas sentiment undviker man en av de största bristerna med att använda det totala institutionella ägandet, nämligen att en betydande del av de förvaltade tillgångarna investeras passivt för att följa index. Passivt förvaltade fonder köper vanligtvis inte optioner, så indikatorn för sälj/köp-kvoten ger en bättre bild av stämningen i aktivt förvaltade fonder.
13F- och NPORT-arkiveringar
Detaljer om 13F-arkiveringar är gratis. Detaljer om NP-arkiveringar kräver ett premiummedlemskap. Gröna rader indikerar nya positioner. Röda rader indikerar stängda positioner. Klicka på länk symbolen för att se hela transaktionshistoriken.
Uppgradera
för att låsa upp premiumdata och exportera till Excel ![]() .
.
| Fil Datum | Källa | Investerare | Typ | Genomsnittligt pris (beräknat) |
Aktier | Δ Aktier (%) |
Rapporterat värde (1000 USD) |
Δ Värde (%) |
Portföljallokering (%) |
|
|---|---|---|---|---|---|---|---|---|---|---|
| 2025-07-11 | 13F | Compass Ion Advisors, LLC | 44 938 | 20,50 | 1 030 | 20,47 | ||||
| 2025-07-17 | 13F | Robbins Farley Llc | 1 368 | −3,25 | 31 | −3,12 | ||||
| 2025-07-29 | 13F | Stratos Wealth Partners, LTD. | 640 463 | −8,11 | 14 686 | −8,16 | ||||
| 2025-08-14 | 13F | Money Concepts Capital Corp | 25 471 | 100,05 | 584 | 100,00 | ||||
| 2025-07-14 | 13F | UMA Financial Services, Inc. | 16 715 | 0,00 | 383 | 0,00 | ||||
| 2025-08-11 | 13F | United Capital Financial Advisers, Llc | 674 775 | 89,25 | 15 473 | 89,17 | ||||
| 2025-08-14 | 13F | Mml Investors Services, Llc | 176 257 | 5,23 | 4 | 33,33 | ||||
| 2025-08-12 | 13F | PSI Advisors, LLC | 0 | −100,00 | 0 | |||||
| 2025-04-22 | 13F | Mendota Financial Group, LLC | 0 | −100,00 | 0 | |||||
| 2025-07-30 | 13F | Strategic Blueprint, LLC | 349 880 | 24,46 | 8 023 | 24,41 | ||||
| 2025-07-11 | 13F | Wolfstich Capital, LLC | 0 | −100,00 | 0 | −100,00 | ||||
| 2025-08-04 | 13F | 4J Wealth Management LLC | 12 185 | −8,11 | 279 | −8,22 | ||||
| 2025-08-07 | 13F | Hughes Financial Services, LLC | 98 370 | 3,37 | 2 249 | 3,31 | ||||
| 2025-08-06 | 13F | Commonwealth Equity Services, Llc | 497 407 | 4,48 | 11 | 10,00 | ||||
| 2025-08-14 | 13F | Wells Fargo & Company/mn | 2 889 591 | 4,72 | 66 258 | 4,67 | ||||
| 2025-07-16 | 13F | Old Port Advisors | 97 730 | −12,33 | 2 241 | −12,40 | ||||
| 2025-08-11 | 13F | HHM Wealth Advisors, LLC | 589 | 0,00 | 14 | 0,00 | ||||
| 2025-04-29 | 13F | Hm Payson & Co | 4 713 829 | 17,49 | 108 135 | 18,16 | ||||
| 2025-07-23 | 13F | Sunbeam Capital Management, LLC | 85 359 | 0,90 | 1 957 | 0,88 | ||||
| 2025-07-24 | 13F | True Link Financial Advisors, LLC | 91 181 | 2 091 | ||||||
| 2025-08-04 | 13F | Balentine LLC | 1 098 | 0,00 | 25 | 0,00 | ||||
| 2025-08-11 | 13F | Principal Securities, Inc. | 20 083 | 4,62 | 461 | 5,26 | ||||
| 2025-07-30 | 13F | Princeton Global Asset Management LLC | 3 500 | 0,00 | 80 | 0,00 | ||||
| 2025-07-17 | 13F | Stockman Wealth Management, Inc. | 149 045 | 5,55 | 3 418 | 5,50 | ||||
| 2025-07-23 | 13F | Spectrum Asset Management, Inc. (NB/CA) | 18 648 | 28,22 | 428 | 28,23 | ||||
| 2025-07-15 | 13F | BCS Wealth Management | 0 | −100,00 | 0 | |||||
| 2025-08-13 | 13F | SCS Capital Management LLC | 101 026 | 0,19 | 2 317 | 0,13 | ||||
| 2025-07-07 | 13F | Greenfield Savings Bank | 19 595 | −1,04 | 449 | −1,10 | ||||
| 2025-08-15 | 13F | Howland Capital Management Llc | 157 661 | 8,46 | 3 615 | 8,43 | ||||
| 2025-07-23 | 13F | Country Club Bank /gfn | 130 793 | −4,57 | 2 998 | −4,58 | ||||
| 2025-05-07 | 13F | Spectrum Wealth Counsel, LLC | 5 007 | 0,00 | 115 | 0,00 | ||||
| 2025-07-14 | 13F | Park Avenue Securities Llc | 98 676 | 5,41 | 2 | 0,00 | ||||
| 2025-08-14 | 13F | Essential Planning, LLC. | 61 646 | −14,86 | 1 414 | −14,93 | ||||
| 2025-08-14 | 13F | Susquehanna International Group, Llp | 16 922 | 388 | ||||||
| 2025-07-09 | 13F | Chesley Taft & Associates LLC | 18 600 | 0,00 | 426 | 0,00 | ||||
| 2025-08-14 | 13F | GWM Advisors LLC | 1 780 749 | −3,77 | 40 833 | −3,82 | ||||
| 2025-08-06 | 13F | AE Wealth Management LLC | 2 956 | 0,00 | 68 | 0,00 | ||||
| 2025-08-19 | 13F | Advisory Services Network, LLC | 9 160 | 210 | ||||||
| 2025-07-15 | 13F | Fifth Third Bancorp | 2 185 | 0,00 | 50 | 0,00 | ||||
| 2025-07-08 | 13F | Richard P Slaughter Associates Inc | 35 425 | 23,05 | 812 | 23,03 | ||||
| 2025-04-22 | 13F | Synergy Financial Management, LLC | 0 | −100,00 | 0 | |||||
| 2025-08-01 | 13F | Liberty Wealth Management Llc | 13 494 | 309 | ||||||
| 2025-08-15 | 13F | Captrust Financial Advisors | 174 584 | 5,06 | 4 003 | 5,01 | ||||
| 2025-04-11 | 13F | Safeguard Financial, LLC | 47 532 | 16,57 | 1 090 | 17,20 | ||||
| 2025-07-29 | 13F | Flavin Financial Services, Inc. | 173 485 | −2,19 | 3 978 | −2,21 | ||||
| 2025-05-14 | 13F | Vertex Planning Partners, LLC | 0 | −100,00 | 0 | |||||
| 2025-07-07 | 13F | Trust Co | 66 734 | −10,49 | 1 530 | −10,53 | ||||
| 2025-08-14 | 13F | Hara Capital LLC | 3 346 | 0,00 | 77 | 0,00 | ||||
| 2025-08-14 | 13F | CIBC World Markets Inc. | 28 655 | 0,00 | 657 | 0,00 | ||||
| 2025-08-11 | 13F | Atlantic Private Wealth, LLC | 194 920 | 50,60 | 4 470 | 50,52 | ||||
| 2025-05-15 | 13F | Wealth Management Strategies, Inc. | 392 562 | 11,56 | 9 005 | 11 156,25 | ||||
| 2025-07-23 | 13F | Valmark Advisers, Inc. | 138 197 | 8,10 | 3 169 | 8,05 | ||||
| 2025-08-13 | 13F | Hamel Associates, Inc. | 10 210 | 234 | ||||||
| 2025-08-14 | 13F | UBS Group AG | 1 513 861 | −4,13 | 34 713 | −4,17 | ||||
| 2025-07-16 | 13F | Littlejohn Financial Services, Inc. | 123 820 | 3,65 | 2 839 | 3,61 | ||||
| 2025-08-13 | 13F | Raab & Moskowitz Asset Management LLC | 9 488 | 218 | ||||||
| 2025-08-08 | 13F | Woodley Farra Manion Portfolio Management Inc | 11 175 | 256 | ||||||
| 2025-08-04 | 13F | Grant Street Asset Management, Inc. | 22 804 | 1,03 | 523 | 0,97 | ||||
| 2025-08-11 | 13F | TD Waterhouse Canada Inc. | 62 388 | 0,00 | 1 424 | −0,14 | ||||
| 2025-08-11 | 13F | Brown Brothers Harriman & Co | 800 | 0,00 | 18 | 0,00 | ||||
| 2025-08-12 | 13F | OneAscent Financial Services LLC | 490 666 | 113,04 | 11 | 120,00 | ||||
| 2025-08-13 | 13F | Flow Traders U.s. Llc | 15 664 | 0,51 | 0 | |||||
| 2025-08-13 | 13F | RFP Financial Group LLC | 28 632 | 11,28 | 657 | 11,19 | ||||
| 2025-07-30 | 13F | Granite Harbor Advisors, Inc. | 35 339 | 2,66 | 810 | 2,66 | ||||
| 2025-08-12 | 13F | BlackRock, Inc. | 185 129 | 20,68 | 4 245 | 20,63 | ||||
| 2025-08-11 | 13F | Summit Wealth Partners, LLC | 63 898 | 7,44 | 1 465 | 7,40 | ||||
| 2025-08-13 | 13F | Beacon Pointe Advisors, LLC | 26 849 | −2,90 | 616 | −3,00 | ||||
| 2025-07-30 | 13F | Bogart Wealth, LLC | 3 241 | 0,12 | 74 | 0,00 | ||||
| 2025-08-07 | 13F | Allworth Financial LP | 134 975 | 40,61 | 3 095 | 40,64 | ||||
| 2025-08-11 | 13F | Annis Gardner Whiting Capital Advisors, LLC | 890 | 20 | ||||||
| 2025-07-11 | 13F | Financial Advisory Corp | 1 420 533 | 0,86 | 32 573 | 0,82 | ||||
| 2025-08-12 | 13F | Reliant Wealth Planning | 57 728 | 4,36 | 1 324 | 4,34 | ||||
| 2025-07-16 | 13F | Kerntke Otto McGlone Wealth Management Group | 242 524 | −5,10 | 5 561 | −5,13 | ||||
| 2025-07-22 | 13F | Merit Financial Group, LLC | 44 010 | 1 009 | ||||||
| 2025-08-13 | 13F | Northwestern Mutual Wealth Management Co | 784 753 | 5,01 | 17 994 | 4,96 | ||||
| 2025-08-14 | 13F | Fmr Llc | 848 | 12,32 | 19 | 11,76 | ||||
| 2025-08-14 | 13F | Mariner, LLC | 204 722 | 12,31 | 4 694 | 12,27 | ||||
| 2025-05-08 | 13F | Shufro Rose & Co Llc | 0 | −100,00 | 0 | |||||
| 2025-08-14 | 13F | Raymond James Financial Inc | 1 778 324 | 48,11 | 40 777 | 48,05 | ||||
| 2025-08-14 | 13F | Mercer Global Advisors Inc /adv | 651 224 | 41,92 | 14 933 | 41,86 | ||||
| 2025-07-11 | 13F | SILVER OAK SECURITIES, Inc | 12 404 | 0,67 | 284 | 0,71 | ||||
| 2025-08-14 | 13F | Colony Group, LLC | 3 160 744 | 3,65 | 72 476 | 3,61 | ||||
| 2025-07-18 | 13F | Cooper Financial Group | 12 508 | 0,85 | 287 | 0,70 | ||||
| 2025-07-24 | 13F | Leo Wealth, LLC | 33 458 | −26,54 | 767 | −26,53 | ||||
| 2025-06-23 | NP | LDRT - iShares iBonds 1-5 Year Treasury Ladder ETF | 170 935 | 200,01 | 3 926 | 201,30 | ||||
| 2025-07-22 | 13F | Yoder Wealth Management, Inc. | 18 431 | 0,00 | 423 | 0,00 | ||||
| 2025-08-18 | 13F/A | Kestra Investment Management, LLC | 15 180 | −49,71 | 348 | −49,71 | ||||
| 2025-08-13 | 13F | Capital Analysts, Inc. | 2 004 | 0,00 | 0 | |||||
| 2025-08-12 | 13F | Change Path, LLC | 53 680 | 33,60 | 1 231 | 33,55 | ||||
| 2025-08-14 | 13F | Integrated Wealth Concepts LLC | 1 344 636 | 7,73 | 30 832 | 7,68 | ||||
| 2025-08-01 | 13F | Envestnet Asset Management Inc | 1 128 586 | 28,49 | 25 878 | 28,43 | ||||
| 2025-07-31 | 13F | Keeler THomas Management LLC | 81 332 | −27,58 | 1 865 | −27,64 | ||||
| 2025-07-18 | 13F | Foundry Financial Group, Inc. | 54 175 | −12,29 | 1 242 | −12,29 | ||||
| 2025-08-12 | 13F | Titleist Asset Management, Llc | 300 277 | 6,58 | 6 885 | 6,55 | ||||
| 2025-08-11 | 13F | Pineridge Advisors LLC | 9 210 | 1,03 | 211 | 0,96 | ||||
| 2025-07-15 | 13F | Focused Wealth Management, Inc | 19 047 | 3,79 | 437 | 3,81 | ||||
| 2025-08-12 | 13F | MAI Capital Management | 165 330 | 0,53 | 3 791 | 0,50 | ||||
| 2025-07-16 | 13F | Novem Group | 34 838 | 6,40 | 799 | 6,26 | ||||
| 2025-08-15 | 13F | CI Private Wealth, LLC | 8 871 | −44,02 | 203 | −44,08 | ||||
| 2025-08-05 | 13F | Hills Bank & Trust Co | 12 633 | 3,58 | 290 | 3,58 | ||||
| 2025-09-04 | 13F/A | Advisor Group Holdings, Inc. | 672 561 | −5,57 | 15 426 | −5,61 | ||||
| 2025-05-14 | 13F | Van Hulzen Asset Management, LLC | 0 | −100,00 | 0 | |||||
| 2025-05-15 | 13F/A | Orion Portfolio Solutions, LLC | 67 172 | −53,11 | 1 541 | −53,22 | ||||
| 2025-08-13 | 13F | Cerity Partners LLC | 20 278 | −0,36 | 465 | −0,43 | ||||
| 2025-08-13 | 13F | Boston Family Office Llc | 226 379 | 12,69 | 5 | 25,00 | ||||
| 2025-08-06 | 13F | Prospera Financial Services Inc | 196 416 | 72,11 | 4 504 | 72,07 | ||||
| 2025-07-07 | 13F | Horizons Wealth Management | 46 552 | −0,10 | 1 067 | −0,09 | ||||
| 2025-08-12 | 13F | Steward Partners Investment Advisory, Llc | 278 439 | −29,88 | 6 385 | −29,92 | ||||
| 2025-08-14 | 13F | Stifel Financial Corp | 443 443 | −5,88 | 10 168 | −5,91 | ||||
| 2025-08-26 | 13F/A | Thrivent Financial For Lutherans | 17 901 | −87,01 | 0 | −100,00 | ||||
| 2025-07-30 | 13F/A | Old Point Trust & Financial Services N A | 15 000 | 0,00 | 344 | −0,29 | ||||
| 2025-07-23 | 13F | Prime Capital Investment Advisors, LLC | 10 100 | 232 | ||||||
| 2025-08-19 | 13F | Asset Dedication, LLC | 30 938 | 11,00 | 709 | 10,95 | ||||
| 2025-08-05 | 13F | Fullcircle Wealth Llc | 58 474 | −1,13 | 1 337 | −1,55 | ||||
| 2025-07-10 | 13F | Oliver Lagore Vanvalin Investment Group | 1 973 | 0,15 | 45 | 2,27 | ||||
| 2025-07-01 | 13F | Harbor Investment Advisory, Llc | 1 200 | 0,00 | 28 | 0,00 | ||||
| 2025-08-12 | 13F | Eldridge Investment Advisors, Inc. | 194 779 | 1,32 | 4 451 | 0,93 | ||||
| 2025-08-14 | 13F | Vista Private Wealth Partners. LLC | 780 842 | 15,04 | 17 905 | 14,99 | ||||
| 2025-07-16 | 13F | MKT Advisors LLC | 550 370 | 3,15 | 12 570 | 2,92 | ||||
| 2025-08-08 | 13F | Cetera Investment Advisers | 135 115 | 1,57 | 3 098 | 1,54 | ||||
| 2025-08-12 | 13F | LPL Financial LLC | 1 205 892 | 11,20 | 27 651 | 11,16 | ||||
| 2025-07-24 | 13F/A | TFR Capital, LLC. | 84 346 | 24,22 | 1 934 | 24,21 | ||||
| 2025-07-25 | 13F | Heartland Bank & Trust Co | 18 650 | 8,22 | 428 | 8,10 | ||||
| 2025-08-13 | 13F | Baird Financial Group, Inc. | 367 389 | 18,60 | 8 424 | 18,56 | ||||
| 2025-04-28 | 13F | Strategic Financial Concepts, LLC | 0 | −100,00 | 0 | −100,00 | ||||
| 2025-07-25 | 13F | Atria Wealth Solutions, Inc. | 179 051 | −6,50 | 4 106 | −6,53 | ||||
| 2025-08-08 | 13F | Creative Planning | 88 250 | 1,47 | 2 024 | 1,40 | ||||
| 2025-08-06 | 13F | Black Swift Group, LLC | 103 300 | −1,10 | 2 369 | −1,17 | ||||
| 2025-07-29 | 13F | Koshinski Asset Management, Inc. | 16 432 | 377 | ||||||
| 2025-07-14 | 13F | Conrad Siegel Investment Advisors, Inc. | 21 160 | −40,42 | 485 | −40,42 | ||||
| 2025-07-25 | 13F | Hemington Wealth Management | 1 214 | 0,00 | 0 | |||||
| 2025-08-05 | 13F | Gould Asset Management Llc /ca/ | 90 433 | 5,19 | 2 074 | 5,12 | ||||
| 2025-08-01 | 13F | Koss-Olinger Consulting, LLC | 24 382 | 1,39 | 559 | 1,27 | ||||
| 2025-08-11 | 13F | HighTower Advisors, LLC | 372 840 | −0,37 | 8 549 | −0,42 | ||||
| 2025-04-17 | 13F | Montecito Bank & Trust | 49 748 | 6,42 | 1 141 | 7,04 | ||||
| 2025-08-13 | 13F | Jones Financial Companies Lllp | 0 | −100,00 | 0 | |||||
| 2025-07-23 | 13F | Element Wealth, LLC | 38 488 | 12,48 | 883 | 12,50 | ||||
| 2025-08-15 | 13F | Morgan Stanley | 3 805 089 | −3,33 | 87 251 | −3,38 | ||||
| 2025-08-05 | 13F | Bank Of Montreal /can/ | 3 548 | 78,92 | 81 | 80,00 | ||||
| 2025-07-17 | 13F | Janney Montgomery Scott LLC | 302 181 | 16,00 | 7 | 20,00 | ||||
| 2025-07-25 | 13F | NorthRock Partners, LLC | 1 500 | −64,29 | 34 | −64,58 | ||||
| 2025-08-04 | 13F | Savvy Advisors, Inc. | 27 057 | 3,42 | 620 | 3,33 | ||||
| 2025-07-24 | 13F | Eastern Bank | 1 990 | −53,96 | 46 | −54,55 | ||||
| 2025-07-31 | 13F | Cambridge Investment Research Advisors, Inc. | 100 762 | −0,70 | 2 | 0,00 | ||||
| 2025-08-11 | 13F | Wealthspire Advisors, LLC | 135 573 | −0,93 | 3 109 | −0,99 | ||||
| 2025-07-21 | 13F | Mattern Capital Management, Llc | 12 606 | 0,00 | 289 | 0,00 | ||||
| 2025-08-04 | 13F | Mesirow Financial Investment Management, Inc. | 299 583 | −0,22 | 6 869 | −0,26 | ||||
| 2025-08-18 | 13F/A | National Bank Of Canada /fi/ | 7 759 | 1,96 | 178 | 1,72 | ||||
| 2025-08-05 | 13F | Huntington National Bank | 384 | 0,00 | ||||||
| 2025-07-18 | 13F | McGuire Investment Group, LLC | 318 186 | 7 296 | ||||||
| 2025-08-14 | 13F | IHT Wealth Management, LLC | 8 816 | 202 | ||||||
| 2025-08-14 | 13F | Citadel Advisors Llc | 10 683 | −81,42 | 245 | −81,50 | ||||
| 2025-05-15 | 13F | Wick Capital Partners, LLC | 0 | −100,00 | 0 | |||||
| 2025-07-08 | 13F | Apella Capital, LLC | 424 481 | 15,34 | 9 695 | 15,09 | ||||
| 2025-08-08 | 13F | Summitry Llc | 1 455 550 | 4,01 | 33 376 | 3,97 | ||||
| 2025-08-12 | 13F | Laurel Wealth Advisors LLC | 142 166 | 2 193,00 | 6 | −95,77 | ||||
| 2025-08-14 | 13F | Financial Engines Advisors L.L.C. | 340 662 | −11,00 | 7 811 | −11,04 | ||||
| 2025-08-13 | 13F | Lido Advisors, LLC | 241 829 | −4,30 | 5 545 | −4,35 | ||||
| 2025-08-06 | 13F | Savant Capital, LLC | 15 021 | 344 | ||||||
| 2025-08-08 | 13F | Bailard, Inc. | 125 079 | −81,04 | 2 868 | −81,05 | ||||
| 2025-08-06 | 13F | Modera Wealth Management, LLC | 28 447 | 0,00 | 652 | 0,00 | ||||
| 2025-07-24 | 13F | Moseley Investment Management Inc | 211 555 | 370,12 | 4 851 | 369,96 | ||||
| 2025-08-04 | 13F | Jim Saulnier & Associates, Llc | 45 039 | 7,39 | 1 033 | 7,28 | ||||
| 2025-08-14 | 13F | Visionary Wealth Advisors | 12 069 | 277 | ||||||
| 2025-07-15 | 13F | Unified Investment Management | 8 763 | 0,00 | 201 | −0,50 | ||||
| 2025-08-12 | 13F | Nemes Rush Group LLC | 58 | 1,75 | 1 | 0,00 | ||||
| 2025-08-14 | 13F | Eight 31 Financial Llc | 267 196 | 2,47 | 6 127 | 2,41 | ||||
| 2025-07-24 | 13F | Us Bancorp \de\ | 500 | 0,00 | 11 | 0,00 | ||||
| 2025-07-25 | 13F | Apollon Wealth Management, LLC | 987 956 | 1,76 | 22 654 | 1,72 | ||||
| 2025-07-15 | 13F | Highland Financial Advisors, LLC | 11 027 | 0,00 | 253 | 0,00 | ||||
| 2025-08-11 | 13F | Regal Investment Advisors LLC | 26 385 | −12,38 | 605 | −12,32 | ||||
| 2025-08-11 | 13F | Aptus Capital Advisors, LLC | 7 133 | 5 144,85 | 164 | 5 333,33 | ||||
| 2025-07-11 | 13F | Farther Finance Advisors, LLC | 1 150 | −89,55 | 26 | −89,64 | ||||
| 2025-07-08 | 13F | Gradient Investments LLC | 200 526 | 3,76 | 4 598 | 3,72 | ||||
| 2025-07-31 | 13F | Carnegie Capital Asset Management, LLC | 734 491 | 9,13 | 16 842 | 9,32 | ||||
| 2025-04-01 | 13F | Cornerstone Planning, LLC | 125 821 | 2 870 | ||||||
| 2025-07-11 | 13F | Pinnacle Bancorp, Inc. | 25 396 | 0,00 | 582 | 0,00 | ||||
| 2025-07-14 | 13F | AdvisorNet Financial, Inc | 794 | −83,19 | 18 | −83,33 | ||||
| 2025-07-11 | 13F | First PREMIER Bank | 729 | −3,95 | 0 | |||||
| 2025-08-08 | 13F | Thoroughbred Financial Services, Llc | 73 042 | −10,03 | 2 | 0,00 | ||||
| 2025-08-11 | 13F | FSA Wealth Management LLC | 89 | 2 | ||||||
| 2025-07-29 | 13F | Stratos Wealth Advisors, LLC | 507 700 | 853,75 | 11 642 | 853,40 | ||||
| 2025-08-05 | 13F | Fourth Dimension Wealth, LLC | 41 276 | 340,42 | 946 | 342,06 | ||||
| 2025-07-09 | 13F | Byrne Asset Management LLC | 0 | −100,00 | 0 | |||||
| 2025-07-18 | 13F | Precision Wealth Strategies, LLC | 10 063 | 231 | ||||||
| 2025-07-08 | 13F | Lowe Wealth Advisors, LLC | 1 200 | 0,00 | 28 | 0,00 | ||||
| 2025-07-30 | 13F | Drive Wealth Management, Llc | 79 505 | −1,43 | 1 823 | −1,46 | ||||
| 2025-08-12 | 13F | Associated Banc-corp | 82 291 | 8,47 | 1 887 | 8,39 | ||||
| 2025-07-22 | 13F | Mascoma Wealth Management LLC | 9 988 | 0,00 | 229 | 0,00 | ||||
| 2025-07-22 | 13F | Berger Financial Group, Inc | 16 292 | −4,62 | 374 | −4,60 | ||||
| 2025-08-06 | 13F | Cannon Financial Strategists, Inc. | 61 519 | 0,99 | 1 411 | 0,93 | ||||
| 2025-08-07 | 13F | Sound View Wealth Advisors Group, LLC | 241 272 | 5 532 | ||||||
| 2025-08-14 | 13F | Comerica Bank | 12 202 | −40,30 | 280 | −40,38 | ||||
| 2025-08-27 | 13F/A | Brinker Capital Investments, LLC | 65 467 | −2,54 | 1 501 | −2,53 | ||||
| 2025-08-04 | 13F | Pensionmark Financial Group, Llc | 15 606 | 0,13 | 358 | 0,00 | ||||
| 2025-08-12 | 13F | Proequities, Inc. | 0 | 0 | ||||||
| 2025-08-14 | 13F | Ameriprise Financial Inc | 210 134 | −24,64 | 4 818 | −24,70 | ||||
| 2025-08-13 | 13F | MONECO Advisors, LLC | 12 588 | 0,00 | 289 | 0,00 | ||||
| 2025-07-15 | 13F | Beacon Financial Planning, Inc | 16 075 | 0,65 | 369 | 0,55 | ||||
| 2025-07-17 | 13F/A | Capital Investment Advisors, LLC | 2 336 393 | −0,62 | 53 573 | −0,66 | ||||
| 2025-08-07 | 13F | Kestra Private Wealth Services, Llc | 41 676 | −7,75 | 956 | −7,82 | ||||
| 2025-07-23 | 13F | Madden Advisory Services, Inc. | 24 392 | 4,93 | 559 | 4,88 | ||||
| 2025-08-14 | 13F | Connecticut Wealth Management, LLC | 835 276 | 104,64 | 19 153 | 104,55 | ||||
| 2025-07-18 | 13F | Centricity Wealth Management, LLC | 2 800 | 0,00 | 64 | 0,00 | ||||
| 2025-07-28 | 13F | Harbour Investments, Inc. | 18 809 | 8,94 | 431 | 8,84 | ||||
| 2025-08-08 | 13F | WASHINGTON TRUST Co | 0 | −100,00 | 0 | |||||
| 2025-07-11 | 13F | Trinity Wealth Management, LLC | 31 880 | 8,77 | 731 | 8,78 | ||||
| 2025-08-05 | 13F | Cherry Tree Wealth Management, LLC | 7 062 | 8,05 | 162 | 8,05 | ||||
| 2025-08-13 | 13F | Baltimore-Washington Financial Advisors, Inc. | 435 120 | −9,84 | 9 977 | −9,88 | ||||
| 2025-08-11 | 13F | Avantax Planning Partners, Inc. | 57 909 | −3,37 | 1 328 | −3,42 | ||||
| 2025-07-28 | 13F | BRYN MAWR TRUST Co | 2 500 | −50,00 | 57 | −50,00 | ||||
| 2025-08-14 | 13F | STAR Financial Bank | 90 746 | 9,70 | 2 081 | 9,65 | ||||
| 2025-07-08 | 13F | Legacy Private Trust Co. | 9 778 | 224 | ||||||
| 2025-08-07 | 13F | CENTRAL TRUST Co | 297 191 | 7,91 | 6 815 | 7,87 | ||||
| 2025-08-14 | 13F | Hrt Financial Lp | 0 | −100,00 | 0 | |||||
| 2025-07-18 | 13F | Northstar Group, Inc. | 83 796 | 21,39 | 1 921 | 21,35 | ||||
| 2025-07-31 | 13F | Blake Schutter Theil Wealth Advisors, LLC | 13 915 | 0,00 | 319 | 0,00 | ||||
| 2025-07-29 | 13F | International Assets Investment Management, Llc | 63 280 | 0,00 | 1 451 | 0,00 | ||||
| 2025-08-07 | 13F | Parkside Financial Bank & Trust | 1 354 | 21,76 | 31 | 24,00 | ||||
| 2025-08-11 | 13F | Dorsey & Whitney Trust CO LLC | 14 255 | −14,28 | 327 | −14,44 | ||||
| 2025-07-18 | 13F | Pure Financial Advisors, Inc. | 24 669 | 566 | ||||||
| 2025-07-21 | 13F | Barrett & Company, Inc. | 42 625 | 0,01 | 977 | 0,00 | ||||
| 2025-07-22 | 13F | Belpointe Asset Management LLC | 144 397 | 430,25 | 3 311 | 430,61 | ||||
| 2025-07-24 | 13F | IFP Advisors, Inc | 142 224 | −1,25 | 3 261 | −1,30 | ||||
| 2025-08-01 | 13F | Schmidt P J Investment Management Inc | 10 877 | 0,22 | 249 | 0,40 | ||||
| 2025-08-11 | 13F | CFS Investment Advisory Services, LLC | 17 536 | −0,14 | 0 | |||||
| 2025-08-13 | 13F | Portland Global Advisors LLC | 110 055 | 8,66 | 2 524 | 8,61 | ||||
| 2025-07-23 | 13F | High Note Wealth, LLC | 24 334 | 558 | ||||||
| 2025-07-15 | 13F | RVW Wealth, LLC | 22 257 | 0,76 | 510 | 0,79 | ||||
| 2025-07-09 | 13F | Krilogy Financial LLC | 667 853 | 2,98 | 15 314 | 2,93 | ||||
| 2025-07-29 | 13F | Straight Path Wealth Management | 24 674 | 1,94 | 566 | 1,80 | ||||
| 2025-08-13 | 13F | Cary Street Partners Financial Llc | 28 712 | 6,49 | 658 | 6,47 | ||||
| 2025-07-28 | 13F | Duncker Streett & Co Inc | 25 786 | 0,00 | 591 | 0,00 | ||||
| 2025-08-04 | 13F | Atria Investments Llc | 102 247 | 3,52 | 2 345 | 3,49 | ||||
| 2025-08-15 | 13F | Equitable Holdings, Inc. | 50 853 | −12,11 | 1 166 | −12,13 | ||||
| 2025-08-11 | 13F | Private Advisor Group, LLC | 168 532 | 503,49 | 3 864 | 503,75 | ||||
| 2025-07-22 | 13F | Penobscot Investment Management Company, Inc. | 16 000 | 367 | ||||||
| 2025-07-24 | 13F | Stonebridge Financial Group, LLC | 389 673 | 2,88 | 8 935 | 2,83 | ||||
| 2025-07-30 | 13F | Phillips Financial Management, Llc | 48 994 | −12,17 | 1 123 | −12,20 | ||||
| 2025-08-01 | 13F | Austin Private Wealth, LLC | 65 507 | 13,50 | 1 502 | 13,53 | ||||
| 2025-08-13 | 13F | Black Cypress Capital Management, LLC | 3 018 | 175,87 | 69 | 176,00 | ||||
| 2025-07-21 | 13F | Cliftonlarsonallen Wealth Advisors, Llc | 747 142 | 11,49 | 17 132 | 11,44 | ||||
| 2025-07-29 | 13F | Private Trust Co Na | 3 293 | 0,00 | 76 | 0,00 | ||||
| 2025-07-31 | 13F | Washington Trust Advisors, Inc. | 22 377 | 0,30 | 513 | 0,39 | ||||
| 2025-08-08 | 13F | TD Capital Management LLC | 2 034 | 0,99 | 47 | 0,00 | ||||
| 2025-05-09 | 13F | CoreCap Advisors, LLC | 0 | −100,00 | 0 | |||||
| 2025-07-23 | 13F | Evexia Wealth Llc | 14 431 | −43,96 | 330 | −44,14 | ||||
| 2025-07-14 | 13F | Kfg Wealth Management, Llc | 24 756 | 5,23 | 568 | 5,19 | ||||
| 2025-07-29 | 13F | Accretive Wealth Partners, LLC | 140 504 | 7,00 | 3 222 | 7,22 | ||||
| 2025-08-14 | 13F | Jane Street Group, Llc | 0 | −100,00 | 0 | |||||
| 2025-04-08 | 13F | Parallel Advisors, LLC | 0 | −100,00 | 0 | |||||
| 2025-08-08 | 13F | Pnc Financial Services Group, Inc. | 21 193 | 0,00 | 486 | −0,21 | ||||
| 2025-07-22 | 13F | Autumn Glory Partners, LLC | 12 109 | −2,20 | 278 | −2,46 | ||||
| 2025-08-14 | 13F | Kovitz Investment Group Partners, LLC | 5 260 457 | 14,82 | 120 622 | 14,77 | ||||
| 2025-07-21 | 13F | Crews Bank & Trust | 20 050 | 8,82 | 460 | 8,77 | ||||
| 2025-07-31 | 13F | Leavell Investment Management, Inc. | 224 028 | −7,47 | 5 137 | −7,51 | ||||
| 2025-08-12 | 13F | CIBC Private Wealth Group, LLC | 14 700 | 0,00 | 337 | 0,30 | ||||
| 2025-08-14 | 13F | Goldman Sachs Group Inc | 12 597 | −10,24 | 289 | −10,28 | ||||
| 2025-08-11 | 13F | Midwest Professional Planners, LTD. | 262 423 | 20,03 | 6 017 | 19,98 | ||||
| 2025-08-12 | 13F | Global Retirement Partners, LLC | 310 291 | 85,43 | 7 115 | 86,43 | ||||
| 2025-08-14 | 13F | Royal Bank Of Canada | 482 832 | 0,80 | 11 072 | 0,77 | ||||
| 2025-08-07 | 13F | Montag A & Associates Inc | 68 965 | −15,43 | 1 581 | −15,45 | ||||
| 2025-08-14 | 13F | Bank Of America Corp /de/ | 3 643 624 | 12,28 | 83 548 | 12,23 | ||||
| 2025-07-16 | 13F | Rebalance, Llc | 168 144 | 141,36 | 3 856 | 141,24 | ||||
| 2025-07-21 | 13F | Asset Advisors Investment Management, LLC | 346 169 | 16,42 | 7 938 | 16,36 | ||||
| 2025-08-07 | 13F | Rossmore Private Capital | 8 772 | 0,00 | 201 | 0,00 | ||||
| 2025-08-05 | 13F | Sigma Planning Corp | 48 542 | −1,59 | 1 113 | −1,59 | ||||
| 2025-07-24 | 13F | Riverchase Wealth Management, Llc | 47 261 | 3,54 | 1 084 | 3,44 | ||||
| 2025-07-30 | 13F | Brookstone Capital Management | 67 021 | 6,77 | 1 537 | 6,74 | ||||
| 2025-07-25 | 13F | Stephens Consulting, LLC | 406 623 | 1,11 | 9 324 | 1,06 | ||||
| 2025-08-01 | 13F | James Investment Research Inc | 12 500 | 0,00 | 287 | 0,00 | ||||
| 2025-07-29 | 13F | Regions Financial Corp | 56 664 | 3,49 | 1 299 | 3,42 | ||||
| 2025-08-12 | 13F | Tableaux Llc | 0 | −100,00 | 0 | |||||
| 2025-07-10 | 13F | Klaas Financial Asset Advisors, LLC | 68 621 | −7,18 | 1 573 | −7,20 | ||||
| 2025-07-30 | 13F | DecisionMap Wealth Management, LLC | 8 890 | 204 | ||||||
| 2025-07-11 | 13F | Lantz Financial LLC | 123 672 | 8,37 | 2 836 | 8,33 | ||||
| 2025-07-30 | 13F | Avidian Wealth Solutions, LLC | 10 708 | 246 | ||||||
| 2025-08-12 | 13F | Jpmorgan Chase & Co | 1 292 | −22,12 | 30 | −23,68 | ||||
| 2025-07-24 | 13F | Lokken Investment Group LLC | 9 109 | 209 | ||||||
| 2025-08-01 | 13F | Bank of Jackson Hole Trust | 3 201 | 0,00 | 73 | 0,00 | ||||
| 2025-07-30 | 13F | D.a. Davidson & Co. | 202 673 | −20,05 | 4 647 | −20,09 | ||||
| 2025-07-10 | 13F | Wealth Enhancement Advisory Services, Llc | 176 754 | 13,38 | 4 037 | 12,89 | ||||
| 2025-07-16 | 13F | Signaturefd, Llc | 150 437 | 66,04 | 3 450 | 65,98 | ||||
| 2025-08-08 | 13F | Mv Capital Management, Inc. | 590 467 | −1,35 | 13 539 | −1,39 | ||||
| 2025-07-30 | 13F | Probity Advisors, Inc. | 160 455 | 4,66 | 3 679 | 4,64 | ||||
| 2025-08-15 | 13F | Kestra Advisory Services, LLC | 77 739 | −21,57 | 1 783 | −21,60 | ||||
| 2025-07-24 | 13F | Costello Asset Management, INC | 8 097 | 586,77 | 186 | 585,19 | ||||
| 2025-08-15 | 13F | Scissortail Wealth Management, LLC | 493 150 | 1,89 | 11 308 | 1,85 | ||||
| 2025-08-13 | 13F | Willis Johnson & Associates, Inc. | 10 374 | 13,01 | 238 | 12,86 | ||||
| 2025-08-01 | 13F | Signature Wealth Management Group | 26 797 | −1,29 | 614 | −1,29 | ||||
| 2025-08-11 | 13F | Mill Creek Capital Advisors, LLC | 45 880 | 0,00 | 1 052 | 0,00 | ||||
| 2025-07-25 | 13F | Cwm, Llc | 81 885 | 11,68 | 2 | 0,00 | ||||
| 2025-08-12 | 13F | Coldstream Capital Management Inc | 24 994 | 0,00 | 573 | 0,00 | ||||
| 2025-08-01 | 13F | Transcend Wealth Collective, Llc | 16 501 | 0,00 | 378 | 0,00 | ||||
| 2025-07-09 | 13F | Lbmc Investment Advisors, Llc | 9 070 | 208 | ||||||
| 2025-08-04 | 13F | IFG Advisory, LLC | 11 213 | 0,61 | 257 | 0,78 | ||||
| 2025-08-14 | 13F | AllSquare Wealth Management LLC | 6 904 | 0,00 | 158 | 0,00 | ||||
| 2025-08-11 | 13F | Independent Advisor Alliance | 12 289 | 16,40 | 282 | 16,12 | ||||
| 2025-08-14 | 13F | Modern Wealth Management, LLC | 14 638 | 336 | ||||||
| 2025-07-29 | 13F | Mattson Financial Services, LLC | 0 | −100,00 | 0 | −100,00 | ||||
| 2025-07-31 | 13F | United Community Bank | 11 170 | 0,00 | 256 | 0,00 | ||||
| 2025-08-14 | 13F | Snowden Capital Advisors LLC | 26 686 | 0,00 | 612 | −0,16 | ||||
| 2025-07-31 | 13F | Oppenheimer & Co Inc | 45 174 | 0,35 | 1 036 | 0,29 | ||||
| 2025-05-12 | 13F | Kohmann Bosshard Financial Services, LLC | 0 | −100,00 | 0 | |||||
| 2025-07-11 | 13F | Shelton Wealth Management, Llc | 329 329 | 5,22 | 7 552 | 5,17 | ||||
| 2025-08-14 | 13F | Mairs & Power Inc | 14 255 | 327 |