Grundläggande statistik
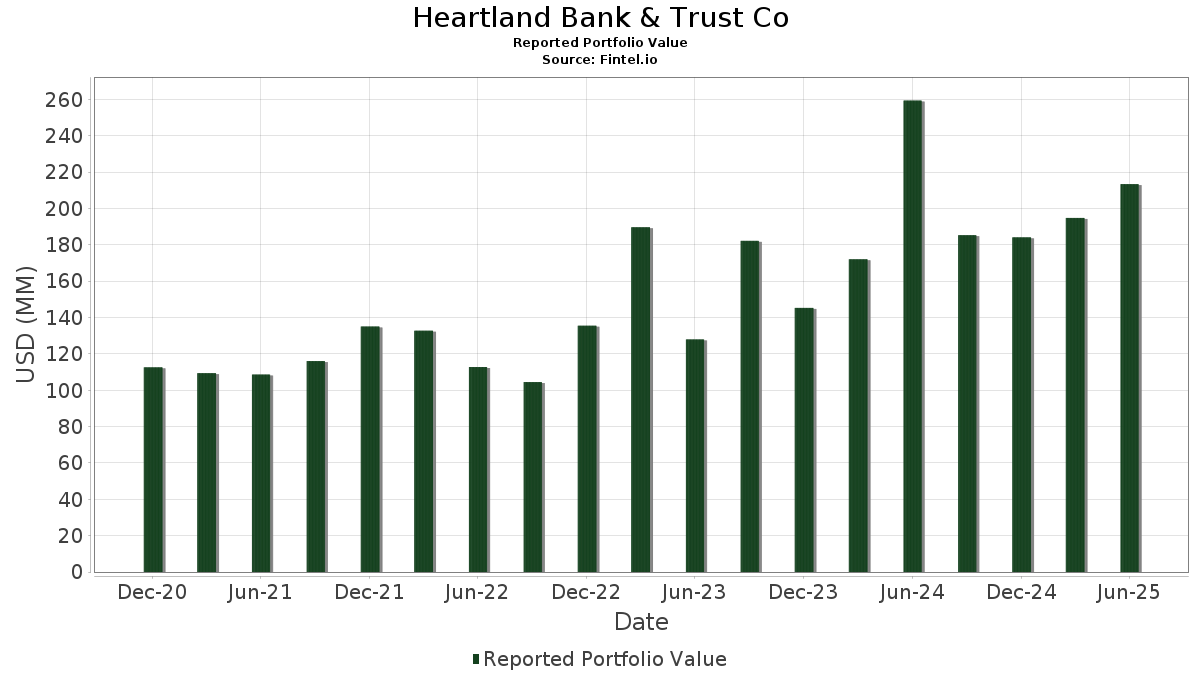
| Portföljvärde | $ 213 399 033 |
| Aktuella positioner | 166 |
Senaste innehav, resultat, förvaltat kapital (från 13F, 13D)
Heartland Bank & Trust Co har redovisat 166 totala innehav i sina senaste SEC-arkiveringar. Det senaste portföljvärdet beräknas vara $ 213 399 033 USD. Faktiskt förvaltade tillgångar (AUM) är detta värde plus likvida medel (som inte redovisas). Heartland Bank & Trust Cos största innehav är iShares Trust - iShares Global Infrastructure ETF (US:IGF) , Microsoft Corporation (US:MSFT) , Apple Inc. (US:AAPL) , NVIDIA Corporation (US:NVDA) , and Alphabet Inc. (US:GOOGL) . Heartland Bank & Trust Cos nya positioner inkluderar Welltower Inc. (US:WELL) , Invitation Homes Inc. (US:INVH) , International Paper Company (US:IP) , Vistra Corp. (US:VST) , and .
Största ökningarna detta kvartal
Vi använder förändringen i portföljallokeringen eftersom det är det mest meningsfulla måttet. Förändringar kan bero på transaktioner eller förändringar i aktiekurser.
| Värdepapper | Aktier (MM) |
Värde (MM$) |
Portfölj % av | ΔPortfölj % av |
|---|---|---|---|---|
| 0,03 | 14,23 | 6,6680 | 2,8234 | |
| 0,07 | 11,68 | 5,4727 | 2,6045 | |
| 0,01 | 4,07 | 1,9093 | 1,0183 | |
| 0,01 | 5,30 | 2,4816 | 0,9787 | |
| 0,06 | 12,08 | 5,6628 | 0,7256 | |
| 0,01 | 3,93 | 1,8408 | 0,6300 | |
| 0,02 | 2,13 | 0,9977 | 0,4340 | |
| 0,00 | 0,88 | 0,4104 | 0,4104 | |
| 0,14 | 3,47 | 1,1451 | 0,4096 | |
| 0,03 | 2,61 | 1,2229 | 0,4022 |
Största minskningarna detta kvartal
Vi använder förändringen i portföljallokeringen eftersom det är det mest meningsfulla måttet. Förändringar kan bero på transaktioner eller förändringar i aktiepriser.
| Värdepapper | Aktier (MM) |
Värde (MM$) |
Portfölj % av | ΔPortfölj % av |
|---|---|---|---|---|
| 0,31 | 18,12 | 5,9764 | −0,3822 | |
| 0,01 | 0,76 | 0,2499 | −0,3621 | |
| 0,00 | 1,14 | 0,3772 | −0,3206 | |
| 0,20 | 6,89 | 2,2726 | −0,2742 | |
| 0,02 | 1,98 | 0,6517 | −0,2397 | |
| 0,01 | 3,90 | 1,2862 | −0,1702 | |
| 0,00 | 2,25 | 0,7423 | −0,1470 | |
| 0,01 | 1,69 | 0,5583 | −0,1297 | |
| 0,01 | 1,96 | 0,6477 | −0,1151 | |
| 0,00 | 0,20 | 0,0662 | −0,0979 |
13F- och fond arkiveringar
Denna blankett lämnades in den 2025-07-25 för rapporteringsperioden 2025-06-30. Klicka på länksymbolen för att se hela transaktionshistoriken.
Uppgradera för att låsa upp premiumdata och exportera till Excel![]() .
.
| Värdepapper | Typ | Genomsnittligt aktiepris | Aktier (MM) |
ΔAktier (%) |
ΔAktier (%) |
Värde ($MM) |
Portfölj (%) |
ΔPortfölj (%) |
|
|---|---|---|---|---|---|---|---|---|---|
| IGF / iShares Trust - iShares Global Infrastructure ETF | 0,31 | −6,90 | 18,12 | 0,81 | 5,9764 | −0,3822 | |||
| MSFT / Microsoft Corporation | 0,03 | −1,21 | 14,23 | 30,90 | 6,6680 | 2,8234 | |||
| AAPL / Apple Inc. | 0,06 | −6,28 | 12,08 | −13,43 | 5,6628 | 0,7256 | |||
| NVDA / NVIDIA Corporation | 0,07 | −1,21 | 11,68 | 44,01 | 5,4727 | 2,6045 | |||
| GOOGL / Alphabet Inc. | 0,05 | 0,41 | 7,98 | 14,43 | 2,6304 | 0,1647 | |||
| DJP / iPath Bloomberg Commodity Index Total Return ETN - Structured Product | 0,20 | −0,54 | 6,89 | −4,28 | 2,2726 | −0,2742 | |||
| AMZN / Amazon.com, Inc. | 0,03 | −1,89 | 6,01 | 13,13 | 1,9802 | 0,1028 | |||
| META / Meta Platforms, Inc. | 0,01 | −2,69 | 5,30 | 24,62 | 2,4816 | 0,9787 | |||
| AVGO / Broadcom Inc. | 0,01 | −1,76 | 4,07 | 61,73 | 1,9093 | 1,0183 | |||
| JPM / JPMorgan Chase & Co. | 0,01 | −2,91 | 3,93 | 14,75 | 1,8408 | 0,6300 | |||
| LLY / Eli Lilly and Company | 0,01 | 0,36 | 3,90 | −5,27 | 1,2862 | −0,1702 | |||
| IBDS / iShares Trust - iShares iBonds Dec 2027 Term Corporate ETF | 0,15 | 51,93 | 3,65 | 52,50 | 1,2052 | 0,3575 | |||
| IBDT / iShares Trust - iShares iBonds Dec 2028 Term Corporate ETF | 0,14 | 65,94 | 3,47 | 67,00 | 1,1451 | 0,4096 | |||
| IBDR / iShares Trust - iShares iBonds Dec 2026 Term Corporate ETF | 0,12 | 41,84 | 2,98 | 42,07 | 0,9811 | 0,2404 | |||
| NFLX / Netflix, Inc. | 0,00 | −2,97 | 2,63 | 39,38 | 0,8659 | 0,1993 | |||
| WMT / Walmart Inc. | 0,03 | 0,97 | 2,61 | 12,46 | 1,2229 | 0,4022 | |||
| IBDQ / iShares Trust - iShares iBonds Dec 2025 Term Corporate ETF | 0,09 | 70,82 | 2,32 | 71,07 | 0,7646 | 0,2851 | |||
| TSLA / Tesla, Inc. | 0,01 | −2,27 | 2,28 | 19,79 | 1,0695 | 0,3957 | |||
| BRK.B / Berkshire Hathaway Inc. | 0,00 | −1,84 | 2,25 | −10,46 | 0,7423 | −0,1470 | |||
| AMD / Advanced Micro Devices, Inc. | 0,02 | −3,29 | 2,13 | 33,65 | 0,9977 | 0,4340 | |||
| XOM / Exxon Mobil Corporation | 0,02 | −2,07 | 2,01 | −11,24 | 0,9401 | 0,1408 | |||
| SHV / iShares Trust - iShares Short Treasury Bond ETF | 0,02 | −21,56 | 1,98 | −21,59 | 0,6517 | −0,2397 | |||
| PG / The Procter & Gamble Company | 0,01 | −2,58 | 1,96 | −8,91 | 0,6477 | −0,1151 | |||
| V / Visa Inc. | 0,01 | −1,32 | 1,88 | −0,05 | 0,6212 | −0,0453 | |||
| ABBV / AbbVie Inc. | 0,01 | −1,76 | 1,69 | −12,96 | 0,5583 | −0,1297 | |||
| MA / Mastercard Incorporated | 0,00 | −0,91 | 1,65 | 1,61 | 0,5425 | −0,0303 | |||
| CRM / Salesforce, Inc. | 0,01 | −2,76 | 1,59 | −1,25 | 0,5229 | −0,0447 | |||
| PLTR / Palantir Technologies Inc. | 0,01 | −0,66 | 1,56 | 60,57 | 0,7330 | 0,3882 | |||
| JNJ / Johnson & Johnson | 0,01 | −1,32 | 1,41 | −9,10 | 0,4645 | −0,0836 | |||
| HD / The Home Depot, Inc. | 0,00 | −0,88 | 1,41 | −0,85 | 0,4637 | −0,0379 | |||
| IBM / International Business Machines Corporation | 0,00 | −1,33 | 1,35 | 16,96 | 0,6338 | 0,2248 | |||
| SPGI / S&P Global Inc. | 0,00 | −2,05 | 1,33 | 1,68 | 0,4399 | −0,0243 | |||
| GSCE / GS Connect S&P GSCI Enhanced Commodity Total Return ETN | 0,00 | −2,94 | 1,24 | 25,84 | 0,4079 | 0,0600 | |||
| ABT / Abbott Laboratories | 0,01 | −1,98 | 1,23 | 0,57 | 0,4069 | −0,0274 | |||
| GE / General Electric Company | 0,00 | 38,90 | 1,23 | 78,72 | 0,4046 | 0,1616 | |||
| COST / Costco Wholesale Corporation | 0,00 | −2,60 | 1,19 | 1,89 | 0,3910 | −0,0204 | |||
| UNH / UnitedHealth Group Incorporated | 0,00 | −2,65 | 1,14 | −42,04 | 0,3772 | −0,3206 | |||
| ISRG / Intuitive Surgical, Inc. | 0,00 | −1,98 | 1,10 | 7,52 | 0,3632 | 0,0010 | |||
| CAT / Caterpillar Inc. | 0,00 | 0,00 | 1,07 | 17,66 | 0,3518 | 0,0312 | |||
| KLAC / KLA Corporation | 0,00 | 0,00 | 1,07 | 31,81 | 0,3515 | 0,0654 | |||
| MU / Micron Technology, Inc. | 0,01 | −3,61 | 1,06 | 36,66 | 0,3481 | 0,0750 | |||
| FITB / Fifth Third Bancorp | 0,02 | −3,62 | 1,02 | 1,19 | 0,3370 | −0,0204 | |||
| CVX / Chevron Corporation | 0,01 | 8,89 | 1,02 | −6,77 | 0,3361 | −0,0507 | |||
| BSX / Boston Scientific Corporation | 0,01 | −2,40 | 1,02 | 3,88 | 0,4769 | 0,1305 | |||
| ADP / Automatic Data Processing, Inc. | 0,00 | −1,76 | 1,00 | −0,79 | 0,3296 | −0,0269 | |||
| PANW / Palo Alto Networks, Inc. | 0,00 | −2,28 | 0,99 | 17,30 | 0,3265 | 0,0277 | |||
| PPL / PPL Corporation | 0,03 | 5,41 | 0,98 | −1,11 | 0,3237 | −0,0273 | |||
| NOW / ServiceNow, Inc. | 0,00 | −0,73 | 0,98 | 28,10 | 0,4596 | 0,1890 | |||
| FOX / Fox Corporation | 0,02 | −3,22 | 0,97 | −5,18 | 0,3201 | −0,0421 | |||
| JCI / Johnson Controls International plc | 0,01 | −1,15 | 0,95 | 30,27 | 0,3137 | 0,0555 | |||
| AJG / Arthur J. Gallagher & Co. | 0,00 | −3,41 | 0,94 | −10,44 | 0,3113 | −0,0615 | |||
| EMR / Emerson Electric Co. | 0,01 | −1,97 | 0,93 | 19,28 | 0,3081 | 0,0309 | |||
| SYK / Stryker Corporation | 0,00 | −2,90 | 0,91 | 3,17 | 0,3010 | −0,0119 | |||
| LMT / Lockheed Martin Corporation | 0,00 | 0,88 | 0,4104 | 0,4104 | |||||
| LIN / Linde plc | 0,00 | 100,22 | 0,86 | 101,89 | 0,2825 | 0,1323 | |||
| CMI / Cummins Inc. | 0,00 | −1,52 | 0,85 | 2,90 | 0,2807 | −0,0119 | |||
| FICO / Fair Isaac Corporation | 0,00 | −4,78 | 0,84 | −5,64 | 0,2761 | −0,0377 | |||
| UNP / Union Pacific Corporation | 0,00 | −4,39 | 0,83 | −6,94 | 0,2746 | −0,0417 | |||
| BX / Blackstone Inc. | 0,01 | −2,38 | 0,83 | 4,54 | 0,2734 | −0,0073 | |||
| BK / The Bank of New York Mellon Corporation | 0,01 | −2,08 | 0,82 | 6,34 | 0,2711 | −0,0023 | |||
| CMG / Chipotle Mexican Grill, Inc. | 0,01 | −4,01 | 0,82 | 7,36 | 0,2696 | 0,0002 | |||
| TSCO / Tractor Supply Company | 0,02 | −3,27 | 0,82 | −7,38 | 0,2693 | −0,0425 | |||
| APH / Amphenol Corporation | 0,01 | −2,53 | 0,79 | 46,64 | 0,2594 | 0,0698 | |||
| ANET / Arista Networks Inc | 0,01 | 1,99 | 0,77 | 34,84 | 0,2553 | 0,0520 | |||
| SBUX / Starbucks Corporation | 0,01 | −3,20 | 0,77 | −9,59 | 0,3627 | 0,0600 | |||
| KO / The Coca-Cola Company | 0,01 | −1,26 | 0,76 | −2,45 | 0,3552 | 0,0803 | |||
| RTX / RTX Corporation | 0,01 | −60,27 | 0,76 | −56,24 | 0,2499 | −0,3621 | |||
| DOV / Dover Corporation | 0,00 | −1,85 | 0,76 | 2,44 | 0,2493 | −0,0119 | |||
| WMB / The Williams Companies, Inc. | 0,01 | 0,75 | 0,2472 | 0,2472 | |||||
| PEP / PepsiCo, Inc. | 0,01 | −2,06 | 0,74 | −13,84 | 0,3476 | 0,0434 | |||
| GILD / Gilead Sciences, Inc. | 0,01 | −2,69 | 0,74 | −3,77 | 0,3475 | 0,0751 | |||
| MCK / McKesson Corporation | 0,00 | −1,09 | 0,73 | 7,81 | 0,2414 | 0,0010 | |||
| PGR / The Progressive Corporation | 0,00 | −3,37 | 0,71 | −8,85 | 0,2345 | −0,0416 | |||
| MMM / 3M Company | 0,00 | −2,64 | 0,70 | 1,02 | 0,3262 | 0,0823 | |||
| T / AT&T Inc. | 0,02 | −9,80 | 0,65 | −7,63 | 0,3067 | 0,0559 | |||
| ULTA / Ulta Beauty, Inc. | 0,00 | −3,08 | 0,65 | 23,71 | 0,2135 | 0,0284 | |||
| MNST / Monster Beverage Corporation | 0,01 | −2,29 | 0,63 | 4,65 | 0,2078 | −0,0053 | |||
| MDLZ / Mondelez International, Inc. | 0,01 | −1,85 | 0,63 | −2,48 | 0,2073 | −0,0206 | |||
| AMT / American Tower Corporation | 0,00 | 0,62 | 0,2041 | 0,2041 | |||||
| COP / ConocoPhillips | 0,01 | 97,16 | 0,62 | 68,49 | 0,2885 | 0,1593 | |||
| TMO / Thermo Fisher Scientific Inc. | 0,00 | −3,53 | 0,61 | −21,45 | 0,2852 | 0,0114 | |||
| MRK / Merck & Co., Inc. | 0,01 | −2,43 | 0,60 | −13,92 | 0,1979 | −0,0488 | |||
| MCD / McDonald's Corporation | 0,00 | −1,20 | 0,60 | −7,56 | 0,1977 | −0,0318 | |||
| EVRG / Evergy, Inc. | 0,01 | −2,86 | 0,59 | −2,80 | 0,1946 | −0,0203 | |||
| MPC / Marathon Petroleum Corporation | 0,00 | 64,08 | 0,59 | 86,90 | 0,1931 | 0,0824 | |||
| IBHG / iShares Trust - iShares iBonds 2027 Term High Yield and Income ETF | 0,02 | 69,66 | 0,56 | 71,38 | 0,1840 | 0,0688 | |||
| UBER / Uber Technologies, Inc. | 0,01 | −2,66 | 0,55 | 24,60 | 0,1821 | 0,0254 | |||
| TJX / The TJX Companies, Inc. | 0,00 | −2,90 | 0,55 | −1,62 | 0,1803 | −0,0161 | |||
| SCHW / The Charles Schwab Corporation | 0,01 | −1,34 | 0,54 | 15,04 | 0,1792 | 0,0120 | |||
| C / Citigroup Inc. | 0,01 | −2,87 | 0,54 | 16,56 | 0,2541 | 0,0894 | |||
| TMUS / T-Mobile US, Inc. | 0,00 | −2,53 | 0,54 | −13,02 | 0,1787 | −0,0414 | |||
| WFC / Wells Fargo & Company | 0,01 | −2,16 | 0,54 | 9,11 | 0,2529 | 0,0781 | |||
| ALL / The Allstate Corporation | 0,00 | −2,10 | 0,53 | −4,81 | 0,2506 | 0,0519 | |||
| RSG / Republic Services, Inc. | 0,00 | −2,37 | 0,53 | −0,56 | 0,1743 | −0,0137 | |||
| EOG / EOG Resources, Inc. | 0,00 | 0,53 | 0,1732 | 0,1732 | |||||
| GEV / GE Vernova Inc. | 0,00 | 1,23 | 0,52 | 75,42 | 0,1720 | 0,0669 | |||
| WEC / WEC Energy Group, Inc. | 0,00 | −2,59 | 0,51 | −6,76 | 0,1682 | −0,0255 | |||
| MET / MetLife, Inc. | 0,01 | −3,05 | 0,50 | −2,72 | 0,1652 | −0,0173 | |||
| PFE / Pfizer Inc. | 0,02 | −9,04 | 0,50 | −13,04 | 0,2346 | 0,0311 | |||
| IBHH / iShares Trust - iShares iBonds 2028 Term High Yield and Income ETF | 0,02 | 61,38 | 0,50 | 64,03 | 0,1640 | 0,0567 | |||
| AEE / Ameren Corporation | 0,01 | 15,12 | 0,50 | 10,20 | 0,1639 | 0,0043 | |||
| EQIX / Equinix, Inc. | 0,00 | 77,43 | 0,49 | 72,98 | 0,1629 | 0,0620 | |||
| IBHF / iShares Trust - iShares iBonds 2026 Term High Yield and Income ETF | 0,02 | 50,06 | 0,47 | 50,32 | 0,1557 | 0,0444 | |||
| IBHE / iShares Trust - iShares iBonds 2025 Term High Yield and Income ETF | 0,02 | 59,31 | 0,44 | 59,57 | 0,1459 | 0,0477 | |||
| WELL / Welltower Inc. | 0,00 | 0,44 | 0,2061 | 0,2061 | |||||
| GIS / General Mills, Inc. | 0,01 | −2,33 | 0,43 | −15,23 | 0,1431 | −0,0383 | |||
| IBTH / iShares Trust - iShares iBonds Dec 2027 Term Treasury ETF | 0,02 | 8,19 | 0,43 | 8,61 | 0,1416 | 0,0017 | |||
| IBTG / iShares Trust - iShares iBonds Dec 2026 Term Treasury ETF | 0,02 | 8,22 | 0,43 | 8,10 | 0,1410 | 0,0012 | |||
| CFG / Citizens Financial Group, Inc. | 0,01 | −3,39 | 0,42 | 5,53 | 0,1386 | −0,0023 | |||
| MPWR / Monolithic Power Systems, Inc. | 0,00 | −1,88 | 0,42 | 23,60 | 0,1384 | 0,0184 | |||
| IBTJ / iShares Trust - iShares iBonds Dec 2029 Term Treasury ETF | 0,02 | 3,12 | 0,40 | 3,88 | 0,1326 | −0,0044 | |||
| IBTI / iShares Trust - iShares iBonds Dec 2028 Term Treasury ETF | 0,02 | 0,00 | 0,40 | 0,51 | 0,1315 | −0,0089 | |||
| SHW / The Sherwin-Williams Company | 0,00 | 0,40 | 0,1865 | 0,1865 | |||||
| DHR / Danaher Corporation | 0,00 | −2,85 | 0,40 | −6,37 | 0,1310 | −0,0191 | |||
| AXP / American Express Company | 0,00 | 0,00 | 0,39 | 18,60 | 0,1824 | 0,0663 | |||
| INVH / Invitation Homes Inc. | 0,01 | 0,38 | 0,1803 | 0,1803 | |||||
| ORCL / Oracle Corporation | 0,00 | 14,44 | 0,38 | 79,34 | 0,1262 | 0,0506 | |||
| WAT / Waters Corporation | 0,00 | −2,67 | 0,38 | −7,75 | 0,1257 | −0,0206 | |||
| GWW / W.W. Grainger, Inc. | 0,00 | −2,40 | 0,38 | 2,70 | 0,1255 | −0,0055 | |||
| CTAS / Cintas Corporation | 0,00 | −1,39 | 0,38 | 7,04 | 0,1254 | −0,0004 | |||
| CME / CME Group Inc. | 0,00 | −3,31 | 0,38 | 0,53 | 0,1775 | 0,0441 | |||
| IBDU / iShares Trust - iShares iBonds Dec 2029 Term Corporate ETF | 0,02 | 52,16 | 0,38 | 53,69 | 0,1238 | 0,0373 | |||
| GOOG / Alphabet Inc. | 0,00 | 0,72 | 0,37 | 14,42 | 0,1232 | 0,0076 | |||
| CEG / Constellation Energy Corporation | 0,00 | −2,12 | 0,37 | 56,72 | 0,1231 | 0,0388 | |||
| VZ / Verizon Communications Inc. | 0,01 | −8,81 | 0,37 | −13,10 | 0,1713 | 0,0227 | |||
| CSCO / Cisco Systems, Inc. | 0,01 | 11,16 | 0,36 | 25,09 | 0,1684 | 0,0667 | |||
| DE / Deere & Company | 0,00 | −20,39 | 0,36 | −13,83 | 0,1172 | −0,0285 | |||
| NEE / NextEra Energy, Inc. | 0,01 | 0,35 | 0,1162 | 0,1162 | |||||
| AFL / Aflac Incorporated | 0,00 | 0,00 | 0,34 | −5,26 | 0,1130 | −0,0148 | |||
| HSY / The Hershey Company | 0,00 | −3,79 | 0,34 | −6,58 | 0,1600 | 0,0306 | |||
| BKR / Baker Hughes Company | 0,01 | 0,33 | 0,1101 | 0,1101 | |||||
| AMAT / Applied Materials, Inc. | 0,00 | −0,98 | 0,33 | 24,72 | 0,1100 | 0,0155 | |||
| CPAY / Corpay, Inc. | 0,00 | −3,26 | 0,32 | −7,95 | 0,1070 | −0,0177 | |||
| WRB / W. R. Berkley Corporation | 0,00 | −3,58 | 0,32 | −0,62 | 0,1065 | −0,0082 | |||
| DVA / DaVita Inc. | 0,00 | −2,60 | 0,32 | −9,37 | 0,1054 | −0,0193 | |||
| FI / Fiserv, Inc. | 0,00 | −3,07 | 0,32 | −24,46 | 0,1041 | −0,0434 | |||
| IP / International Paper Company | 0,01 | 0,30 | 0,1426 | 0,1426 | |||||
| UPS / United Parcel Service, Inc. | 0,00 | −2,41 | 0,30 | −10,51 | 0,0985 | −0,0195 | |||
| HBT / HBT Financial, Inc. | 0,01 | 0,00 | 0,30 | 12,50 | 0,0983 | 0,0046 | |||
| HWM / Howmet Aerospace Inc. | 0,00 | −3,39 | 0,30 | 38,79 | 0,0981 | 0,0222 | |||
| SMCI / Super Micro Computer, Inc. | 0,01 | −4,00 | 0,30 | 37,50 | 0,1393 | 0,0628 | |||
| PLD / Prologis, Inc. | 0,00 | 0,30 | 0,0979 | 0,0979 | |||||
| ROST / Ross Stores, Inc. | 0,00 | −2,40 | 0,30 | −2,64 | 0,0975 | −0,0098 | |||
| PH / Parker-Hannifin Corporation | 0,00 | −1,41 | 0,29 | 13,51 | 0,0970 | 0,0052 | |||
| ECL / Ecolab Inc. | 0,00 | 0,29 | 0,1376 | 0,1376 | |||||
| VRSK / Verisk Analytics, Inc. | 0,00 | −1,58 | 0,29 | 3,20 | 0,0957 | −0,0040 | |||
| ZBRA / Zebra Technologies Corporation | 0,00 | −2,22 | 0,29 | 6,74 | 0,0941 | −0,0005 | |||
| ACN / Accenture plc | 0,00 | 3,34 | 0,28 | −0,72 | 0,0914 | −0,0076 | |||
| LEN / Lennar Corporation | 0,00 | −5,52 | 0,28 | −8,91 | 0,0911 | −0,0162 | |||
| CBSH / Commerce Bancshares, Inc. | 0,00 | 0,00 | 0,27 | 0,00 | 0,0903 | −0,0066 | |||
| PSA / Public Storage | 0,00 | −44,12 | 0,27 | −45,18 | 0,0901 | −0,0863 | |||
| HCA / HCA Healthcare, Inc. | 0,00 | −2,66 | 0,27 | 7,72 | 0,0877 | 0,0005 | |||
| CTVA / Corteva, Inc. | 0,00 | 0,26 | 0,0853 | 0,0853 | |||||
| NKE / NIKE, Inc. | 0,00 | −2,43 | 0,26 | 8,94 | 0,1203 | 0,0372 | |||
| SPG / Simon Property Group, Inc. | 0,00 | 0,25 | 0,0818 | 0,0818 | |||||
| CI / The Cigna Group | 0,00 | −3,23 | 0,25 | −2,76 | 0,0816 | −0,0084 | |||
| NEM / Newmont Corporation | 0,00 | 0,25 | 0,0816 | 0,0816 | |||||
| BLK / BlackRock, Inc. | 0,00 | 0,00 | 0,24 | 11,32 | 0,1106 | 0,0353 | |||
| AXON / Axon Enterprise, Inc. | 0,00 | −51,29 | 0,24 | −23,20 | 0,1102 | 0,0017 | |||
| VST / Vistra Corp. | 0,00 | 0,23 | 0,1083 | 0,1083 | |||||
| LVS / Las Vegas Sands Corp. | 0,01 | −2,33 | 0,22 | 10,34 | 0,0739 | 0,0018 | |||
| SO / The Southern Company | 0,00 | −31,12 | 0,21 | −31,41 | 0,0709 | −0,0396 | |||
| O / Realty Income Corporation | 0,00 | −50,80 | 0,21 | −51,04 | 0,0699 | −0,0836 | |||
| COF / Capital One Financial Corporation | 0,00 | 0,21 | 0,0679 | 0,0679 | |||||
| UAL / United Airlines Holdings, Inc. | 0,00 | 0,20 | 0,0675 | 0,0675 | |||||
| FCX / Freeport-McMoRan Inc. | 0,00 | −62,21 | 0,20 | −56,90 | 0,0662 | −0,0979 | |||
| SLB / Schlumberger Limited | 0,00 | −100,00 | 0,00 | 0,0000 | |||||
| CF / CF Industries Holdings, Inc. | 0,00 | −100,00 | 0,00 | 0,0000 | |||||
| HST / Host Hotels & Resorts, Inc. | 0,00 | −100,00 | 0,00 | 0,0000 | |||||
| NUE / Nucor Corporation | 0,00 | −100,00 | 0,00 | 0,0000 | |||||
| IRM / Iron Mountain Incorporated | 0,00 | −100,00 | 0,00 | 0,0000 | |||||
| APD / Air Products and Chemicals, Inc. | 0,00 | −100,00 | 0,00 | 0,0000 | |||||
| MLM / Martin Marietta Materials, Inc. | 0,00 | −100,00 | 0,00 | 0,0000 | |||||
| VICI / VICI Properties Inc. | 0,00 | −100,00 | 0,00 | 0,0000 | |||||
| NRG / NRG Energy, Inc. | 0,00 | −100,00 | 0,00 | 0,0000 | |||||
| CBRE / CBRE Group, Inc. | 0,00 | −100,00 | 0,00 | 0,0000 | |||||
| FANG / Diamondback Energy, Inc. | 0,00 | −100,00 | 0,00 | 0,0000 | |||||
| LNT / Alliant Energy Corporation | 0,00 | −100,00 | 0,00 | 0,0000 | |||||
| VLO / Valero Energy Corporation | 0,00 | −100,00 | 0,00 | 0,0000 |