Grundläggande statistik
| Institutionella ägare | 128 total, 128 long only, 0 short only, 0 long/short - change of 14,29% MRQ |
| Genomsnittlig portföljallokering | 1.2236 % - change of −14,64% MRQ |
| Institutionella aktier (lång) | 13 982 996 (ex 13D/G) - change of 1,23MM shares 9,66% MRQ |
| Institutionellt värde (lång) | $ 694 968 USD ($1000) |
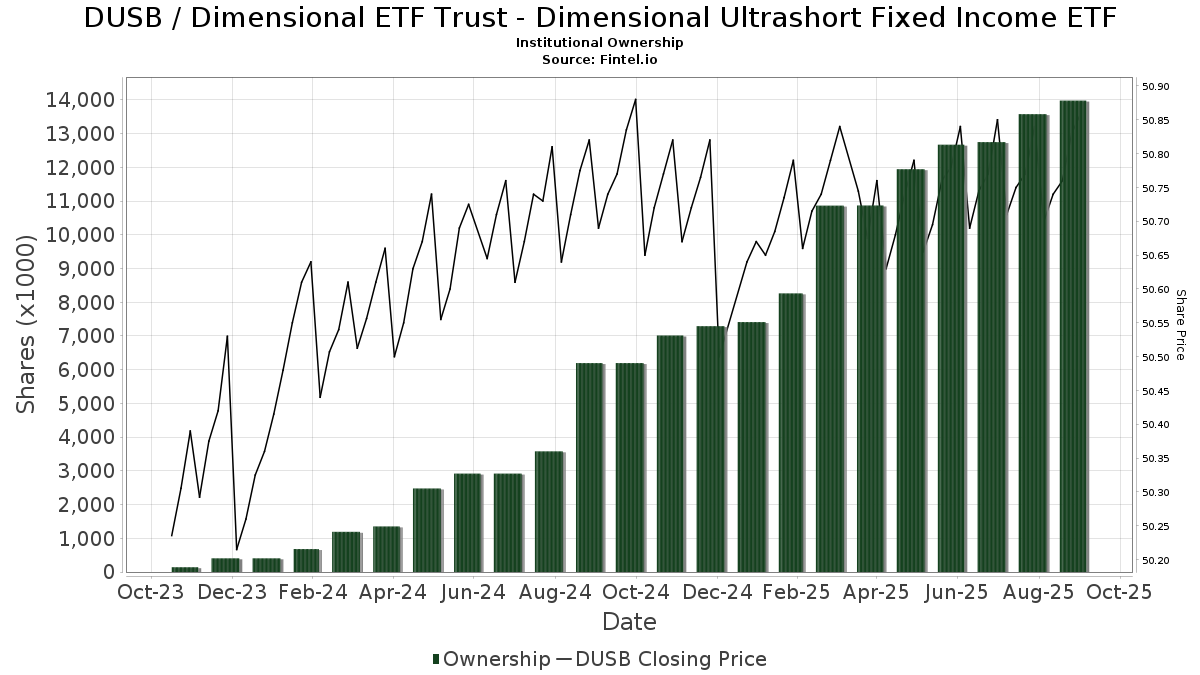
Institutionellt ägande och aktieägare
Dimensional ETF Trust - Dimensional Ultrashort Fixed Income ETF (US:DUSB) har 128 Institutionella ägare och aktieägare som har lämnat in 13D/G- eller 13F-formulär till Securities Exchange Commission (SEC). Dessa institut innehar totalt 13,982,996 aktier. Största aktieägare inkluderar Planning Center, Inc., Prudent Man Investment Management, Inc., Market Street Wealth Management Advisors Llc, Root Financial Partners, LLC, SC&H Financial Advisors, Inc., Sterling Wealth Management, Inc., Chicago Partners Investment Group LLC, SJS Investment Consulting Inc., DiNuzzo Private Wealth, Inc., and American Capital Advisory, LLC .
Dimensional ETF Trust - Dimensional Ultrashort Fixed Income ETF (ARCA:DUSB) Institutionell ägarstruktur visar institutioners och fonders nuvarande positioner i företaget, samt de senaste förändringarna i positionernas storlek. Större aktieägare kan vara enskilda investerare, fonder, hedgefonder eller institutioner. Bilaga 13D visar att investeraren äger (eller ägde) mer än 5% av företaget och avser (eller avsåg) att aktivt eftersträva en förändring av affärsstrategin. Schedule 13G indikerar en passiv investering på över 5%.
The share price as of September 10, 2025 is 50,83 / share. Previously, on September 11, 2024, the share price was 50,82 / share. This represents an increase of 0,02% over that period.
Fondsentimentets poäng
Fondsentimentet poängen(fka Ägarackumulation-poäng) visar vilka aktier som är mest köpta av fonder. Det är resultatet av en sofistikerad kvantitativ flerfaktormodell som identifierar företag med de högsta nivåerna av institutionell ackumulering. Poängsättningsmodellen använder en kombination av den totala ökningen av redovisade ägare, förändringarna i portföljallokeringarna för dessa ägare och andra mått. Siffran sträcker sig från 0 till 100, där högre siffror indikerar en högre nivå av ackumulering i förhållande till sina konkurrenter, och 50 är genomsnittet.
Uppdateringsfrekvens: Dagligen
Se Ownership Explorer, som innehåller en lista över de högst rankade företagen.
Institutionell sälj/köp-kvot
Förutom att rapportera vanliga eget kapital- och skuldemissioner måste institutioner med mer än 100MM tillgångar under förvaltning också avslöja sina innehav av sälj- och köpoptioner. Eftersom säljoptioner i allmänhet indikerar ett negativt sentiment och köpoptioner indikerar ett positivt sentiment, kan vi få en uppfattning om det övergripande institutionella sentimentet genom att plotta förhållandet mellan säljoptioner och köpoptioner. Diagrammet till höger visar det historiska förhållandet mellan sälj- och köpoptioner för detta instrument.
Genom att använda sälj/köp-kvoten som en indikator på aktieägarnas sentiment undviker man en av de största bristerna med att använda det totala institutionella ägandet, nämligen att en betydande del av de förvaltade tillgångarna investeras passivt för att följa index. Passivt förvaltade fonder köper vanligtvis inte optioner, så indikatorn för sälj/köp-kvoten ger en bättre bild av stämningen i aktivt förvaltade fonder.
13F- och NPORT-arkiveringar
Detaljer om 13F-arkiveringar är gratis. Detaljer om NP-arkiveringar kräver ett premiummedlemskap. Gröna rader indikerar nya positioner. Röda rader indikerar stängda positioner. Klicka på länk symbolen för att se hela transaktionshistoriken.
Uppgradera
för att låsa upp premiumdata och exportera till Excel ![]() .
.
| Fil Datum | Källa | Investerare | Typ | Genomsnittligt pris (beräknat) |
Aktier | Δ Aktier (%) |
Rapporterat värde (1000 USD) |
Δ Värde (%) |
Portföljallokering (%) |
|
|---|---|---|---|---|---|---|---|---|---|---|
| 2025-07-10 | 13F | Wealth Enhancement Advisory Services, Llc | 69 114 | 0,66 | 3 509 | 0,72 | ||||
| 2025-07-11 | 13F | Wolfstich Capital, LLC | 0 | −100,00 | 0 | |||||
| 2025-08-11 | 13F | VSM Wealth Advisory, LLC | 4 841 | −4,29 | 246 | −4,30 | ||||
| 2025-08-11 | 13F | TAGStone Capital, Inc. | 225 384 | 337,93 | 11 450 | 572 350,00 | ||||
| 2025-09-04 | 13F/A | Advisor Group Holdings, Inc. | 2 200 | 93,15 | 112 | 94,74 | ||||
| 2025-07-30 | 13F | Phillips Financial Management, Llc | 291 447 | −1,10 | 14 791 | −1,06 | ||||
| 2025-07-25 | 13F | Index Fund Advisors, Inc. | 45 125 | 206,04 | 2 290 | 206,15 | ||||
| 2025-07-09 | 13F | Shore Point Advisors, LLC | 121 313 | 4,71 | 6 157 | 4,75 | ||||
| 2025-07-23 | 13F | First Financial Group Corp | 5 325 | 3,30 | 270 | −1,82 | ||||
| 2025-08-08 | 13F | Pnc Financial Services Group, Inc. | 0 | −100,00 | 0 | |||||
| 2025-07-17 | 13F | SC&H Financial Advisors, Inc. | 562 502 | 28,52 | 28 547 | 28,57 | ||||
| 2025-07-11 | 13F | Quantum Financial Advisors, LLC | 68 986 | 3 501 | ||||||
| 2025-07-10 | 13F | Baker Tilly Financial, Llc | 4 047 | 1,10 | 205 | 0,99 | ||||
| 2025-07-31 | 13F | Buckingham Strategic Partners | 64 431 | 13,90 | 3 270 | 13,94 | ||||
| 2025-07-28 | 13F | Wealthspan Partners, Llc | 178 909 | 27,28 | 9 080 | 27,34 | ||||
| 2025-08-11 | 13F | Babb Wealth Advisors LLC | 117 865 | −2,48 | 5 982 | −2,45 | ||||
| 2025-07-25 | 13F | Cwm, Llc | 52 | 0 | ||||||
| 2025-07-10 | 13F | Strathmore Capital Advisors, Inc. | 12 522 | −11,13 | 636 | −10,81 | ||||
| 2025-07-23 | 13F | Pillar Financial Advisors, LLC | 222 682 | 6,36 | 11 301 | 6,40 | ||||
| 2025-08-06 | 13F | Aspect Partners, LLC | 0 | −100,00 | 0 | |||||
| 2025-08-14 | 13F | Essential Planning, LLC. | 4 121 | 0,88 | 209 | 0,97 | ||||
| 2025-07-17 | 13F | Mattern Wealth Management LLC | 130 489 | 99,11 | 6 622 | 99,22 | ||||
| 2025-07-11 | 13F | Farther Finance Advisors, LLC | 9 935 | 63,78 | 504 | 64,17 | ||||
| 2025-07-18 | 13F | PBMares Wealth Management LLC | 20 557 | −54,08 | 1 043 | −54,05 | ||||
| 2025-08-15 | 13F | Kestra Advisory Services, LLC | 98 732 | 22,31 | 5 011 | 22,34 | ||||
| 2025-04-16 | 13F | Lam Group, Inc. | 0 | −100,00 | 0 | |||||
| 2025-07-14 | 13F | Maryland Capital Advisors Inc. | 67 | 34,00 | 3 | 50,00 | ||||
| 2025-07-21 | 13F | Family CFO Inc | 15 460 | 63,03 | 785 | 62,99 | ||||
| 2025-07-25 | 13F | Apollon Wealth Management, LLC | 67 000 | 0,75 | 3 400 | 0,80 | ||||
| 2025-08-12 | 13F | Proequities, Inc. | 0 | 0 | ||||||
| 2025-07-17 | 13F | Applied Capital LLC | 98 600 | 15,92 | 5 004 | 15,94 | ||||
| 2025-07-17 | 13F | XY Planning Network, Inc. | 34 825 | 160,86 | 1 767 | 161,00 | ||||
| 2025-07-16 | 13F | Blue Oak Capital, LLC | 22 678 | −34,12 | 1 151 | −34,14 | ||||
| 2025-08-14 | 13F | Jane Street Group, Llc | 99 840 | 292,28 | 5 067 | 292,41 | ||||
| 2025-07-09 | 13F | Market Street Wealth Management Advisors Llc | 673 636 | −20,55 | 34 187 | −20,51 | ||||
| 2025-07-15 | 13F | Hartmann Taylor Wealth Management, LLC | 14 290 | −4,03 | 725 | −3,97 | ||||
| 2025-08-08 | 13F | Sittner & Nelson, Llc | 67 | −41,74 | 3 | −40,00 | ||||
| 2025-08-14 | 13F | Citadel Advisors Llc | 0 | −100,00 | 0 | |||||
| 2025-08-14 | 13F | Betterment LLC | 35 761 | 29,85 | 2 | 0,00 | ||||
| 2025-08-12 | 13F | LPL Financial LLC | 21 348 | 294,97 | 1 083 | 295,26 | ||||
| 2025-07-17 | 13F | Porter White Investment Advisors, Inc. | 22 745 | 4,09 | 1 154 | 4,15 | ||||
| 2025-07-15 | 13F | Maseco Llp | 25 140 | 1 275 | ||||||
| 2025-08-15 | 13F | Equitable Holdings, Inc. | 5 000 | 254 | ||||||
| 2025-08-12 | 13F | Legacy Financial Group, Inc. | 4 653 | −23,95 | 236 | −23,87 | ||||
| 2025-08-13 | 13F | Capital Analysts, Inc. | 305 | 0,99 | 0 | |||||
| 2025-07-16 | 13F | Plancorp, LLC | 0 | −100,00 | 0 | |||||
| 2025-08-13 | 13F | Van Hulzen Asset Management, LLC | 0 | −100,00 | 0 | |||||
| 2025-08-13 | 13F | Flow Traders U.s. Llc | 0 | −100,00 | 0 | |||||
| 2025-08-11 | 13F | HighTower Advisors, LLC | 22 617 | −4,14 | 1 148 | −4,10 | ||||
| 2025-08-12 | 13F | Jpmorgan Chase & Co | 796 | −91,01 | 40 | −91,07 | ||||
| 2025-08-08 | 13F | Creative Planning | 67 651 | 113,24 | 3 433 | 113,36 | ||||
| 2025-07-30 | 13F | Rehmann Capital Advisory Group | 27 860 | −0,11 | 1 414 | −0,07 | ||||
| 2025-07-14 | 13F | Financial Harvest, LLC | 51 289 | 2 603 | ||||||
| 2025-07-15 | 13F | SJS Investment Consulting Inc. | 414 416 | 8,87 | 21 032 | 8,91 | ||||
| 2025-07-08 | 13F | ShankerValleau Wealth Advisors, Inc. | 17 254 | −54,18 | 876 | −54,19 | ||||
| 2025-07-22 | 13F | Firethorn Wealth Partners, Llc | 4 228 | 215 | ||||||
| 2025-08-14 | 13F | Navigoe, LLC | 40 660 | −5,67 | 2 | 0,00 | ||||
| 2025-07-16 | 13F | Leading Edge Financial Planning LLC | 103 871 | 9,81 | 5 271 | 9,86 | ||||
| 2025-07-25 | 13F | LRI Investments, LLC | 11 735 | 0,00 | 596 | 0,00 | ||||
| 2025-07-29 | 13F | AssuredPartners Investment Advisors, LLC | 51 027 | 2 590 | ||||||
| 2025-07-18 | 13F | Fmb Wealth Management | 53 337 | 49,47 | 2 707 | 49,50 | ||||
| 2025-08-13 | 13F | Parkworth Wealth Management, Inc. | 26 692 | −32,09 | 1 355 | −32,06 | ||||
| 2025-07-29 | 13F | Financial Symmetry Inc | 73 025 | 23,28 | 3 706 | 23,37 | ||||
| 2025-07-29 | 13F | Fundamentun, Llc | 26 519 | 1 346 | ||||||
| 2025-07-09 | 13F | Hiley Hunt Wealth Management | 168 610 | 1,51 | 8 565 | 1,66 | ||||
| 2025-07-25 | 13F | Ruedi Wealth Management, Inc. | 125 447 | 1,95 | 6 366 | 2,00 | ||||
| 2025-07-16 | 13F | Vestia Personal Wealth Advisors | 10 883 | 148,07 | 552 | 148,65 | ||||
| 2025-08-01 | 13F | Envestnet Asset Management Inc | 167 719 | 7,97 | 8 512 | 8,01 | ||||
| 2025-05-12 | 13F | Hantz Financial Services, Inc. | 0 | −100,00 | 0 | |||||
| 2025-07-15 | 13F | Great Oak Capital Partners, Llc | 62 239 | −3,23 | 3 162 | −2,95 | ||||
| 2025-07-17 | 13F | Elser Financial Planning, Inc | 9 697 | 493 | ||||||
| 2025-08-06 | 13F | Legacy Wealth Managment, LLC/ID | 1 813 | 0,00 | 92 | 1,10 | ||||
| 2025-08-06 | 13F | Commonwealth Equity Services, Llc | 82 345 | 9,22 | 4 | 33,33 | ||||
| 2025-07-29 | 13F | Schubert & Co | 16 825 | 1,09 | 854 | 1,07 | ||||
| 2025-08-01 | 13F | Red Lighthouse Investment Management, Llc | 12 446 | 632 | ||||||
| 2025-08-14 | 13F | Mariner, LLC | 175 817 | 93,05 | 8 923 | 93,12 | ||||
| 2025-05-06 | 13F | AE Wealth Management LLC | 0 | −100,00 | 0 | |||||
| 2025-07-16 | 13F | Strategic Investment Solutions, Inc. /IL | 147 868 | 2,21 | 7 490 | 2,07 | ||||
| 2025-08-06 | 13F | Legacy Investment Solutions, LLC | 1 813 | 92 | ||||||
| 2025-07-22 | 13F | Wealthcare Advisory Partners LLC | 5 746 | 292 | ||||||
| 2025-07-21 | 13F | Onyx Financial Advisors, LLC | 158 674 | 3,82 | 8 053 | 3,86 | ||||
| 2025-07-30 | 13F | Forum Financial Management, LP | 16 855 | 2,18 | 855 | 2,27 | ||||
| 2025-07-31 | 13F | Core Wealth Management, Inc. | 23 283 | 2,58 | 1 182 | 2,61 | ||||
| 2025-08-11 | 13F | Aptus Capital Advisors, LLC | 1 962 | 0,05 | 100 | 0,00 | ||||
| 2025-07-18 | 13F | Pure Financial Advisors, Inc. | 10 754 | −0,38 | 546 | −0,37 | ||||
| 2025-08-08 | 13F | Altiora Financial Group, LLC | 209 326 | −3,18 | 10 623 | −3,15 | ||||
| 2025-07-31 | 13F | Curio Wealth, Llc | 10 288 | 342 833,33 | 522 | 0,38 | ||||
| 2025-07-25 | 13F | Stephens Consulting, LLC | 185 | 9 | ||||||
| 2025-07-30 | 13F | Clune & Associates, Ltd. | 87 981 | −3,98 | 4 465 | −3,94 | ||||
| 2025-07-31 | 13F | Cambridge Investment Research Advisors, Inc. | 31 138 | 52,12 | 2 | 0,00 | ||||
| 2025-08-07 | 13F | Prudent Man Investment Management, Inc. | 1 134 166 | −0,30 | 57 377 | −0,30 | ||||
| 2025-07-15 | 13F | Evanson Asset Management, LLC | 6 471 | 0,83 | 328 | 0,92 | ||||
| 2025-08-01 | 13F | McCarthy Grittinger Financial Group, LLC | 369 | −73,40 | 19 | −74,29 | ||||
| 2025-07-09 | 13F | Dynamic Advisor Solutions LLC | 5 947 | 302 | ||||||
| 2025-07-08 | 13F | Apella Capital, LLC | 14 782 | 0,00 | 751 | 0,13 | ||||
| 2025-07-17 | 13F | Willow Creek Wealth Management Inc. | 9 353 | 63,34 | 475 | 63,45 | ||||
| 2025-05-12 | 13F | Cahill Wealth Management, LLC | 9 933 | 504 | ||||||
| 2025-08-14 | 13F | Financial Engines Advisors L.L.C. | 14 674 | 745 | ||||||
| 2025-07-25 | 13F | Concord Wealth Partners | 68 703 | 1,26 | 3 487 | 1,31 | ||||
| 2025-08-13 | 13F | Beacon Pointe Advisors, LLC | 18 594 | 41,35 | 944 | 41,38 | ||||
| 2025-07-17 | 13F | DiNuzzo Private Wealth, Inc. | 404 800 | 4,14 | 20 544 | 4,18 | ||||
| 2025-08-13 | 13F | Cary Street Partners Financial Llc | 29 711 | 20,39 | 1 508 | 20,46 | ||||
| 2025-08-05 | 13F | Dravo Bay Llc | 85 492 | −8,09 | 4 411 | −6,51 | ||||
| 2025-08-08 | 13F | Gts Securities Llc | 4 768 | 242 | ||||||
| 2025-08-06 | 13F | Savant Capital, LLC | 298 810 | 5,79 | 15 165 | 5,83 | ||||
| 2025-08-14 | 13F | Acorn Wealth Advisors, LLC | 10 964 | −20,61 | 556 | −20,57 | ||||
| 2025-07-16 | 13F | Meredith Wealth Planning | 25 794 | 33,03 | 1 309 | 33,16 | ||||
| 2025-07-29 | 13F | Master's Wealth Management Inc. | 138 562 | 4,27 | 7 032 | 4,32 | ||||
| 2025-07-29 | 13F | Chicago Partners Investment Group LLC | 447 866 | 12,43 | 22 711 | 12,37 | ||||
| 2025-08-08 | 13F | Avantax Advisory Services, Inc. | 4 797 | 6,15 | 243 | 6,11 | ||||
| 2025-08-14 | 13F | Comerica Bank | 7 486 | 1,99 | 380 | 1,88 | ||||
| 2025-07-30 | 13F | Studio Investment Management Llc | 16 477 | 25,67 | 836 | 25,71 | ||||
| 2025-08-04 | 13F | Arkadios Wealth Advisors | 113 695 | −31,71 | 5 770 | −31,68 | ||||
| 2025-08-12 | 13F | Pathstone Holdings, LLC | 58 196 | 17,48 | 2 953 | 17,56 | ||||
| 2025-07-24 | 13F | Strengthening Families & Communities, LLC | 1 332 | 1,06 | 68 | 1,52 | ||||
| 2025-07-28 | 13F | Moran Wealth Management, LLC | 185 413 | 9 410 | ||||||
| 2025-08-04 | 13F | Live Oak Private Wealth LLC | 23 710 | 88,50 | 1 203 | 88,56 | ||||
| 2025-08-14 | 13F | Destination Wealth Management | 4 638 | 235 | ||||||
| 2025-05-13 | 13F | UBS Group AG | 0 | −100,00 | 0 | |||||
| 2025-07-25 | 13F | Concord Asset Management, LLC/VA | 68 703 | 3 487 | ||||||
| 2025-08-14 | 13F | Sterling Wealth Management, Inc. | 460 476 | −7,74 | 23 369 | −7,45 | ||||
| 2025-07-31 | 13F | Warburton Capital Management, LLC | 27 466 | −72,46 | 1 | −80,00 | ||||
| 2025-07-30 | 13F | Mills Wealth Advisors LLC | 16 236 | −25,27 | 824 | −25,32 | ||||
| 2025-08-05 | 13F | American Capital Advisory, LLC | 322 284 | 6,91 | 16 356 | 6,94 | ||||
| 2025-04-17 | 13F | BCU Wealth Advisors, LLC | 0 | −100,00 | 0 | |||||
| 2025-07-28 | 13F | Kiker Wealth Management, LLC | 5 900 | 299 | ||||||
| 2025-08-07 | 13F | Alpha Financial Advisors, LLC | 5 230 | 0,00 | 265 | 0,00 | ||||
| 2025-08-11 | 13F | Private Advisor Group, LLC | 7 993 | 0,85 | 406 | 0,75 | ||||
| 2025-08-11 | 13F | Root Financial Partners, LLC | 608 625 | 14,83 | 30 888 | 14,88 | ||||
| 2025-08-13 | 13F | Vance Wealth, Inc. | 19 284 | −8,06 | 979 | −8,08 | ||||
| 2025-07-16 | 13F | Bright Financial Advisors, Inc. | 67 959 | 13,16 | 3 449 | 13,20 | ||||
| 2025-07-31 | 13F | Planning Center, Inc. | 2 929 200 | 4,56 | 148 657 | 4,60 | ||||
| 2025-07-23 | 13F | Prime Capital Investment Advisors, LLC | 7 069 | 0,00 | 359 | 0,00 | ||||
| 2025-08-14 | 13F | Main Street Financial Solutions, LLC | 7 102 | 360 | ||||||
| 2025-08-12 | 13F | Coston, McIsaac & Partners | 68 635 | 16,16 | 3 | 50,00 | ||||
| 2025-07-07 | 13F | Kings Path Partners LLC | 33 744 | −24,00 | 1 712 | −23,98 | ||||
| 2025-07-10 | 13F | White Wing Wealth Management | 11 421 | −28,93 | 580 | −28,96 | ||||
| 2025-08-06 | 13F | New Dimensions Wealth Management, LLC | 183 205 | 3,24 | 9 327 | 3,60 | ||||
| 2025-07-10 | 13F | Cypress Point Wealth Management, LLC | 8 634 | 0,64 | 438 | 0,69 | ||||
| 2025-05-06 | 13F | Proficio Capital Partners LLC | 0 | −100,00 | 0 | −100,00 | ||||
| 2025-08-01 | 13F | PCA Investment Advisory Services Inc. | 42 497 | 4,93 | 2 157 | 4,97 | ||||
| 2025-08-14 | 13F | Bank Of America Corp /de/ | 1 145 | 58 |