Grundläggande statistik
| Institutionella ägare | 141 total, 141 long only, 0 short only, 0 long/short - change of 0,71% MRQ |
| Genomsnittlig portföljallokering | 1.1043 % - change of −5,37% MRQ |
| Institutionella aktier (lång) | 19 417 021 (ex 13D/G) - change of 0,37MM shares 1,95% MRQ |
| Institutionellt värde (lång) | $ 760 854 USD ($1000) |
Institutionellt ägande och aktieägare
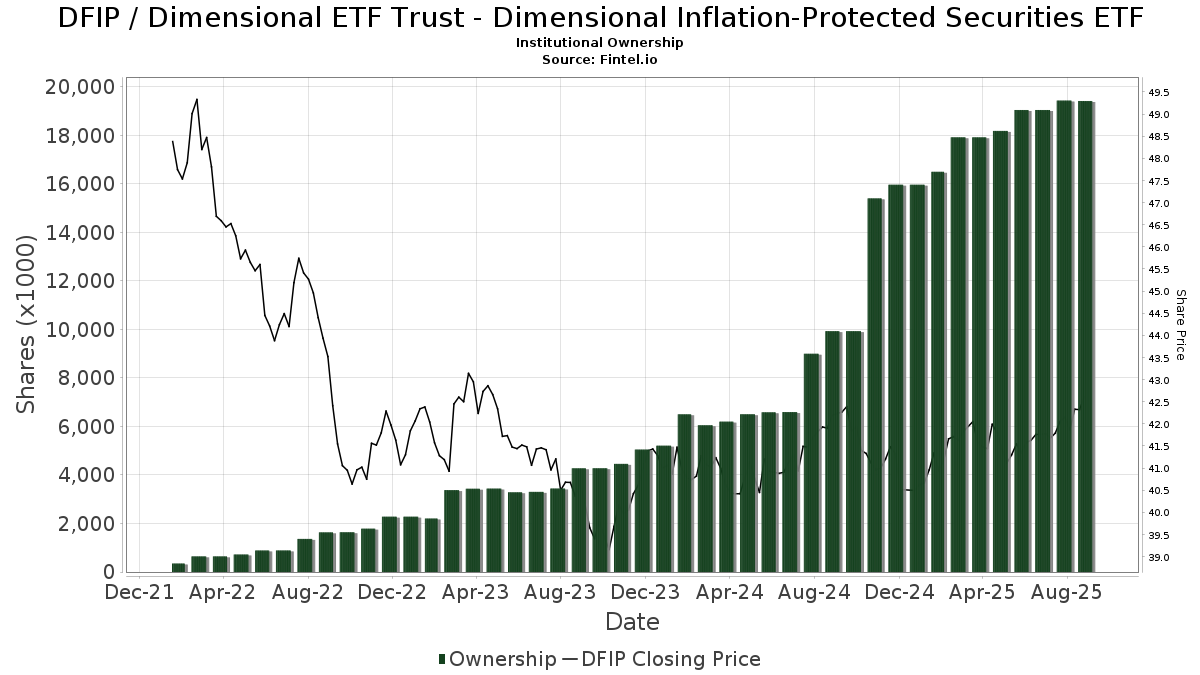
Dimensional ETF Trust - Dimensional Inflation-Protected Securities ETF (US:DFIP) har 141 Institutionella ägare och aktieägare som har lämnat in 13D/G- eller 13F-formulär till Securities Exchange Commission (SEC). Dessa institut innehar totalt 19,417,021 aktier. Största aktieägare inkluderar Matson Money. Inc., FMFIX - Free Market Fixed Income Fund Institutional Class, Heirloom Wealth Management, Planning Center, Inc., Hill Investment Group Partners, LLC, Hemington Wealth Management, Geometric Wealth Advisors, CPA Asset Management LLC, Rather & Kittrell, Inc., and Pinney & Scofield, Inc. .
Dimensional ETF Trust - Dimensional Inflation-Protected Securities ETF (ARCA:DFIP) Institutionell ägarstruktur visar institutioners och fonders nuvarande positioner i företaget, samt de senaste förändringarna i positionernas storlek. Större aktieägare kan vara enskilda investerare, fonder, hedgefonder eller institutioner. Bilaga 13D visar att investeraren äger (eller ägde) mer än 5% av företaget och avser (eller avsåg) att aktivt eftersträva en förändring av affärsstrategin. Schedule 13G indikerar en passiv investering på över 5%.
The share price as of September 12, 2025 is 42,59 / share. Previously, on September 13, 2024, the share price was 42,33 / share. This represents an increase of 0,62% over that period.
Fondsentimentets poäng
Fondsentimentet poängen(fka Ägarackumulation-poäng) visar vilka aktier som är mest köpta av fonder. Det är resultatet av en sofistikerad kvantitativ flerfaktormodell som identifierar företag med de högsta nivåerna av institutionell ackumulering. Poängsättningsmodellen använder en kombination av den totala ökningen av redovisade ägare, förändringarna i portföljallokeringarna för dessa ägare och andra mått. Siffran sträcker sig från 0 till 100, där högre siffror indikerar en högre nivå av ackumulering i förhållande till sina konkurrenter, och 50 är genomsnittet.
Uppdateringsfrekvens: Dagligen
Se Ownership Explorer, som innehåller en lista över de högst rankade företagen.
Institutionell sälj/köp-kvot
Förutom att rapportera vanliga eget kapital- och skuldemissioner måste institutioner med mer än 100MM tillgångar under förvaltning också avslöja sina innehav av sälj- och köpoptioner. Eftersom säljoptioner i allmänhet indikerar ett negativt sentiment och köpoptioner indikerar ett positivt sentiment, kan vi få en uppfattning om det övergripande institutionella sentimentet genom att plotta förhållandet mellan säljoptioner och köpoptioner. Diagrammet till höger visar det historiska förhållandet mellan sälj- och köpoptioner för detta instrument.
Genom att använda sälj/köp-kvoten som en indikator på aktieägarnas sentiment undviker man en av de största bristerna med att använda det totala institutionella ägandet, nämligen att en betydande del av de förvaltade tillgångarna investeras passivt för att följa index. Passivt förvaltade fonder köper vanligtvis inte optioner, så indikatorn för sälj/köp-kvoten ger en bättre bild av stämningen i aktivt förvaltade fonder.
13F- och NPORT-arkiveringar
Detaljer om 13F-arkiveringar är gratis. Detaljer om NP-arkiveringar kräver ett premiummedlemskap. Gröna rader indikerar nya positioner. Röda rader indikerar stängda positioner. Klicka på länk symbolen för att se hela transaktionshistoriken.
Uppgradera
för att låsa upp premiumdata och exportera till Excel ![]() .
.
| Fil Datum | Källa | Investerare | Typ | Genomsnittligt pris (beräknat) |
Aktier | Δ Aktier (%) |
Rapporterat värde (1000 USD) |
Δ Värde (%) |
Portföljallokering (%) |
|
|---|---|---|---|---|---|---|---|---|---|---|
| 2025-07-16 | 13F | Tru Independence Asset Management 2, Llc | 20 023 | −49,31 | 837 | −49,67 | ||||
| 2025-07-29 | NP | FMVFX - Matson Money Fixed Income VI Portfolio Institutional Class | 29 452 | −3,44 | 1 224 | −4,30 | ||||
| 2025-07-22 | 13F | Awm Capital, Llc | 78 517 | 1,26 | 3 283 | 0,52 | ||||
| 2025-08-13 | 13F | Flow Traders U.s. Llc | 0 | −100,00 | 0 | |||||
| 2025-07-18 | 13F | PBMares Wealth Management LLC | 30 290 | −2,06 | 1 266 | −2,76 | ||||
| 2025-08-05 | 13F | Centennial Bank/AR/ | 22 269 | −2,90 | 931 | −3,52 | ||||
| 2025-07-09 | 13F | Krilogy Financial LLC | 104 458 | 1,64 | 4 367 | 0,92 | ||||
| 2025-07-11 | 13F | Farther Finance Advisors, LLC | 3 107 | 130 | ||||||
| 2025-07-14 | 13F | Shearwater Capital LLC | 39 773 | 1,01 | 1 663 | 0,24 | ||||
| 2025-07-11 | 13F | Physician Wealth Solutions Inc. | 350 435 | −0,28 | 14 652 | −0,99 | ||||
| 2025-07-30 | 13F | Phillips Financial Management, Llc | 2 601 | 0,00 | 109 | −0,92 | ||||
| 2025-07-31 | 13F | Buckingham Strategic Partners | 31 111 | 8,16 | 1 301 | 7,35 | ||||
| 2025-08-06 | 13F | Vestmark Advisory Solutions, Inc. | 19 798 | 146,83 | 828 | 145,40 | ||||
| 2025-07-09 | 13F | HFG Wealth Management, LLC | 10 920 | 2,30 | 460 | 6,25 | ||||
| 2025-07-23 | 13F | First Financial Group Corp | 6 220 | −1,19 | 260 | −1,89 | ||||
| 2025-07-17 | 13F | SC&H Financial Advisors, Inc. | 7 775 | 1,12 | 325 | 0,62 | ||||
| 2025-08-07 | 13F | Allworth Financial LP | 26 199 | 0,88 | 1 095 | 1,20 | ||||
| 2025-08-13 | 13F | SageView Advisory Group, LLC | 37 743 | 0,40 | 1 575 | −0,57 | ||||
| 2025-05-16 | 13F | Coppell Advisory Solutions LLC | 0 | −100,00 | 0 | |||||
| 2025-07-15 | 13F | Vestment Financial LLC | 130 432 | 5,65 | 5 447 | 4,47 | ||||
| 2025-08-14 | 13F | GWM Advisors LLC | 895 | −97,16 | 37 | −97,21 | ||||
| 2025-07-15 | 13F | Level Financial Advisors, Inc. | 199 579 | 6,58 | 8 344 | 5,82 | ||||
| 2025-08-14 | 13F | Goldman Sachs Group Inc | 118 619 | 0,00 | 4 959 | −0,72 | ||||
| 2025-08-13 | 13F | Jones Financial Companies Lllp | 2 550 | 169,84 | 106 | 171,79 | ||||
| 2025-07-08 | 13F | Henrickson Nauta Wealth Advisors, Inc. | 64 038 | 15,11 | 2 677 | 16,90 | ||||
| 2025-08-14 | 13F | Great Valley Advisor Group, Inc. | 7 933 | −59,13 | 332 | −59,49 | ||||
| 2025-07-18 | 13F | BCU Wealth Advisors, LLC | 96 949 | 16,67 | 4 053 | 15,83 | ||||
| 2025-07-29 | 13F | Two West Capital Advisors LLC | 6 491 | −7,05 | 271 | −5,57 | ||||
| 2025-07-17 | 13F | Applied Capital LLC | 15 219 | −0,11 | 636 | −0,78 | ||||
| 2025-07-22 | 13F | Firethorn Wealth Partners, Llc | 14 166 | 1,65 | 592 | 1,02 | ||||
| 2025-08-07 | 13F | Samalin Investment Counsel, LLC | 29 250 | −15,04 | 1 223 | −15,67 | ||||
| 2025-08-12 | 13F | Park Square Financial Group, LLC | 13 | 0,00 | 1 | |||||
| 2025-08-13 | 13F | Legacy Capital Wealth Partners, LLC | 7 102 | 297 | ||||||
| 2025-08-07 | 13F | Nwam Llc | 40 917 | 3,16 | 1 711 | 2,40 | ||||
| 2025-08-11 | 13F | Principal Securities, Inc. | 3 103 | 0,00 | 130 | 3,20 | ||||
| 2025-08-14 | 13F | UBS Group AG | 13 967 | 584 | ||||||
| 2025-08-12 | 13F | Change Path, LLC | 23 043 | 4,65 | 963 | 3,88 | ||||
| 2025-07-28 | 13F | Sterling Financial Planning, Inc. | 132 599 | 6,07 | 5 544 | 5,30 | ||||
| 2025-08-13 | 13F | Northwestern Mutual Wealth Management Co | 0 | −100,00 | 0 | |||||
| 2025-08-15 | 13F | Morgan Stanley | 2 428 | −40,48 | 102 | −40,94 | ||||
| 2025-07-10 | 13F | Wealth Enhancement Advisory Services, Llc | 30 059 | −2,39 | 1 253 | −3,32 | ||||
| 2025-04-16 | 13F | Lam Group, Inc. | 0 | −100,00 | 0 | −100,00 | ||||
| 2025-07-03 | 13F | CPA Asset Management LLC | 432 044 | 2,35 | 18 064 | 1,61 | ||||
| 2025-08-15 | 13F | Binnacle Investments Inc | 54 982 | 4,77 | 2 299 | 4,03 | ||||
| 2025-08-14 | 13F | EP Wealth Advisors, Inc. | 4 428 | −5,63 | 185 | −6,09 | ||||
| 2025-05-08 | 13F | Essential Planning, LLC. | 0 | −100,00 | 0 | |||||
| 2025-08-06 | 13F | Savant Capital, LLC | 7 523 | 315 | ||||||
| 2025-08-08 | 13F | Sensible Financial Planning & Management, LLC. | 170 489 | −8,01 | 7 128 | −8,66 | ||||
| 2025-07-14 | 13F | Kfg Wealth Management, Llc | 194 955 | 2,42 | 8 151 | 1,68 | ||||
| 2025-07-17 | 13F | Porter White Investment Advisors, Inc. | 48 010 | 6,28 | 2 007 | 5,52 | ||||
| 2025-05-02 | 13F | MB Generational Wealth, LLC | 5 369 | 226 | ||||||
| 2025-07-25 | 13F | We Are One Seven, LLC | 0 | −100,00 | 0 | |||||
| 2025-08-06 | 13F | Modera Wealth Management, LLC | 12 833 | 0,00 | 537 | −0,74 | ||||
| 2025-08-11 | 13F | Citigroup Inc | 6 475 | −2,32 | 271 | −3,23 | ||||
| 2025-08-06 | 13F | AE Wealth Management LLC | 97 | 2,11 | 4 | 0,00 | ||||
| 2025-07-22 | 13F | Yardley Wealth Management LLC | 250 286 | 3,68 | 10 | 0,00 | ||||
| 2025-07-17 | 13F | XY Planning Network, Inc. | 19 416 | 8,50 | 812 | 7,70 | ||||
| 2025-07-31 | 13F | Brinker Capital Investments, LLC | 0 | −100,00 | 0 | |||||
| 2025-08-14 | 13F | Jane Street Group, Llc | 21 008 | 138,84 | 878 | 137,30 | ||||
| 2025-07-18 | 13F | Lynx Investment Advisory | 7 774 | 1,07 | 325 | 0,62 | ||||
| 2025-07-22 | 13F | Visionary Horizons, LLC | 14 691 | 16,09 | 614 | 15,41 | ||||
| 2025-08-12 | 13F | LPL Financial LLC | 15 604 | 3,87 | 652 | 3,16 | ||||
| 2025-07-16 | 13F | Vestia Personal Wealth Advisors | 31 286 | 15,05 | 1 308 | 14,15 | ||||
| 2025-08-08 | 13F | Larson Financial Group LLC | 183 032 | −21,94 | 7 653 | −22,50 | ||||
| 2025-07-09 | 13F | Market Street Wealth Management Advisors Llc | 290 171 | 2,17 | 12 132 | 1,45 | ||||
| 2025-07-25 | 13F | Envestnet Portfolio Solutions, Inc. | 9 692 | 405 | ||||||
| 2025-08-14 | 13F | Monograph Wealth Advisors, Llc | 136 427 | 5,04 | 5 704 | 4,30 | ||||
| 2025-07-28 | 13F | Harbour Investments, Inc. | 21 | 0,00 | 1 | |||||
| 2025-07-31 | 13F | Orion Capital Management LLC | 255 | −21,54 | 11 | −23,08 | ||||
| 2025-07-29 | 13F | Fundamentun, Llc | 349 242 | 6,80 | 14 602 | 6,03 | ||||
| 2025-07-31 | 13F | City State Bank | 6 250 | 150,00 | 261 | 148,57 | ||||
| 2025-08-04 | 13F | Saxony Capital Management, LLC | 41 633 | −21,57 | 1 741 | −22,15 | ||||
| 2025-07-16 | 13F | Leading Edge Financial Planning LLC | 382 545 | 7,08 | 15 994 | 6,31 | ||||
| 2025-07-22 | 13F | David Wealth Management LLC | 152 228 | 6,44 | 6 365 | 5,68 | ||||
| 2025-08-08 | 13F | SageOak Financial, LLC | 5 436 | −43,88 | 227 | −44,23 | ||||
| 2025-08-11 | 13F | CFS Investment Advisory Services, LLC | 49 050 | 0,40 | 2 | 0,00 | ||||
| 2025-08-01 | 13F | Envestnet Asset Management Inc | 84 242 | 354,04 | 3 522 | 350,96 | ||||
| 2025-07-30 | 13F | Crewe Advisors LLC | 945 | 0,00 | 40 | 0,00 | ||||
| 2025-07-15 | 13F | Fortitude Family Office, LLC | 243 967 | 67,13 | 10 200 | 65,93 | ||||
| 2025-07-22 | 13F | Aspire Private Capital, LLC | 12 155 | 10,81 | 508 | 10,20 | ||||
| 2025-08-12 | 13F | Rather & Kittrell, Inc. | 417 381 | −0,55 | 17 451 | −1,27 | ||||
| 2025-08-15 | 13F | Equitable Holdings, Inc. | 34 488 | 1,95 | 1 442 | 1,19 | ||||
| 2025-07-16 | 13F | Spinnaker Investment Group, LLC | 0 | −100,00 | 0 | |||||
| 2025-08-18 | 13F | Geneos Wealth Management Inc. | 5 820 | 35,29 | 243 | 34,25 | ||||
| 2025-07-17 | 13F | Northwest Wealth Management, Llc | 16 991 | 1,84 | 710 | 1,14 | ||||
| 2025-08-13 | 13F | Plan Group Financial, LLC | 98 375 | −28,06 | 4 113 | −28,57 | ||||
| 2025-07-15 | 13F | Maseco Llp | 1 866 | 78 | ||||||
| 2025-08-12 | 13F | TCP Asset Management, LLC | 37 197 | 8,45 | 1 555 | 7,69 | ||||
| 2025-08-05 | 13F | C2P Capital Advisory Group, LLC d.b.a. Prosperity Capital Advisors | 0 | −100,00 | 0 | |||||
| 2025-08-12 | 13F | Burk Holdings LLC | 15 619 | 16,98 | 653 | 16,19 | ||||
| 2025-08-14 | 13F | Betterment LLC | 7 972 | −6,92 | 0 | |||||
| 2025-07-30 | 13F | Drive Wealth Management, Llc | 6 351 | −24,87 | 266 | −25,35 | ||||
| 2025-07-31 | 13F | Core Wealth Management, Inc. | 222 731 | 6,36 | 9 312 | 5,60 | ||||
| 2025-08-11 | 13F | Aptus Capital Advisors, LLC | 0 | −100,00 | 0 | |||||
| 2025-08-14 | 13F | Smartleaf Asset Management LLC | 428 | 0,00 | 18 | 0,00 | ||||
| 2025-08-14 | 13F | Wells Fargo & Company/mn | 1 626 | 68 | ||||||
| 2025-07-25 | 13F | Hemington Wealth Management | 765 886 | 6,47 | 32 | 6,67 | ||||
| 2025-08-11 | 13F | Root Financial Partners, LLC | 10 989 | −60,29 | 459 | −60,60 | ||||
| 2025-08-06 | 13F | Entrewealth, Llc | 61 488 | 27,90 | 2 571 | 26,98 | ||||
| 2025-07-21 | 13F | Onyx Financial Advisors, LLC | 38 116 | 49,09 | 1 594 | 48,05 | ||||
| 2025-07-31 | 13F | Glass Jacobson Investment Advisors llc | 9 408 | 2,60 | 393 | 5,93 | ||||
| 2025-08-13 | 13F | Townsquare Capital Llc | 0 | −100,00 | 0 | |||||
| 2025-07-18 | 13F | Fmb Wealth Management | 29 242 | −2,12 | 1 223 | −2,86 | ||||
| 2025-08-12 | 13F | Coston, McIsaac & Partners | 6 268 | 603,48 | 0 | |||||
| 2025-07-09 | 13F | Dynamic Advisor Solutions LLC | 18 951 | 23,19 | 792 | 22,41 | ||||
| 2025-07-18 | 13F | Truist Financial Corp | 6 991 | 1,54 | 292 | 1,04 | ||||
| 2025-07-25 | 13F | Cwm, Llc | 493 | 0,00 | 0 | |||||
| 2025-07-31 | 13F | Heirloom Wealth Management | 983 348 | −4,14 | 41 114 | −4,83 | ||||
| 2025-08-06 | 13F | Commonwealth Equity Services, Llc | 46 095 | −14,20 | 2 | −50,00 | ||||
| 2025-07-08 | 13F | Apella Capital, LLC | 167 513 | 0,88 | 6 979 | 1,07 | ||||
| 2025-07-14 | 13F | Foster Group, Inc. | 18 094 | 0,00 | 757 | −0,66 | ||||
| 2025-07-25 | 13F | Concord Wealth Partners | 3 595 | 202,10 | 150 | 200,00 | ||||
| 2025-07-24 | 13F | Jfs Wealth Advisors, Llc | 3 881 | −0,51 | 162 | −1,22 | ||||
| 2025-08-14 | 13F | Royal Bank Of Canada | 33 891 | 115,29 | 1 417 | 113,73 | ||||
| 2025-07-30 | 13F | Klingman & Associates, LLC | 31 534 | −3,98 | 1 318 | −4,63 | ||||
| 2025-08-04 | 13F | Assetmark, Inc | 73 475 | 3 072 | ||||||
| 2025-07-30 | 13F | Forum Financial Management, LP | 83 158 | −3,08 | 3 477 | −3,79 | ||||
| 2025-08-12 | 13F | Jpmorgan Chase & Co | 5 000 | 0,20 | 209 | −0,48 | ||||
| 2025-07-23 | 13F | Sax Wealth Advisors, Llc | 8 243 | 52,85 | 345 | 51,54 | ||||
| 2025-07-17 | 13F | Willow Creek Wealth Management Inc. | 35 279 | −1,88 | 1 475 | −2,58 | ||||
| 2025-07-31 | 13F | Curio Wealth, Llc | 17 610 | 31 346,43 | 736 | −61,26 | ||||
| 2025-07-30 | 13F | Matson Money. Inc. | 3 573 335 | 0,01 | 149 401 | −0,77 | ||||
| 2025-07-14 | 13F | Park Avenue Securities Llc | 68 750 | 3 | ||||||
| 2025-08-14 | 13F | Note Advisors, LLC | 10 250 | −3,38 | 429 | −4,04 | ||||
| 2025-08-12 | 13F | Nemes Rush Group LLC | 3 273 | 33,43 | 137 | 32,04 | ||||
| 2025-07-24 | 13F | IFP Advisors, Inc | 3 | −100,00 | 0 | −100,00 | ||||
| 2025-08-14 | 13F | Qube Research & Technologies Ltd | 188 | 0,00 | 8 | 0,00 | ||||
| 2025-07-22 | 13F | Berger Financial Group, Inc | 4 898 | 0,00 | 205 | −0,97 | ||||
| 2025-07-18 | 13F | Meritas Wealth Management, LLC | 4 788 | 200 | ||||||
| 2025-08-08 | 13F | Tortoise Investment Management, LLC | 26 908 | 28,82 | 1 125 | 27,99 | ||||
| 2025-07-16 | 13F | Five Oceans Advisors | 254 918 | 3,55 | 10 658 | 2,82 | ||||
| 2025-07-18 | 13F | Bridge Generations Wealth Management Llc | 3 609 | 0,00 | 151 | −0,66 | ||||
| 2025-08-12 | 13F | Proequities, Inc. | 0 | 0 | ||||||
| 2025-08-13 | 13F | Grove Street Fiduciary, LLC | 91 644 | −2,75 | 3 832 | −3,45 | ||||
| 2025-07-17 | 13F | Global Trust Asset Management, LLC | 2 900 | 2 800,00 | 121 | 2 925,00 | ||||
| 2025-07-30 | 13F | Exencial Wealth Advisors, Llc | 43 643 | −6,71 | 1 825 | −7,36 | ||||
| 2025-08-12 | 13F | Hill Investment Group Partners, LLC | 798 105 | 1,07 | 33 369 | 0,34 | ||||
| 2025-07-15 | 13F | Total Wealth Planning, Llc | 21 509 | −27,31 | 899 | −27,85 | ||||
| 2025-07-23 | 13F | Elevate Wealth Advisory, Inc | 1 953 | 0,00 | 82 | −1,22 | ||||
| 2025-07-10 | 13F | Stewardship Advisors, LLC | 9 608 | −2,46 | 402 | −3,14 | ||||
| 2025-08-14 | 13F | Balanced Rock Investment Advisor | 51 707 | 2 162 | ||||||
| 2025-07-17 | 13F | Blossom Wealth Management | 7 753 | 12,59 | 324 | 12,11 | ||||
| 2025-08-14 | 13F | Citadel Advisors Llc | 0 | −100,00 | 0 | |||||
| 2025-07-16 | 13F | Midwest Heritage Bank, FSB | 0 | −100,00 | 0 | |||||
| 2025-08-06 | 13F | Geometric Wealth Advisors | 498 824 | 0,17 | 20 856 | −0,55 | ||||
| 2025-08-08 | 13F | Pinney & Scofield, Inc. | 400 303 | −0,17 | 16 737 | −0,88 | ||||
| 2025-08-08 | 13F | Austin Wealth Management, LLC | 261 287 | 8,21 | 10 902 | 8,31 | ||||
| 2025-07-29 | NP | FMFIX - Free Market Fixed Income Fund Institutional Class | 3 543 397 | 0,00 | 147 228 | −0,86 | ||||
| 2025-08-06 | 13F | New Dimensions Wealth Management, LLC | 202 204 | 2,83 | 8 439 | 1,92 | ||||
| 2025-09-04 | 13F/A | Advisor Group Holdings, Inc. | 4 999 | 10,60 | 209 | 10,00 | ||||
| 2025-07-16 | 13F | Strategic Investment Solutions, Inc. /IL | 5 710 | 602,34 | 239 | 600,00 | ||||
| 2025-07-28 | 13F | Verisail Partners, LLC | 5 118 | 0,71 | 214 | −0,47 | ||||
| 2025-07-14 | 13F | AdvisorNet Financial, Inc | 0 | −100,00 | 0 | |||||
| 2025-07-31 | 13F | Planning Center, Inc. | 868 594 | 2,19 | 36 316 | 1,46 | ||||
| 2025-08-14 | 13F | Bank Of America Corp /de/ | 0 | −100,00 | 0 | |||||
| 2025-07-11 | 13F | Scratch Capital Llc | 234 900 | 25,03 | 9 821 | 24,14 | ||||
| 2025-08-08 | 13F | Altiora Financial Group, LLC | 81 946 | 0,46 | 3 426 | −0,26 |