Grundläggande statistik
| Institutionella ägare | 218 total, 218 long only, 0 short only, 0 long/short - change of 7,32% MRQ |
| Genomsnittlig portföljallokering | 0.7960 % - change of −0,06% MRQ |
| Institutionella aktier (lång) | 111 449 865 (ex 13D/G) - change of 21,69MM shares 24,17% MRQ |
| Institutionellt värde (lång) | $ 3 809 304 USD ($1000) |
Institutionellt ägande och aktieägare
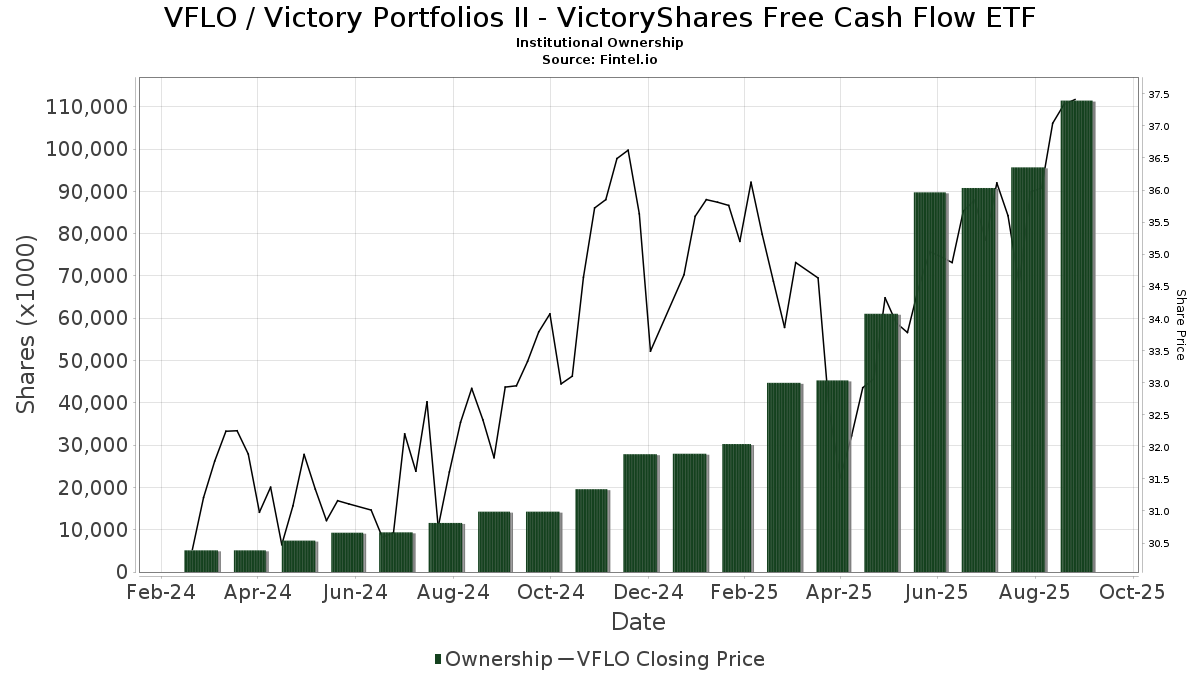
Victory Portfolios II - VictoryShares Free Cash Flow ETF (US:VFLO) har 218 Institutionella ägare och aktieägare som har lämnat in 13D/G- eller 13F-formulär till Securities Exchange Commission (SEC). Dessa institut innehar totalt 111,449,865 aktier. Största aktieägare inkluderar Bank Of America Corp /de/, LPL Financial LLC, Morgan Stanley, Allworth Financial LP, Northwestern Mutual Wealth Management Co, Wells Fargo & Company/mn, Victory Capital Management Inc, Raymond James Financial Inc, Annex Advisory Services, LLC, and Miracle Mile Advisors, LLC .
Victory Portfolios II - VictoryShares Free Cash Flow ETF (NasdaqGM:VFLO) Institutionell ägarstruktur visar institutioners och fonders nuvarande positioner i företaget, samt de senaste förändringarna i positionernas storlek. Större aktieägare kan vara enskilda investerare, fonder, hedgefonder eller institutioner. Bilaga 13D visar att investeraren äger (eller ägde) mer än 5% av företaget och avser (eller avsåg) att aktivt eftersträva en förändring av affärsstrategin. Schedule 13G indikerar en passiv investering på över 5%.
The share price as of September 12, 2025 is 37,50 / share. Previously, on September 13, 2024, the share price was 32,58 / share. This represents an increase of 15,10% over that period.
Fondsentimentets poäng
Fondsentimentet poängen(fka Ägarackumulation-poäng) visar vilka aktier som är mest köpta av fonder. Det är resultatet av en sofistikerad kvantitativ flerfaktormodell som identifierar företag med de högsta nivåerna av institutionell ackumulering. Poängsättningsmodellen använder en kombination av den totala ökningen av redovisade ägare, förändringarna i portföljallokeringarna för dessa ägare och andra mått. Siffran sträcker sig från 0 till 100, där högre siffror indikerar en högre nivå av ackumulering i förhållande till sina konkurrenter, och 50 är genomsnittet.
Uppdateringsfrekvens: Dagligen
Se Ownership Explorer, som innehåller en lista över de högst rankade företagen.
Institutionell sälj/köp-kvot
Förutom att rapportera vanliga eget kapital- och skuldemissioner måste institutioner med mer än 100MM tillgångar under förvaltning också avslöja sina innehav av sälj- och köpoptioner. Eftersom säljoptioner i allmänhet indikerar ett negativt sentiment och köpoptioner indikerar ett positivt sentiment, kan vi få en uppfattning om det övergripande institutionella sentimentet genom att plotta förhållandet mellan säljoptioner och köpoptioner. Diagrammet till höger visar det historiska förhållandet mellan sälj- och köpoptioner för detta instrument.
Genom att använda sälj/köp-kvoten som en indikator på aktieägarnas sentiment undviker man en av de största bristerna med att använda det totala institutionella ägandet, nämligen att en betydande del av de förvaltade tillgångarna investeras passivt för att följa index. Passivt förvaltade fonder köper vanligtvis inte optioner, så indikatorn för sälj/köp-kvoten ger en bättre bild av stämningen i aktivt förvaltade fonder.
13F- och NPORT-arkiveringar
Detaljer om 13F-arkiveringar är gratis. Detaljer om NP-arkiveringar kräver ett premiummedlemskap. Gröna rader indikerar nya positioner. Röda rader indikerar stängda positioner. Klicka på länk symbolen för att se hela transaktionshistoriken.
Uppgradera
för att låsa upp premiumdata och exportera till Excel ![]() .
.
| Fil Datum | Källa | Investerare | Typ | Genomsnittligt pris (beräknat) |
Aktier | Δ Aktier (%) |
Rapporterat värde (1000 USD) |
Δ Värde (%) |
Portföljallokering (%) |
|
|---|---|---|---|---|---|---|---|---|---|---|
| 2025-08-12 | 13F | LPL Financial LLC | 9 367 594 | 22,68 | 331 144 | 26,51 | ||||
| 2025-09-04 | 13F/A | Advisor Group Holdings, Inc. | 829 290 | 16,74 | 29 324 | 20,37 | ||||
| 2025-08-14 | 13F | Integrated Wealth Concepts LLC | 49 486 | 43,94 | 1 749 | 48,47 | ||||
| 2025-07-17 | 13F | Global Trust Asset Management, LLC | 1 681 | 0,00 | 59 | 3,51 | ||||
| 2025-08-13 | 13F | Smith, Moore & Co. | 38 794 | −18,57 | 1 371 | −16,04 | ||||
| 2025-08-14 | 13F | Napa Wealth Management | 40 204 | −49,36 | 1 421 | −47,78 | ||||
| 2025-07-31 | 13F | Cambridge Investment Research Advisors, Inc. | 1 118 911 | 28,35 | 40 | 34,48 | ||||
| 2025-08-14 | 13F | Fort Point Capital Partners LLC | 75 101 | −53,57 | 2 655 | −52,13 | ||||
| 2025-07-22 | 13F | Merit Financial Group, LLC | 2 333 822 | 82 501 | ||||||
| 2025-08-13 | 13F | Correct Capital Wealth Management | 1 155 244 | −13,17 | 40 838 | −10,45 | ||||
| 2025-04-25 | 13F | New Wave Wealth Advisors Llc | 0 | −100,00 | 0 | |||||
| 2025-08-06 | 13F | OneAscent Wealth Management LLC | 220 638 | −0,01 | 8 | 0,00 | ||||
| 2025-04-15 | 13F | Transform Wealth, LLC | 118 520 | −10,65 | 4 063 | −10,17 | ||||
| 2025-07-31 | 13F | DDD Partners, LLC | 60 879 | 1,84 | 2 152 | 5,03 | ||||
| 2025-08-15 | 13F | Equitable Holdings, Inc. | 85 495 | 42,98 | 3 022 | 47,49 | ||||
| 2025-08-14 | 13F | Hilltop Holdings Inc. | 67 805 | −1,65 | 2 397 | 1,40 | ||||
| 2025-08-14 | 13F | Atomi Financial Group, Inc. | 14 392 | −20,62 | 509 | −18,20 | ||||
| 2025-08-14 | 13F | Wiley Bros.-aintree Capital, Llc | 137 463 | 134,84 | 4 855 | 143,24 | ||||
| 2025-08-11 | 13F | VSM Wealth Advisory, LLC | 0 | −100,00 | 0 | |||||
| 2025-08-08 | 13F | Thoroughbred Financial Services, Llc | 9 877 | 31,54 | 0 | |||||
| 2025-08-11 | 13F | Advisor Resource Council | 0 | −100,00 | 0 | |||||
| 2025-07-29 | 13F | Financial Guidance Group, Inc. | 91 026 | 3 218 | ||||||
| 2025-07-23 | 13F | Traphagen Investment Advisors Llc | 2 219 090 | 5,72 | 78 445 | 9,02 | ||||
| 2025-08-05 | 13F | Sigma Planning Corp | 38 137 | 0,99 | 1 348 | 4,17 | ||||
| 2025-08-11 | 13F | Private Advisor Group, LLC | 570 206 | −51,99 | 20 157 | −50,49 | ||||
| 2025-07-16 | 13F | Kennedy Investment Group | 46 997 | 13,89 | 1 661 | 17,47 | ||||
| 2025-07-14 | 13F | Toth Financial Advisory Corp | 33 | 0,00 | 1 | 0,00 | ||||
| 2025-07-22 | 13F | DAVENPORT & Co LLC | 17 051 | 0,00 | 603 | 3,08 | ||||
| 2025-07-24 | 13F | Financial Security Advisor, Inc. | 6 365 | 225 | ||||||
| 2025-08-11 | 13F | Wbi Investments, Inc. | 243 062 | −2,15 | 8 592 | 0,90 | ||||
| 2025-08-13 | 13F | Legacy Capital Wealth Partners, LLC | 19 268 | −30,84 | 681 | −28,69 | ||||
| 2025-07-29 | 13F | Signature Estate & Investment Advisors Llc | 6 717 | 0,00 | 237 | 3,04 | ||||
| 2025-07-21 | 13F | Patriot Financial Group Insurance Agency, LLC | 170 953 | −22,44 | 6 043 | −20,02 | ||||
| 2025-07-17 | 13F | Financial Designs Corp | 214 016 | −11,93 | 7 565 | −9,18 | ||||
| 2025-07-17 | 13F | Smith Anglin Financial, LLC | 2 720 743 | 6,04 | 96 178 | 9,35 | ||||
| 2025-08-13 | 13F | Victory Capital Management Inc | 3 936 250 | 9,15 | 139 146 | 12,56 | ||||
| 2025-08-07 | 13F | Howard Bailey Securities, Llc | 9 445 | −2,76 | 334 | 0,30 | ||||
| 2025-07-31 | 13F | Sequent Asset Management, LLC | 34 679 | −0,57 | 1 226 | 2,51 | ||||
| 2025-06-26 | NP | URFRX - Target Retirement 2040 Fund | 1 317 454 | 46,06 | 43 371 | 35,40 | ||||
| 2025-07-09 | 13F | Lifestyle Asset Management, Inc. | 196 863 | 5,09 | 6 959 | 8,38 | ||||
| 2025-07-25 | 13F | M.e. Allison & Co., Inc. | 26 835 | 60,99 | 949 | 66,02 | ||||
| 2025-08-18 | 13F | Hollencrest Capital Management | 0 | −100,00 | 0 | |||||
| 2025-08-12 | 13F | Change Path, LLC | 27 427 | −1,63 | 970 | 1,47 | ||||
| 2025-08-14 | 13F | Qube Research & Technologies Ltd | 368 667 | 236,78 | 13 032 | 247,33 | ||||
| 2025-07-31 | 13F | Carrera Capital Advisors | 9 060 | −34,37 | 320 | −32,35 | ||||
| 2025-08-08 | 13F | Comprehensive Financial Planning, Inc./PA | 44 536 | 22,58 | 1 574 | 26,43 | ||||
| 2025-08-14 | 13F | UBS Group AG | 2 515 724 | 36,41 | 88 931 | 40,67 | ||||
| 2025-06-26 | NP | URINX - Target Retirement Income Fund | 208 746 | 0,00 | 6 872 | −7,30 | ||||
| 2025-08-08 | 13F | Pnc Financial Services Group, Inc. | 11 572 | 409 | ||||||
| 2025-07-21 | 13F | DHJJ Financial Advisors, Ltd. | 57 | 0,00 | 2 | 100,00 | ||||
| 2025-08-14 | 13F | Comerica Bank | 91 688 | 39,27 | 3 241 | 43,66 | ||||
| 2025-07-17 | 13F | Smith, Salley & Associates | 5 875 | 0,00 | 208 | 2,99 | ||||
| 2025-08-13 | 13F | GeoWealth Management, LLC | 31 310 | −3,83 | 1 107 | −0,90 | ||||
| 2025-04-29 | 13F | Hm Payson & Co | 1 025 | 35 | ||||||
| 2025-08-13 | 13F | Allie Family Office LLC | 6 422 | 0,00 | 227 | 3,18 | ||||
| 2025-07-17 | 13F | Raleigh Capital Management Inc. | 8 900 | −9,04 | 315 | −6,27 | ||||
| 2025-08-12 | 13F | Proequities, Inc. | 0 | 0 | ||||||
| 2025-08-11 | 13F | Madison Asset Management, LLC | 56 236 | 19,15 | 1 988 | 22,88 | ||||
| 2025-08-11 | 13F | Greykasell Wealth Strategies, Inc. | 22 298 | 40,74 | 788 | 45,12 | ||||
| 2025-08-14 | 13F | Fmr Llc | 373 | 143,79 | 13 | 160,00 | ||||
| 2025-07-15 | 13F | World Equity Group, Inc. | 8 596 | 17,61 | 304 | 21,20 | ||||
| 2025-08-19 | 13F | National Asset Management, Inc. | 8 203 | 290 | ||||||
| 2025-08-14 | 13F/A | Rockefeller Capital Management L.P. | 91 344 | 38,83 | 3 229 | 43,19 | ||||
| 2025-07-28 | 13F | Sagespring Wealth Partners, Llc | 89 748 | 28,45 | 3 173 | 32,44 | ||||
| 2025-08-11 | 13F | Western Wealth Management, LLC | 233 397 | 0,97 | 8 251 | 4,13 | ||||
| 2025-08-14 | 13F | Wells Fargo & Company/mn | 4 667 811 | 43,57 | 165 007 | 48,05 | ||||
| 2025-07-08 | 13F | Parallel Advisors, LLC | 97 682 | 933,67 | 3 453 | 969,04 | ||||
| 2025-07-29 | 13F | Stratos Wealth Partners, LTD. | 15 851 | 34,25 | 560 | 38,61 | ||||
| 2025-08-12 | 13F | Steward Partners Investment Advisory, Llc | 40 134 | 11,76 | 1 419 | 15,19 | ||||
| 2025-08-07 | 13F | Allworth Financial LP | 6 704 169 | 1,99 | 236 992 | 9,72 | ||||
| 2025-08-12 | 13F | Allen Capital Group, LLC | 414 918 | 5,33 | 14 667 | 8,61 | ||||
| 2025-08-13 | 13F | Gateway Wealth Partners, LLC | 8 021 | 20,40 | 284 | 24,12 | ||||
| 2025-08-13 | 13F | D L Carlson Investment Group Inc | 60 428 | 2 136 | ||||||
| 2025-08-12 | 13F | Global Retirement Partners, LLC | 75 044 | 296,53 | 2 653 | 311,16 | ||||
| 2025-06-26 | NP | URTRX - Target Retirement 2030 Fund | 672 759 | 22,82 | 22 147 | 13,87 | ||||
| 2025-07-28 | 13F | RFG Advisory, LLC | 66 322 | 2 344 | ||||||
| 2025-07-31 | 13F | Oppenheimer & Co Inc | 7 900 | 11,27 | 279 | 14,81 | ||||
| 2025-08-01 | 13F | Yukon Wealth Management, Inc. | 27 328 | 966 | ||||||
| 2025-07-10 | 13F | Vista Investment Partners Llc | 70 235 | −1,78 | 2 483 | 1,26 | ||||
| 2025-07-18 | 13F | PFG Investments, LLC | 8 898 | 0,85 | 315 | 3,97 | ||||
| 2025-08-13 | 13F | Sepio Capital, LP | 536 518 | 4,10 | 18 966 | 7,35 | ||||
| 2025-08-05 | 13F | Claro Advisors LLC | 14 236 | −4,41 | 503 | −1,37 | ||||
| 2025-07-14 | 13F | Strategic Planning Group, Llc | 497 268 | −3,09 | 17 578 | −0,07 | ||||
| 2025-08-07 | 13F | Weil Company, Inc. | 219 348 | 7 754 | ||||||
| 2025-04-28 | 13F | Keybank National Association/oh | 0 | −100,00 | 0 | |||||
| 2025-07-18 | 13F | Astor Investment Management LLC | 479 584 | −5,10 | 16 953 | −2,14 | ||||
| 2025-08-14 | 13F | Schwallier Wealth Management LLC | 7 353 | −49,83 | 260 | −48,41 | ||||
| 2025-08-14 | 13F | Mml Investors Services, Llc | 141 074 | −11,41 | 5 | −20,00 | ||||
| 2025-08-15 | 13F | Keel Point, LLC | 41 051 | 24,04 | 1 451 | 27,95 | ||||
| 2025-08-06 | 13F | Moors & Cabot, Inc. | 10 980 | 14,63 | 388 | 18,29 | ||||
| 2025-07-31 | 13F | Trademark Financial Management, LLC | 140 647 | 172,97 | 4 972 | 181,48 | ||||
| 2025-08-05 | 13F | Atlas Wealth LLC | 9 315 | 335 | ||||||
| 2025-07-09 | 13F | Krilogy Financial LLC | 1 244 717 | 9,35 | 44 001 | 12,76 | ||||
| 2025-08-07 | 13F | Kestra Private Wealth Services, Llc | 14 029 | 25,51 | 496 | 29,24 | ||||
| 2025-08-14 | 13F | Royal Bank Of Canada | 2 019 114 | 13,40 | 71 375 | 16,94 | ||||
| 2025-07-30 | 13F/A | KPP Advisory Services LLC | 68 091 | 22,16 | 2 407 | 26,02 | ||||
| 2025-07-11 | 13F | Farther Finance Advisors, LLC | 359 151 | 120,53 | 12 696 | 127,43 | ||||
| 2025-07-22 | 13F | Kickstand Ventures, Llc. | 221 503 | 7 830 | ||||||
| 2025-07-22 | 13F | Duncan Williams Asset Management, LLC | 221 503 | 7 830 | ||||||
| 2025-08-06 | 13F | AE Wealth Management LLC | 46 768 | 5,01 | 1 653 | 8,32 | ||||
| 2025-08-15 | 13F | Morgan Stanley | 8 130 518 | 44,62 | 287 414 | 49,14 | ||||
| 2025-08-14 | 13F | GWM Advisors LLC | 28 847 | −50,98 | 1 020 | −49,48 | ||||
| 2025-08-13 | 13F | Nicolet Advisory Services, Llc | 6 000 | 206 | ||||||
| 2025-07-18 | 13F | Trust Co Of Vermont | 332 | 12 | ||||||
| 2025-08-12 | 13F | Atlantic Family Wealth, Llc | 59 498 | 7,14 | 2 103 | 10,51 | ||||
| 2025-07-09 | 13F | Triumph Capital Management | 77 550 | 9,42 | 2 741 | 12,84 | ||||
| 2025-08-08 | 13F | Foundations Investment Advisors, LLC | 202 577 | 10,38 | 7 161 | 13,83 | ||||
| 2025-08-13 | 13F | StoneX Group Inc. | 1 047 419 | 3,43 | 37 026 | 6,66 | ||||
| 2025-07-08 | 13F | Advance Capital Management, Inc. | 222 642 | −1,94 | 7 870 | 1,13 | ||||
| 2025-05-16 | 13F | Jones Financial Companies Lllp | 0 | −100,00 | 0 | |||||
| 2025-07-17 | 13F | Sound Income Strategies, LLC | 157 | 6 | ||||||
| 2025-07-31 | 13F | CAP Partners, LLC | 61 339 | 7,04 | 2 168 | 10,39 | ||||
| 2025-08-14 | 13F | Mariner, LLC | 135 761 | −20,51 | 4 799 | −18,02 | ||||
| 2025-07-17 | 13F | Janney Montgomery Scott LLC | 73 049 | −81,31 | 3 | −84,62 | ||||
| 2025-08-12 | 13F | Tradition Wealth Management, LLC | 79 626 | 4,17 | 2 815 | 7,40 | ||||
| 2025-05-01 | 13F | Quest 10 Wealth Builders, Inc. | 1 387 | 20,92 | 48 | 20,51 | ||||
| 2025-08-04 | 13F | Flagship Harbor Advisors, Llc | 190 613 | −0,08 | 6 738 | 3,04 | ||||
| 2025-07-16 | 13F | Spirepoint Private Client, Llc | 74 149 | 2 621 | ||||||
| 2025-08-15 | 13F | Kestra Advisory Services, LLC | 17 538 | −1,64 | 620 | 1,31 | ||||
| 2025-07-10 | 13F | Wealth Enhancement Advisory Services, Llc | 163 984 | 5,60 | 5 866 | 10,18 | ||||
| 2025-06-26 | NP | URFFX - Target Retirement 2050 Fund | 991 090 | 61,92 | 32 627 | 50,12 | ||||
| 2025-07-23 | 13F | Prime Capital Investment Advisors, LLC | 11 087 | 392 | ||||||
| 2025-07-24 | 13F | Morton Brown Family Wealth, LLC | 0 | −100,00 | 0 | |||||
| 2025-07-14 | 13F | Mechanics Bank Trust Department | 63 580 | 11,65 | 2 248 | 15,11 | ||||
| 2025-08-18 | 13F | Geneos Wealth Management Inc. | 502 | −56,35 | 18 | −56,41 | ||||
| 2025-08-13 | 13F | Renaissance Technologies Llc | 42 000 | −71,17 | 1 485 | −70,28 | ||||
| 2025-08-14 | 13F | Raymond James Financial Inc | 3 426 701 | 37,23 | 121 134 | 41,51 | ||||
| 2025-07-22 | 13F | Wealthcare Advisory Partners LLC | 43 589 | 1 541 | ||||||
| 2025-07-25 | 13F | Landmark Wealth Management, LLC | 413 589 | 1,75 | 15 | 7,69 | ||||
| 2025-08-11 | 13F | Outlook Wealth Advisors, LLC | 7 749 | −0,19 | 274 | 2,63 | ||||
| 2025-07-22 | 13F | Unique Wealth, Llc | 13 750 | 486 | ||||||
| 2025-08-13 | 13F | Keystone Financial Group | 777 879 | 7,86 | 27 498 | 11,23 | ||||
| 2025-08-06 | 13F | Horan Securities, Inc. | 11 499 | 407 | ||||||
| 2025-08-11 | 13F | HighTower Advisors, LLC | 1 663 787 | 2 671,68 | 58 815 | 2 759,21 | ||||
| 2025-08-13 | 13F | Cerity Partners LLC | 10 134 | −17,67 | 358 | −14,96 | ||||
| 2025-07-25 | 13F | Atria Wealth Solutions, Inc. | 6 854 | 242 | ||||||
| 2025-08-14 | 13F | Ameriprise Financial Inc | 996 575 | 35 234 | ||||||
| 2025-07-22 | 13F | Belpointe Asset Management LLC | 9 791 | 65,28 | 346 | 70,44 | ||||
| 2025-05-16 | 13F/A | Kestra Investment Management, LLC | 0 | −100,00 | 0 | |||||
| 2025-06-26 | NP | URSIX - Target Retirement 2060 Fund | 165 109 | 34,48 | 5 435 | 24,68 | ||||
| 2025-08-13 | 13F | EverSource Wealth Advisors, LLC | 82 024 | 53,01 | 2 900 | 57,81 | ||||
| 2025-07-24 | 13F | IFP Advisors, Inc | 232 | 0,00 | 8 | 14,29 | ||||
| 2025-08-04 | 13F | Assetmark, Inc | 312 | −31,13 | 11 | −26,67 | ||||
| 2025-08-19 | 13F | Advisory Services Network, LLC | 18 983 | −14,37 | 660 | −13,18 | ||||
| 2025-08-01 | 13F | Envestnet Asset Management Inc | 2 097 816 | 2,23 | 74 131 | 5,38 | ||||
| 2025-07-18 | 13F | SimpliFi, Inc. | 134 260 | −0,18 | 4 746 | 2,95 | ||||
| 2025-08-06 | 13F | Commonwealth Equity Services, Llc | 1 103 793 | 7,89 | 39 | 11,43 | ||||
| 2025-08-13 | 13F | WCG Wealth Advisors LLC | 37 579 | −8,39 | 1 328 | −5,55 | ||||
| 2025-08-06 | 13F | Wedbush Securities Inc | 6 397 | 0,00 | 0 | |||||
| 2025-08-06 | 13F | Golden State Wealth Management, LLC | 3 000 | 0,00 | 106 | 3,92 | ||||
| 2025-08-07 | 13F | Parkside Financial Bank & Trust | 1 517 | 0,00 | 54 | 1,92 | ||||
| 2025-08-07 | 13F | Summit Asset Management, LLC | 53 810 | 55,48 | 1 902 | 60,37 | ||||
| 2025-08-12 | 13F | Ameritas Investment Partners, Inc. | 179 | 6 | ||||||
| 2025-08-01 | 13F | Y-Intercept (Hong Kong) Ltd | 17 901 | 633 | ||||||
| 2025-08-27 | 13F/A | Brinker Capital Investments, LLC | 700 609 | 48,76 | 24 767 | 53,40 | ||||
| 2025-07-09 | 13F | Procyon Private Wealth Partners, LLC | 0 | −100,00 | 0 | |||||
| 2025-07-22 | 13F | Miracle Mile Advisors, LLC | 2 732 847 | 5,10 | 96 606 | 8,39 | ||||
| 2025-08-14 | 13F | Citadel Advisors Llc | 13 622 | 19,09 | 482 | 22,70 | ||||
| 2025-05-14 | 13F | Huntington National Bank | 17 | |||||||
| 2025-07-29 | 13F | Sowa Financial Group, Inc. | 11 362 | 2,34 | 0 | |||||
| 2025-07-29 | 13F | Huntleigh Advisors, Inc. | 158 623 | 8,38 | 5 607 | 11,78 | ||||
| 2025-08-12 | 13F | OneAscent Financial Services LLC | 255 175 | −0,15 | 9 | 12,50 | ||||
| 2025-07-14 | 13F | Legacy Capital Group California, Inc. | 110 636 | −1,68 | 3 911 | 1,37 | ||||
| 2025-07-16 | 13F | Embree Financial Group | 87 292 | 43,23 | 3 086 | 47,68 | ||||
| 2025-05-15 | 13F/A | Orion Portfolio Solutions, LLC | 470 976 | 16 145 | ||||||
| 2025-08-14 | 13F | Jane Street Group, Llc | 0 | −100,00 | 0 | |||||
| 2025-07-24 | 13F | Eastern Bank | 0 | −100,00 | 0 | |||||
| 2025-08-07 | 13F | Sound View Wealth Advisors Group, LLC | 11 335 | 0,00 | 401 | 3,09 | ||||
| 2025-07-25 | NP | USCCX - Cornerstone Conservative Fund | 90 000 | 0,00 | 3 050 | −4,03 | ||||
| 2025-08-05 | 13F | Optivise Advisory Services LLC | 38 670 | 16,29 | 1 367 | 19,93 | ||||
| 2025-07-16 | 13F | Wealth Group Ltd | 20 295 | 717 | ||||||
| 2025-04-30 | 13F | J Hagan Capital, Inc. | 143 376 | 4 888 | ||||||
| 2025-07-17 | 13F | Beacon Capital Management, LLC | 0 | −100,00 | 0 | |||||
| 2025-07-08 | 13F | Goldstone Financial Group, LLC | 133 646 | 12,36 | 4 781 | 17,24 | ||||
| 2025-08-13 | 13F | Millstone Evans Group, LLC | 1 178 | 42 | ||||||
| 2025-08-13 | 13F | Northwestern Mutual Wealth Management Co | 6 341 983 | 14,25 | 224 189 | 17,82 | ||||
| 2025-08-14 | 13F | Money Concepts Capital Corp | 24 551 | 9,15 | 868 | 12,45 | ||||
| 2025-08-14 | 13F | Modern Wealth Management, LLC | 1 010 295 | 35 714 | ||||||
| 2025-07-25 | NP | UCEQX - Cornerstone Equity Fund | 491 092 | 16,35 | 16 643 | 11,64 | ||||
| 2025-07-16 | 13F | Spinnaker Investment Group, LLC | 22 973 | 26,24 | 812 | 30,34 | ||||
| 2025-08-05 | 13F | Bank of New York Mellon Corp | 13 773 | −9,69 | 487 | −6,90 | ||||
| 2025-08-14 | 13F | Quantinno Capital Management LP | 6 562 | 232 | ||||||
| 2025-05-15 | 13F | Talon Private Wealth, LLC | 0 | −100,00 | 0 | −100,00 | ||||
| 2025-07-25 | 13F | Concurrent Investment Advisors, LLC | 238 384 | −1,17 | 8 427 | 1,91 | ||||
| 2025-07-01 | 13F | Private Client Services, Llc | 0 | −100,00 | 0 | |||||
| 2025-06-30 | NP | ASTIX - Astor Dynamic Allocation Fund Class I shares | 238 436 | 47,75 | 7 849 | 36,98 | ||||
| 2025-08-12 | 13F | Coldstream Capital Management Inc | 0 | −100,00 | 0 | |||||
| 2025-08-06 | 13F | OneAscent Family Office, LLC | 45 057 | 0,30 | 2 | 0,00 | ||||
| 2025-08-14 | 13F | Kovitz Investment Group Partners, LLC | 50 679 | 1 792 | ||||||
| 2025-07-24 | 13F | Reuter James Wealth Management, Llc | 8 490 | −38,20 | 300 | −36,17 | ||||
| 2025-04-11 | 13F | Godsey & Gibb Associates | 0 | −100,00 | 0 | |||||
| 2025-08-08 | 13F | Larson Financial Group LLC | 397 | 0,51 | 14 | 7,69 | ||||
| 2025-07-01 | 13F | Burkett Financial Services, Llc | 0 | −100,00 | 0 | |||||
| 2025-07-10 | 13F | Secure Asset Management, LLC | 28 810 | 17,60 | 1 018 | 21,33 | ||||
| 2025-08-12 | 13F | Jacobi Capital Management LLC | 13 104 | 5,90 | 463 | 9,20 | ||||
| 2025-08-14 | 13F | Gotham Asset Management, LLC | 262 048 | 9 263 | ||||||
| 2025-08-14 | 13F | Stifel Financial Corp | 291 056 | 178,59 | 10 289 | 187,29 | ||||
| 2025-08-15 | 13F | Tower Research Capital LLC (TRC) | 22 739 | 55 360,98 | 804 | 80 200,00 | ||||
| 2025-08-13 | 13F | Quadrature Capital Ltd | 0 | −100,00 | 0 | |||||
| 2025-08-14 | 13F | D. E. Shaw & Co., Inc. | 0 | −100,00 | 0 | |||||
| 2025-08-14 | 13F | Susquehanna International Group, Llp | 56 038 | 146,18 | 1 981 | 153,85 | ||||
| 2025-08-06 | 13F | Vantage Financial Partners, LLC | 744 855 | 58,61 | 26 331 | 63,56 | ||||
| 2025-08-11 | 13F | Pin Oak Investment Advisors Inc | 0 | 0 | ||||||
| 2025-08-08 | 13F | Crossmark Global Holdings, Inc. | 1 710 | 51,87 | ||||||
| 2025-08-14 | 13F | IHT Wealth Management, LLC | 11 364 | −59,54 | 402 | −58,32 | ||||
| 2025-08-08 | 13F | CFO4Life Group, LLC | 350 388 | 8,31 | 12 386 | 11,70 | ||||
| 2025-07-29 | 13F | Private Trust Co Na | 12 442 | −1,91 | 440 | 1,15 | ||||
| 2025-08-08 | 13F | Cetera Investment Advisers | 253 161 | −2,44 | 8 949 | 0,61 | ||||
| 2025-07-21 | 13F | Ameritas Advisory Services, LLC | 1 024 | 36 | ||||||
| 2025-08-14 | 13F | Ausdal Financial Partners, Inc. | 128 745 | 23,14 | 4 551 | 27,02 | ||||
| 2025-08-14 | 13F | Bank Of America Corp /de/ | 12 619 465 | 29,50 | 446 098 | 33,54 | ||||
| 2025-08-11 | 13F | Aptus Capital Advisors, LLC | 91 145 | 3 222 | ||||||
| 2025-07-14 | 13F | GAMMA Investing LLC | 94 | 3 | ||||||
| 2025-07-16 | 13F | Maridea Wealth Management LLC | 80 433 | 17,44 | 2 843 | 21,13 | ||||
| 2025-08-12 | 13F | Northeast Planning Associates, Inc. / Nh / | 94 654 | 17,90 | 3 346 | 21,58 | ||||
| 2025-08-14 | 13F | Byrne Financial Freedom, Llc | 93 488 | −9,87 | 3 305 | −7,06 | ||||
| 2025-07-23 | 13F | Dohj, Llc | 64 373 | 746,23 | 2 071 | 696,15 | ||||
| 2025-08-14 | 13F | Ancora Advisors, LLC | 1 049 | 7,70 | 37 | 12,12 | ||||
| 2025-08-14 | 13F | Great Valley Advisor Group, Inc. | 1 436 456 | −0,65 | 50 779 | 2,45 | ||||
| 2025-08-12 | 13F | Cornerstone Wealth Management, LLC | 91 964 | 4,06 | 3 251 | 7,30 | ||||
| 2025-08-14 | 13F | Snowden Capital Advisors LLC | 9 805 | 57,01 | 347 | 61,68 | ||||
| 2025-07-11 | 13F | Annex Advisory Services, LLC | 3 173 134 | 35,68 | 112 170 | 39,92 | ||||
| 2025-07-29 | 13F | Activest Wealth Management | 0 | 0 | ||||||
| 2025-08-14 | 13F | Aqr Capital Management Llc | 21 500 | 0,00 | 760 | 3,12 | ||||
| 2025-08-04 | 13F | Bay Colony Advisory Group, Inc d/b/a Bay Colony Advisors | 44 212 | 5,84 | 1 563 | 9,69 | ||||
| 2025-08-12 | 13F | Jpmorgan Chase & Co | 111 930 | 5 081,94 | 3 957 | 5 245,95 | ||||
| 2025-08-14 | 13F | Goldman Sachs Group Inc | 0 | −100,00 | 0 | |||||
| 2025-07-14 | 13F | Financial Enhancement Group LLC | 449 497 | −4,38 | 16 110 | 7,39 | ||||
| 2025-07-16 | 13F | Lloyd Advisory Services, LLC. | 7 971 | −3,04 | 282 | 0,00 | ||||
| 2025-08-04 | 13F | Atria Investments Llc | 296 190 | −16,18 | 10 470 | −13,56 | ||||
| 2025-08-13 | 13F | Brown Advisory Inc | 19 122 | 0,00 | 676 | 3,05 | ||||
| 2025-08-14 | 13F | Visionary Wealth Advisors | 6 071 | 215 | ||||||
| 2025-08-12 | 13F | BlackRock, Inc. | 339 | −67,65 | 12 | −68,57 | ||||
| 2025-07-28 | 13F | Axxcess Wealth Management, Llc | 15 092 | −0,28 | 534 | 2,90 | ||||
| 2025-08-11 | 13F | Nations Financial Group Inc, /ia/ /adv | 21 224 | 9,40 | 750 | 12,78 | ||||
| 2025-07-29 | 13F | Goldstein Advisors, LLC | 1 582 738 | 32,03 | 55 950 | 36,15 | ||||
| 2025-08-12 | 13F | Barnes Pettey Financial Advisors, Llc | 29 909 | 85,68 | 1 057 | 91,49 | ||||
| 2025-08-08 | 13F | Adapt Wealth Advisors, Llc | 383 948 | 5,58 | 13 573 | 8,87 | ||||
| 2025-07-09 | 13F | Bruce G. Allen Investments, LLC | 267 | 0,00 | 9 | 0,00 | ||||
| 2025-07-15 | 13F | RVW Wealth, LLC | 965 864 | 20,68 | 34 143 | 24,45 | ||||
| 2025-07-18 | 13F | Truist Financial Corp | 422 790 | 31,86 | 14 946 | 35,97 | ||||
| 2025-05-09 | 13F | Rps Advisory Solutions Llc | 0 | −100,00 | 0 | −100,00 | ||||
| 2025-08-04 | 13F | Ledyard National Bank | 169 577 | −6,99 | 5 995 | −4,10 | ||||
| 2025-08-11 | 13F | NewEdge Wealth, LLC | 30 082 | 1 035 |