Grundläggande statistik
| Institutionella ägare | 220 total, 220 long only, 0 short only, 0 long/short - change of 0,46% MRQ |
| Genomsnittlig portföljallokering | 0.8346 % - change of 19,75% MRQ |
| Institutionella aktier (lång) | 73 853 136 (ex 13D/G) - change of 1,75MM shares 2,42% MRQ |
| Institutionellt värde (lång) | $ 3 174 055 USD ($1000) |
Institutionellt ägande och aktieägare
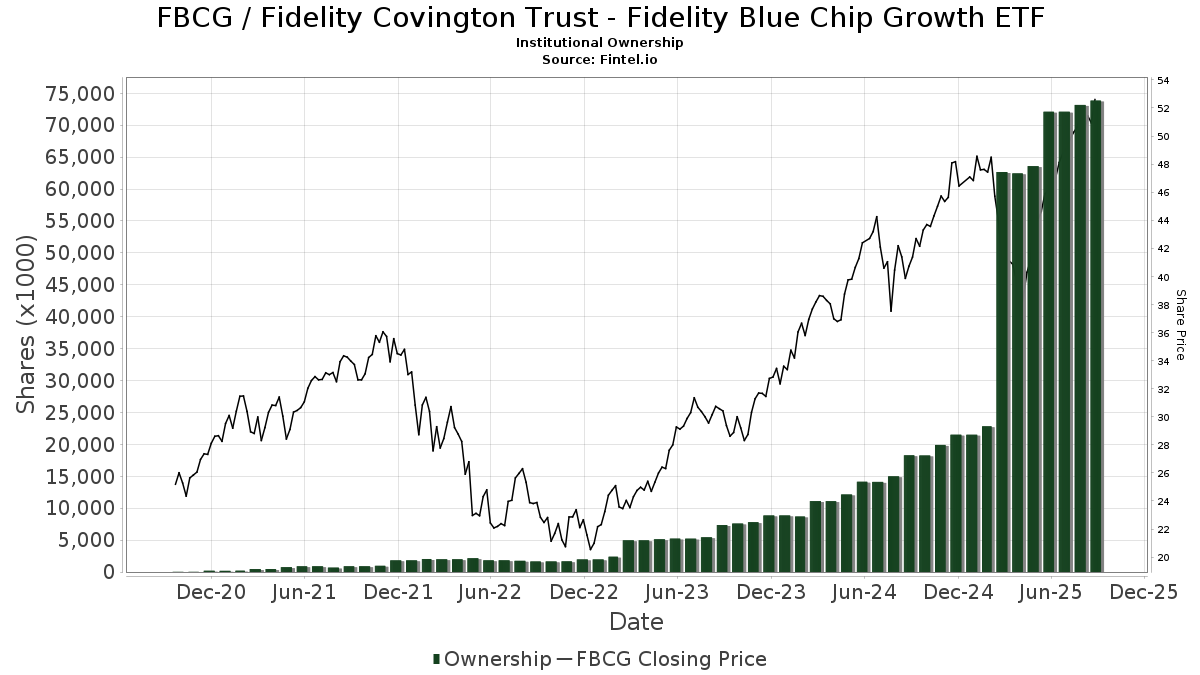
Fidelity Covington Trust - Fidelity Blue Chip Growth ETF (US:FBCG) har 220 Institutionella ägare och aktieägare som har lämnat in 13D/G- eller 13F-formulär till Securities Exchange Commission (SEC). Dessa institut innehar totalt 73,853,136 aktier. Största aktieägare inkluderar Fmr Llc, Jpmorgan Chase & Co, Sagespring Wealth Partners, Llc, Dynasty Wealth Management, Llc, FASMX - Fidelity Asset Manager 50%, FASGX - Fidelity Asset Manager 70%, FAMRX - Fidelity Asset Manager 85%, Commonwealth Equity Services, Llc, FSANX - Fidelity Asset Manager 60%, and Variable Insurance Products Fund V - FundsManager 60% Portfolio Investor Class .
Fidelity Covington Trust - Fidelity Blue Chip Growth ETF (BATS:FBCG) Institutionell ägarstruktur visar institutioners och fonders nuvarande positioner i företaget, samt de senaste förändringarna i positionernas storlek. Större aktieägare kan vara enskilda investerare, fonder, hedgefonder eller institutioner. Bilaga 13D visar att investeraren äger (eller ägde) mer än 5% av företaget och avser (eller avsåg) att aktivt eftersträva en förändring av affärsstrategin. Schedule 13G indikerar en passiv investering på över 5%.
The share price as of September 11, 2025 is 52,63 / share. Previously, on September 12, 2024, the share price was 41,26 / share. This represents an increase of 27,56% over that period.
Fondsentimentets poäng
Fondsentimentet poängen(fka Ägarackumulation-poäng) visar vilka aktier som är mest köpta av fonder. Det är resultatet av en sofistikerad kvantitativ flerfaktormodell som identifierar företag med de högsta nivåerna av institutionell ackumulering. Poängsättningsmodellen använder en kombination av den totala ökningen av redovisade ägare, förändringarna i portföljallokeringarna för dessa ägare och andra mått. Siffran sträcker sig från 0 till 100, där högre siffror indikerar en högre nivå av ackumulering i förhållande till sina konkurrenter, och 50 är genomsnittet.
Uppdateringsfrekvens: Dagligen
Se Ownership Explorer, som innehåller en lista över de högst rankade företagen.
Institutionell sälj/köp-kvot
Förutom att rapportera vanliga eget kapital- och skuldemissioner måste institutioner med mer än 100MM tillgångar under förvaltning också avslöja sina innehav av sälj- och köpoptioner. Eftersom säljoptioner i allmänhet indikerar ett negativt sentiment och köpoptioner indikerar ett positivt sentiment, kan vi få en uppfattning om det övergripande institutionella sentimentet genom att plotta förhållandet mellan säljoptioner och köpoptioner. Diagrammet till höger visar det historiska förhållandet mellan sälj- och köpoptioner för detta instrument.
Genom att använda sälj/köp-kvoten som en indikator på aktieägarnas sentiment undviker man en av de största bristerna med att använda det totala institutionella ägandet, nämligen att en betydande del av de förvaltade tillgångarna investeras passivt för att följa index. Passivt förvaltade fonder köper vanligtvis inte optioner, så indikatorn för sälj/köp-kvoten ger en bättre bild av stämningen i aktivt förvaltade fonder.
13F- och NPORT-arkiveringar
Detaljer om 13F-arkiveringar är gratis. Detaljer om NP-arkiveringar kräver ett premiummedlemskap. Gröna rader indikerar nya positioner. Röda rader indikerar stängda positioner. Klicka på länk symbolen för att se hela transaktionshistoriken.
Uppgradera
för att låsa upp premiumdata och exportera till Excel ![]() .
.
| Fil Datum | Källa | Investerare | Typ | Genomsnittligt pris (beräknat) |
Aktier | Δ Aktier (%) |
Rapporterat värde (1000 USD) |
Δ Värde (%) |
Portföljallokering (%) |
|
|---|---|---|---|---|---|---|---|---|---|---|
| 2025-08-08 | 13F | Foundations Investment Advisors, LLC | 5 926 | 286 | ||||||
| 2025-08-12 | 13F | Jpmorgan Chase & Co | 9 239 076 | −4,61 | 445 693 | 15,13 | ||||
| 2025-07-14 | 13F | McGlone Suttner Wealth Management, Inc. | 28 507 | 0,00 | 1 375 | 20,72 | ||||
| 2025-07-17 | 13F | Janney Montgomery Scott LLC | 158 537 | −1,49 | 8 | 16,67 | ||||
| 2025-07-24 | 13F | Accredited Investor Services, Llc | 439 551 | 2,91 | 21 204 | 24,20 | ||||
| 2025-07-09 | 13F | Keystone Wealth Services, LLC | 94 383 | 4,73 | 4 553 | 26,40 | ||||
| 2025-08-05 | 13F | Plante Moran Financial Advisors, LLC | 0 | −100,00 | 0 | |||||
| 2025-08-14 | 13F | Two Sigma Securities, Llc | 0 | −100,00 | 0 | |||||
| 2025-08-08 | 13F | Capital Investment Advisory Services, LLC | 350 | 0,00 | 17 | 23,08 | ||||
| 2025-08-11 | 13F | United Advisor Group, LLC | 0 | −100,00 | 0 | |||||
| 2025-07-25 | 13F | Investment Advisory Group, LLC | 17 722 | −1,02 | 855 | 19,44 | ||||
| 2025-04-21 | 13F | Nelson, Van Denburg & Campbell Wealth Management Group, LLC | 0 | −100,00 | 0 | |||||
| 2025-07-18 | 13F | First United Bank Trust/ | 250 | 0,00 | 12 | 33,33 | ||||
| 2025-08-14 | 13F | Fmr Llc | 20 584 359 | 2,58 | 992 989 | 23,80 | ||||
| 2025-08-22 | NP | Variable Insurance Products Fund V - FundsManager 30% Portfolio Service Class | 2 360 | 5,55 | 114 | 26,97 | ||||
| 2025-08-22 | NP | Variable Insurance Products Fund V - FundsManager 60% Portfolio Investor Class | 1 726 656 | 3,90 | 83 294 | 25,39 | ||||
| 2025-08-15 | 13F/A | Florida Financial Advisors, Llc | 10 001 | 29,61 | 482 | 56,49 | ||||
| 2025-08-14 | 13F | Stifel Financial Corp | 103 375 | 110,38 | 4 987 | 153,87 | ||||
| 2025-08-07 | 13F | Kestra Private Wealth Services, Llc | 183 734 | −13,49 | 8 863 | 4,41 | ||||
| 2025-07-31 | 13F | MN Wealth Advisors, LLC | 75 087 | 7,15 | 3 622 | 29,31 | ||||
| 2025-08-14 | 13F | Broadleaf Partners, LLC | 136 407 | 14,86 | 6 580 | 38,64 | ||||
| 2025-07-14 | 13F | Sowell Financial Services LLC | 157 832 | 7 614 | ||||||
| 2025-08-14 | 13F | Snowden Capital Advisors LLC | 6 197 | −1,27 | 299 | 19,20 | ||||
| 2025-08-14 | 13F | Menora Mivtachim Holdings Ltd. | 108 710 | 56,53 | 5 244 | 88,97 | ||||
| 2025-08-19 | 13F | Cape Investment Advisory, Inc. | 114 | 0,00 | 6 | 25,00 | ||||
| 2025-08-14 | 13F | UBS Group AG | 874 474 | −6,27 | 42 185 | 13,12 | ||||
| 2025-08-14 | 13F | Susquehanna International Group, Llp | 13 472 | −89,82 | 650 | −87,73 | ||||
| 2025-07-15 | 13F | Avaii Wealth Management, Llc | 20 021 | 35,63 | 966 | 63,56 | ||||
| 2025-07-21 | 13F | Ameritas Advisory Services, LLC | 4 446 | 214 | ||||||
| 2025-08-15 | 13F | Captrust Financial Advisors | 70 408 | 179,45 | 3 396 | 237,24 | ||||
| 2025-08-01 | 13F | Envestnet Asset Management Inc | 723 997 | 25,40 | 34 926 | 51,35 | ||||
| 2025-08-14 | 13F | CoreCap Advisors, LLC | 9 107 | 26,68 | 439 | 52,96 | ||||
| 2025-08-22 | NP | FHLKX - Fidelity Health Savings Fund Class K This fund is a listed as child fund of Fmr Llc and if that institution has disclosed ownership in this security, then these positions will not be double counted when calculating total shares and total value | 14 330 | −7,98 | 691 | 11,09 | ||||
| 2025-08-11 | 13F | Nations Financial Group Inc, /ia/ /adv | 346 598 | 12,30 | 16 720 | 35,54 | ||||
| 2025-05-01 | 13F | Quest 10 Wealth Builders, Inc. | 0 | −100,00 | 0 | |||||
| 2025-05-02 | 13F | Wealthfront Advisers Llc | 0 | −100,00 | 0 | −100,00 | ||||
| 2025-08-06 | 13F | Moors & Cabot, Inc. | 0 | −100,00 | 0 | |||||
| 2025-08-05 | 13F | Sigma Planning Corp | 105 456 | 0,08 | 5 087 | 20,80 | ||||
| 2025-08-13 | 13F | Per Stirling Capital Management, LLC. | 124 476 | −9,93 | 6 005 | 8,71 | ||||
| 2025-08-22 | NP | Variable Insurance Products Fund V - FundsManager 50% Portfolio Investor Class | 797 661 | 3,15 | 38 479 | 24,50 | ||||
| 2025-07-17 | 13F | San Luis Wealth Advisors LLC | 10 878 | 18,26 | 1 | |||||
| 2025-05-15 | 13F/A | Orion Portfolio Solutions, LLC | 8 444 | −39,69 | 338 | −47,91 | ||||
| 2025-07-02 | 13F | Central Pacific Bank - Trust Division | 180 | 0,00 | 9 | 14,29 | ||||
| 2025-09-04 | 13F/A | Advisor Group Holdings, Inc. | 70 394 | 70,85 | 3 389 | 105,77 | ||||
| 2025-07-28 | 13F | Sagespring Wealth Partners, Llc | 6 228 360 | 0,55 | 300 456 | 21,36 | ||||
| 2025-07-25 | 13F | Yarger Wealth Strategies, Llc | 17 206 | 0,00 | 830 | 20,82 | ||||
| 2025-04-08 | 13F | Parallel Advisors, LLC | 0 | −100,00 | 0 | |||||
| 2025-07-02 | 13F | Dentgroup LLC | 68 529 | 157,00 | 3 306 | 210,33 | ||||
| 2025-07-22 | 13F | SOL Capital Management CO | 12 630 | 16,62 | 1 | |||||
| 2025-07-30 | 13F | Advantage Trust Co | 179 751 | 7,59 | 8 671 | 29,86 | ||||
| 2025-08-04 | 13F | Spire Wealth Management | 511 | −1,35 | 25 | 20,00 | ||||
| 2025-08-14 | 13F | Goodwin Investment Advisory | 938 001 | 46,18 | 45 249 | 76,43 | ||||
| 2025-08-15 | 13F | Tower Research Capital LLC (TRC) | 0 | −100,00 | 0 | |||||
| 2025-07-16 | 13F | Kerntke Otto McGlone Wealth Management Group | 12 668 | 16,03 | 611 | 40,14 | ||||
| 2025-07-31 | 13F | Sequent Asset Management, LLC | 31 019 | −0,49 | 1 496 | 20,16 | ||||
| 2025-08-12 | 13F | BlackRock, Inc. | 1 780 | −11,97 | 86 | 6,25 | ||||
| 2025-08-14 | 13F | Clg Llc | 90 057 | 55,36 | 4 344 | 87,56 | ||||
| 2025-08-14 | 13F | GWM Advisors LLC | 20 491 | −11,04 | 988 | 7,39 | ||||
| 2025-08-22 | NP | FASGX - Fidelity Asset Manager 70% This fund is a listed as child fund of Fmr Llc and if that institution has disclosed ownership in this security, then these positions will not be double counted when calculating total shares and total value | 4 076 229 | 1,92 | 196 637 | 23,00 | ||||
| 2025-04-22 | 13F | Synergy Financial Management, LLC | 0 | −100,00 | 0 | |||||
| 2025-08-22 | NP | Variable Insurance Products Fund V - Asset Manager Portfolio Initial Class | 414 236 | 1,39 | 19 983 | 22,37 | ||||
| 2025-08-08 | 13F | Pnc Financial Services Group, Inc. | 110 724 | 11,69 | 5 341 | 34,81 | ||||
| 2025-05-12 | 13F | Condor Capital Management | 0 | −100,00 | 0 | |||||
| 2025-08-14 | 13F | Dagco, Inc. | 1 879 | 0,00 | 91 | 20,00 | ||||
| 2025-07-29 | 13F | AssuredPartners Investment Advisors, LLC | 406 951 | −5,43 | 19 631 | 14,13 | ||||
| 2025-08-05 | 13F | Carolinas Wealth Consulting Llc | 0 | −100,00 | 0 | −100,00 | ||||
| 2025-08-11 | 13F | Elequin Capital Lp | 11 145 | −65,00 | 538 | −57,78 | ||||
| 2025-07-22 | 13F | Unique Wealth, Llc | 369 737 | 20,03 | 17 836 | 44,87 | ||||
| 2025-07-28 | 13F | Mitchell Mcleod Pugh & Williams Inc | 110 479 | 21,83 | 5 330 | 47,05 | ||||
| 2025-04-10 | 13F | Brand Asset Management Group, Inc. | 0 | −100,00 | 0 | |||||
| 2025-07-24 | 13F | Cyndeo Wealth Partners, LLC | 119 094 | 1,07 | 5 745 | 22,00 | ||||
| 2025-07-24 | 13F | Tandem Capital Management Corp /adv | 16 195 | −0,98 | 781 | 19,60 | ||||
| 2025-07-28 | 13F | Variant Private Wealth, LLC | 103 467 | 0,68 | 4 991 | 21,52 | ||||
| 2025-07-18 | 13F | Bartlett & Co. Wealth Management Llc | 355 | 0,00 | 17 | 21,43 | ||||
| 2025-08-04 | 13F | Bay Colony Advisory Group, Inc d/b/a Bay Colony Advisors | 4 177 | 202 | ||||||
| 2025-04-25 | 13F | WASHINGTON TRUST Co | 0 | −100,00 | 0 | |||||
| 2025-07-18 | 13F | Childress Capital Advisors, Llc | 82 590 | 20,59 | 3 984 | 45,56 | ||||
| 2025-08-13 | 13F | IAG Wealth Partners, LLC | 115 | 0,00 | 6 | 25,00 | ||||
| 2025-08-14 | 13F | Atomi Financial Group, Inc. | 0 | −100,00 | 0 | |||||
| 2025-08-13 | 13F | Milestone Investment Advisors LLC | 30 080 | 88,90 | 1 451 | 128,14 | ||||
| 2025-08-13 | 13F | EverSource Wealth Advisors, LLC | 0 | −100,00 | 0 | |||||
| 2025-07-28 | 13F | Mutual Advisors, LLC | 43 461 | 3,60 | 2 174 | 28,20 | ||||
| 2025-08-12 | 13F | Proequities, Inc. | 0 | 0 | ||||||
| 2025-08-13 | 13F | Jones Financial Companies Lllp | 92 004 | 29,66 | 4 420 | 55,33 | ||||
| 2025-07-14 | 13F | Sentinel Pension Advisors Inc | 16 621 | 3,45 | 802 | 24,77 | ||||
| 2025-05-09 | 13F | Pathway Financial Advisers, LLC | 0 | −100,00 | 0 | −100,00 | ||||
| 2025-08-12 | 13F | O'shaughnessy Asset Management, Llc | 1 804 | 1 102,67 | 87 | 1 640,00 | ||||
| 2025-07-16 | 13F/A | CX Institutional | 13 | 0 | ||||||
| 2025-08-08 | 13F | Ogorek Anthony Joseph /ny/ /adv | 1 932 | 0,00 | 0 | |||||
| 2025-08-14 | 13F | Bank Of America Corp /de/ | 1 523 298 | 9,55 | 73 484 | 32,21 | ||||
| 2025-07-23 | 13F | Elm3 Financial Group, LLC | 11 623 | 5,58 | 561 | 27,27 | ||||
| 2025-08-13 | 13F | Summit Wealth Group Llc / Co | 56 921 | 2 746 | ||||||
| 2025-07-31 | 13F | Cambridge Investment Research Advisors, Inc. | 442 839 | 12,22 | 21 | 40,00 | ||||
| 2025-08-08 | 13F | Cetera Investment Advisers | 426 266 | 12,42 | 20 563 | 35,69 | ||||
| 2025-07-16 | 13F | Meridian Financial, LLC | 17 379 | −3,61 | 838 | 16,39 | ||||
| 2025-07-23 | 13F | Clear Creek Financial Management, LLC | 55 733 | 11,08 | 2 689 | 34,06 | ||||
| 2025-08-07 | 13F | McClarren Financial Advisors, Inc. | 0 | −100,00 | 0 | |||||
| 2025-08-12 | 13F | MWA Asset Management | 4 935 | 238 | ||||||
| 2025-07-24 | 13F | IFP Advisors, Inc | 28 846 | −27,18 | 1 392 | −12,13 | ||||
| 2025-07-21 | 13F | Portfolio Strategies, Inc. | 748 753 | 11,07 | 36 118 | 34,05 | ||||
| 2025-07-25 | 13F | Johnson Investment Counsel Inc | 0 | −100,00 | 0 | |||||
| 2025-08-04 | 13F | Adell Harriman & Carpenter Inc | 38 935 | 6,93 | 1 878 | 29,07 | ||||
| 2025-07-28 | 13F | Kiker Wealth Management, LLC | 491 | 24 | ||||||
| 2025-07-01 | 13F | Harbor Investment Advisory, Llc | 6 650 | −2,92 | 321 | 17,22 | ||||
| 2025-08-08 | 13F | Creative Planning | 271 941 | −76,51 | 13 118 | −71,65 | ||||
| 2025-07-18 | 13F | Victrix Investment Advisors | 5 980 | 0,00 | 288 | 20,50 | ||||
| 2025-05-14 | 13F | Renaissance Technologies Llc | 0 | −100,00 | 0 | |||||
| 2025-05-05 | 13F | Transce3nd, LLC | 0 | −100,00 | 0 | |||||
| 2025-07-28 | 13F | Harbour Investments, Inc. | 61 195 | 6,76 | 2 952 | 28,85 | ||||
| 2025-08-13 | 13F | WCG Wealth Advisors LLC | 43 193 | −3,65 | 2 084 | 16,30 | ||||
| 2025-08-14 | 13F | Raymond James Financial Inc | 4 198 | 203 | ||||||
| 2025-07-25 | 13F | Cwm, Llc | 851 538 | 19,05 | 41 | 46,43 | ||||
| 2025-08-22 | NP | Variable Insurance Products Fund V - FundsManager 70% Portfolio Investor Class | 678 009 | 4,29 | 32 707 | 25,87 | ||||
| 2025-08-04 | 13F | Hicks Capital Management Llc | 0 | −100,00 | 0 | |||||
| 2025-07-22 | 13F | Wealthcare Advisory Partners LLC | 7 504 | 6,38 | 362 | 28,47 | ||||
| 2025-08-12 | 13F | GDS Wealth Management | 0 | −100,00 | 0 | |||||
| 2025-08-05 | 13F | Dahring | Cusmano Llc | 107 832 | 20,01 | 5 202 | 44,83 | ||||
| 2025-08-14 | 13F | Wells Fargo & Company/mn | 654 428 | 0,31 | 31 570 | 21,07 | ||||
| 2025-08-08 | 13F | Gts Securities Llc | 23 422 | −78,49 | 1 130 | −74,06 | ||||
| 2025-07-15 | 13F | FLP Wealth Management, LLC | 0 | −100,00 | 0 | −100,00 | ||||
| 2025-08-15 | 13F | CI Private Wealth, LLC | 0 | −100,00 | 0 | |||||
| 2025-08-01 | 13F | Chilton Capital Management Llc | 300 | 0,00 | 14 | 27,27 | ||||
| 2025-05-09 | 13F | Liberty Wealth Management Llc | 42 625 | 290,12 | 325 | −35,64 | ||||
| 2025-08-13 | 13F | Bare Financial Services, Inc | 155 | 0,00 | 7 | 16,67 | ||||
| 2025-07-09 | 13F | Inspirion Wealth Advisors, Llc | 5 343 | 0,00 | 258 | 20,66 | ||||
| 2025-07-22 | 13F | IVC Wealth Advisors LLC | 6 745 | 0,60 | 325 | 21,72 | ||||
| 2025-08-22 | NP | FFNCX - Fidelity Asset Manager 40% Fidelity Advisor Asset Manager 40%: Class C This fund is a listed as child fund of Fmr Llc and if that institution has disclosed ownership in this security, then these positions will not be double counted when calculating total shares and total value | 854 307 | 0,29 | 41 212 | 21,05 | ||||
| 2025-08-14 | 13F | Hrt Financial Lp | 0 | −100,00 | 0 | |||||
| 2025-08-14 | 13F | Jane Street Group, Llc | 6 931 | −98,68 | 334 | −98,41 | ||||
| 2025-08-22 | NP | FASMX - Fidelity Asset Manager 50% This fund is a listed as child fund of Fmr Llc and if that institution has disclosed ownership in this security, then these positions will not be double counted when calculating total shares and total value | 4 379 716 | 1,30 | 211 277 | 22,26 | ||||
| 2025-08-08 | 13F | Larson Financial Group LLC | 6 398 | −13,13 | 309 | 4,76 | ||||
| 2025-08-14 | 13F | Mercer Global Advisors Inc /adv | 0 | −100,00 | 0 | |||||
| 2025-07-29 | 13F | International Assets Investment Management, Llc | 14 337 | 16,78 | 692 | 41,02 | ||||
| 2025-08-12 | 13F | Guerra Advisors Inc | 26 701 | 0,00 | 1 288 | 20,71 | ||||
| 2025-07-10 | 13F | Worth Asset Management, LLC | 4 301 | −39,85 | 207 | −27,37 | ||||
| 2025-07-30 | 13F | LGT Financial Advisors LLC | 11 000 | 0,00 | 531 | 20,73 | ||||
| 2025-08-12 | 13F | PKS Advisory Services, LLC | 86 813 | −20,86 | 4 188 | −4,49 | ||||
| 2025-07-29 | 13F | Salus Financial Advisors, LLC | 216 821 | 23,72 | 10 459 | 49,33 | ||||
| 2025-07-07 | 13F | Centurion Wealth Management LLC | 36 848 | 3,82 | 1 778 | 8,29 | ||||
| 2025-08-14 | 13F | Citadel Advisors Llc | 0 | −100,00 | 0 | |||||
| 2025-07-11 | 13F | Farther Finance Advisors, LLC | 400 | 19 | ||||||
| 2025-07-28 | 13F | BRYN MAWR TRUST Co | 54 | 0,00 | 3 | 0,00 | ||||
| 2025-08-14 | 13F | D. E. Shaw & Co., Inc. | 14 118 | 0,00 | 681 | 20,74 | ||||
| 2025-07-18 | 13F | Truist Financial Corp | 7 798 | −1,87 | 376 | 18,61 | ||||
| 2025-07-14 | 13F | Armstrong Advisory Group, Inc | 1 609 | −2,31 | 78 | 1,32 | ||||
| 2025-08-26 | 13F/A | Thrivent Financial For Lutherans | 1 592 192 | 77 | ||||||
| 2025-04-16 | 13F/A | Western Wealth Management, LLC | 0 | −100,00 | 0 | |||||
| 2025-07-07 | 13F | Roxbury Financial LLC | 90 514 | 3,40 | 4 366 | 10,98 | ||||
| 2025-08-22 | NP | Variable Insurance Products Fund V - FundsManager 20% Portfolio Investor Class | 52 472 | 0,80 | 2 531 | 21,68 | ||||
| 2025-07-25 | 13F | Atria Wealth Solutions, Inc. | 6 090 | −90,37 | 294 | −88,41 | ||||
| 2025-07-17 | 13F | Fifth Third Securities, Inc. | 13 646 | 17,36 | 658 | 41,81 | ||||
| 2025-08-14 | 13F | Qube Research & Technologies Ltd | 0 | −100,00 | 0 | |||||
| 2025-07-24 | 13F | KFA Private Wealth Group, LLC | 848 456 | 1,45 | 40 930 | 22,44 | ||||
| 2025-08-22 | NP | Variable Insurance Products Fund V - Asset Manager Growth Portfolio Investor Class | 169 821 | 2,78 | 8 192 | 24,05 | ||||
| 2025-07-15 | 13F | Centerline Wealth Advisors, LLC | 459 691 | 18,92 | 22 175 | 43,53 | ||||
| 2025-08-22 | NP | FSANX - Fidelity Asset Manager 60% This fund is a listed as child fund of Fmr Llc and if that institution has disclosed ownership in this security, then these positions will not be double counted when calculating total shares and total value | 2 189 221 | 1,78 | 105 608 | 22,85 | ||||
| 2025-08-27 | 13F/A | Brinker Capital Investments, LLC | 18 147 | 114,91 | 875 | 159,64 | ||||
| 2025-08-13 | 13F | Cerity Partners LLC | 0 | −100,00 | 0 | |||||
| 2025-08-12 | 13F | Vestor Capital, Llc | 59 000 | 1 503,26 | 1 | |||||
| 2025-08-08 | 13F | Meridian Wealth Management, LLC | 28 316 | 0,00 | 1 366 | 20,69 | ||||
| 2025-07-30 | 13F | Onyx Bridge Wealth Group LLC | 71 547 | 58,01 | 3 451 | 90,77 | ||||
| 2025-08-14 | 13F | Mml Investors Services, Llc | 1 158 247 | 2,09 | 56 | 22,22 | ||||
| 2025-08-22 | NP | FAMRX - Fidelity Asset Manager 85% This fund is a listed as child fund of Fmr Llc and if that institution has disclosed ownership in this security, then these positions will not be double counted when calculating total shares and total value | 3 118 185 | 2,77 | 150 421 | 24,03 | ||||
| 2025-07-10 | 13F | Global Financial Private Client, LLC | 0 | −100,00 | 0 | |||||
| 2025-08-14 | 13F | Two Sigma Investments, Lp | 622 700 | 45,87 | 30 039 | 76,05 | ||||
| 2025-07-22 | 13F | PUREfi Wealth, LLC | 31 639 | 75,24 | 1 526 | 111,65 | ||||
| 2025-08-05 | 13F | Bank of New York Mellon Corp | 18 163 | 23,21 | 876 | 48,73 | ||||
| 2025-08-08 | 13F | Avantax Advisory Services, Inc. | 408 846 | 21,23 | 19 723 | 46,32 | ||||
| 2025-08-12 | 13F | 17 Capital Partners, Llc | 14 033 | 21,54 | 677 | 46,64 | ||||
| 2025-07-24 | 13F | Stonebridge Financial Group, LLC | 0 | −100,00 | 0 | |||||
| 2025-08-13 | 13F | Capital Analysts, Inc. | 300 369 | 53,30 | 14 | 100,00 | ||||
| 2025-04-23 | 13F | Win Advisors, Inc | 0 | −100,00 | 0 | |||||
| 2025-07-10 | 13F | Wealth Enhancement Advisory Services, Llc | 69 162 | −70,45 | 3 367 | −64,01 | ||||
| 2025-07-31 | 13F | FSM Wealth Advisors, LLC | 11 189 | 540 | ||||||
| 2025-08-07 | 13F | Rollins Financial Advisors, LLC | 67 171 | −18,96 | 3 240 | −2,17 | ||||
| 2025-08-07 | 13F | Resources Investment Advisors, LLC. | 328 306 | 15 837 | ||||||
| 2025-07-24 | 13F | Us Bancorp \de\ | 500 | 24 | ||||||
| 2025-08-15 | 13F | First Heartland Consultants, Inc. | 191 556 | 12,08 | 9 241 | 35,27 | ||||
| 2025-08-11 | 13F | HighTower Advisors, LLC | 344 333 | −29,89 | 16 611 | −15,39 | ||||
| 2025-08-07 | 13F | Traynor Capital Management, Inc. | 24 291 | 35,40 | 1 160 | 61,65 | ||||
| 2025-08-14 | 13F | Ancora Advisors, LLC | 1 085 | 52 | ||||||
| 2025-07-16 | 13F | Essex Financial Services, Inc. | 76 357 | −21,63 | 3 683 | −5,42 | ||||
| 2025-08-12 | 13F | MAI Capital Management | 211 | 0,00 | 10 | 25,00 | ||||
| 2025-08-12 | 13F | J.w. Cole Advisors, Inc. | 244 565 | 47,26 | 11 798 | 77,75 | ||||
| 2025-08-19 | 13F | National Asset Management, Inc. | 52 875 | −6,20 | 2 551 | −2,19 | ||||
| 2025-07-29 | 13F | Sowa Financial Group, Inc. | 550 146 | 15,31 | 27 | 36,84 | ||||
| 2025-08-11 | 13F | Private Advisor Group, LLC | 47 060 | −11,87 | 2 270 | 6,37 | ||||
| 2025-08-13 | 13F | Cary Street Partners Financial Llc | 34 519 | −3,21 | 1 665 | 16,84 | ||||
| 2025-07-23 | 13F | Sachetta, LLC | 25 493 | −5,44 | 1 230 | 14,11 | ||||
| 2025-08-08 | 13F | Mv Capital Management, Inc. | 220 412 | −0,80 | 10 633 | 19,73 | ||||
| 2025-08-15 | 13F | Sugar Maple Asset Management, LLC | 0 | −100,00 | 0 | |||||
| 2025-08-04 | 13F | Assetmark, Inc | 366 | −34,05 | 18 | −22,73 | ||||
| 2025-08-14 | 13F | Wiley Bros.-aintree Capital, Llc | 279 005 | −1,06 | 13 459 | 19,02 | ||||
| 2025-07-31 | 13F | Hobart Private Capital, LLC | 13 683 | −26,34 | 660 | −11,05 | ||||
| 2025-08-13 | 13F | Marshall Wace, Llp | 21 554 | 1 040 | ||||||
| 2025-08-14 | 13F | Certified Advisory Corp | 29 331 | 14,32 | 1 415 | 37,95 | ||||
| 2025-08-13 | 13F | Twin Peaks Wealth Advisors, LLC | 66 | 3 | ||||||
| 2025-08-06 | 13F | Mark Sheptoff Financial Planning, Llc | 599 | −27,83 | 29 | −15,15 | ||||
| 2025-07-30 | 13F | Canvas Wealth Advisors, LLC | 10 426 | 5,01 | 524 | 41,62 | ||||
| 2025-08-06 | 13F | Forbes Financial Planning, Inc. | 81 200 | 3 917 | ||||||
| 2025-08-12 | 13F | LPL Financial LLC | 102 754 | 302,25 | 4 957 | 385,41 | ||||
| 2025-08-14 | 13F | Comerica Bank | 4 826 | −9,10 | 233 | 9,43 | ||||
| 2025-08-13 | 13F | Johnson Financial Group, Inc. | 300 | −39,15 | 14 | −26,32 | ||||
| 2025-07-14 | 13F | Abound Wealth Management | 329 | 0,00 | 16 | 15,38 | ||||
| 2025-08-05 | 13F | Bank Of Montreal /can/ | 1 240 | −25,97 | 60 | −10,61 | ||||
| 2025-08-14 | 13F | Ausdal Financial Partners, Inc. | 6 195 | 23,33 | 299 | 49,00 | ||||
| 2025-07-30 | 13F | Bogart Wealth, LLC | 0 | −100,00 | 0 | |||||
| 2025-08-14 | 13F | Sunbelt Securities, Inc. | 18 645 | −4,62 | 863 | 10,37 | ||||
| 2025-08-06 | 13F | Commonwealth Equity Services, Llc | 2 892 574 | 8,65 | 140 | 31,13 | ||||
| 2025-08-14 | 13F | Mariner, LLC | 170 546 | 6,96 | 8 227 | 29,09 | ||||
| 2025-05-06 | 13F | Proficio Capital Partners LLC | 0 | −100,00 | 0 | |||||
| 2025-07-29 | 13F | Harbor Asset Planning, Inc. | 2 729 | 132 | ||||||
| 2025-07-31 | 13F | LJI Wealth Management, LLC | 9 596 | 0,00 | 463 | 20,63 | ||||
| 2025-08-06 | 13F | AE Wealth Management LLC | 16 455 | 1 027,05 | 794 | 1 267,24 | ||||
| 2025-08-14 | 13F | Investmark Advisory Group LLC | 4 717 | 228 | ||||||
| 2025-08-08 | 13F | Wealth Quarterback LLC | 58 202 | −17,48 | 2 808 | −0,39 | ||||
| 2025-08-13 | 13F | Holos Integrated Wealth LLC | 69 382 | 1,45 | 3 552 | 29,93 | ||||
| 2025-08-04 | 13F | Clear Investment Research, Llc | 22 284 | 2,34 | 1 075 | 23,45 | ||||
| 2025-04-10 | 13F | SMI Advisory Services, LLC | 0 | −100,00 | 0 | |||||
| 2025-08-13 | 13F | Fort Sheridan Advisors Llc | 7 160 | 11,35 | 345 | 34,24 | ||||
| 2025-08-15 | 13F | Kestra Advisory Services, LLC | 187 820 | 5,13 | 9 060 | 26,87 | ||||
| 2025-08-01 | 13F | Schmidt P J Investment Management Inc | 17 744 | 219,60 | 856 | 286,88 | ||||
| 2025-07-30 | 13F | BG Investment Services, Inc. | 151 318 | 9,56 | 7 354 | 33,59 | ||||
| 2025-07-11 | 13F | SILVER OAK SECURITIES, Inc | 5 114 | 2,55 | 247 | 23,62 | ||||
| 2025-08-06 | 13F | Atlantic Union Bankshares Corp | 68 | 3 | ||||||
| 2025-08-08 | 13F | POM Investment Strategies, LLC | 417 | 20 | ||||||
| 2025-08-14 | 13F | Goldman Sachs Group Inc | 14 465 | 698 | ||||||
| 2025-08-04 | 13F | Creative Financial Designs Inc /adv | 756 | 221,70 | 36 | 300,00 | ||||
| 2025-05-12 | 13F | Sandy Spring Bank | 68 | 3 | ||||||
| 2025-07-22 | 13F | Beacon Financial Advisory LLC | 11 300 | 545 | ||||||
| 2025-08-04 | 13F | Arkadios Wealth Advisors | 137 174 | 6 617 | ||||||
| 2025-08-05 | 13F | Dynasty Wealth Management, Llc | 5 507 411 | −17,55 | 265 678 | −0,49 | ||||
| 2025-07-14 | 13F | CRA Financial Services, LLC | 52 896 | 19,91 | 2 552 | 44,70 | ||||
| 2025-08-12 | 13F | Allen Capital Group, LLC | 26 321 | 180,37 | 1 270 | 238,40 | ||||
| 2025-07-15 | 13F | Bfsg, Llc | 127 860 | 3,40 | 6 168 | 24,79 | ||||
| 2025-07-28 | 13F | RFG Advisory, LLC | 239 964 | 11 576 | ||||||
| 2025-08-12 | 13F | Trexquant Investment LP | 6 418 | −14,46 | 310 | 3,34 | ||||
| 2025-07-10 | 13F | Sovran Advisors, LLC | 103 044 | 21,42 | 4 971 | 56,78 | ||||
| 2025-07-17 | 13F | Sound Income Strategies, LLC | 485 | 0,00 | 23 | 21,05 | ||||
| 2025-08-22 | NP | FTANX - Fidelity Asset Manager 30% This fund is a listed as child fund of Fmr Llc and if that institution has disclosed ownership in this security, then these positions will not be double counted when calculating total shares and total value | 576 122 | −1,35 | 27 792 | 19,06 | ||||
| 2025-07-18 | 13F | CHURCHILL MANAGEMENT Corp | 0 | −100,00 | 0 | |||||
| 2025-08-13 | 13F | Russell Investments Group, Ltd. | 105 | −93,48 | 5 | −92,19 | ||||
| 2025-07-23 | 13F | Sax Wealth Advisors, Llc | 106 797 | 28,25 | 5 152 | 54,78 | ||||
| 2025-07-15 | 13F | Wealth Effects Llc | 9 761 | −2,98 | 471 | 16,92 | ||||
| 2025-07-25 | 13F | Northwest Capital Management Inc | 1 068 | 52 | ||||||
| 2025-07-29 | 13F | Quotient Wealth Partners, LLC | 48 937 | 12,88 | 2 361 | 36,26 | ||||
| 2025-07-25 | 13F | LRI Investments, LLC | 200 | 0,00 | 10 | 28,57 | ||||
| 2025-08-14 | 13F | Royal Bank Of Canada | 2 110 | 0,33 | 102 | 21,43 | ||||
| 2025-08-22 | NP | Variable Insurance Products Fund V - FundsManager 40% Portfolio Service Class | 5 234 | 41,42 | 252 | 71,43 | ||||
| 2025-08-22 | NP | FASIX - Fidelity Asset Manager 20% This fund is a listed as child fund of Fmr Llc and if that institution has disclosed ownership in this security, then these positions will not be double counted when calculating total shares and total value | 1 163 045 | −3,87 | 56 105 | 16,03 | ||||
| 2025-08-22 | NP | Variable Insurance Products Fund V - Target Volatility Portfolio Service Class | 39 901 | −3,05 | 1 925 | 16,96 | ||||
| 2025-08-14 | 13F | Colony Group, LLC | 511 044 | −2,14 | 24 653 | 18,11 | ||||
| 2025-07-08 | 13F | Advance Capital Management, Inc. | 0 | −100,00 | 0 | −100,00 | ||||
| 2025-08-22 | NP | Variable Insurance Products Fund V - FundsManager 85% Portfolio Investor Class | 346 594 | 3,81 | 16 720 | 25,28 | ||||
| 2025-07-21 | 13F | Fairvoy Private Wealth, LLC | 30 347 | −9,44 | 1 464 | 9,26 | ||||
| 2025-08-07 | 13F | CENTRAL TRUST Co | 112 869 | −0,53 | 5 445 | 20,04 | ||||
| 2025-08-13 | 13F | Northern Trust Corp | 9 080 | 0,00 | 438 | 20,99 | ||||
| 2025-08-15 | 13F | Morgan Stanley | 947 790 | −15,37 | 45 721 | 2,14 | ||||
| 2025-08-11 | 13F | Principal Securities, Inc. | 23 181 | 405,25 | 1 118 | 427,36 | ||||
| 2025-07-16 | 13F | Castleview Partners, Llc | 8 961 | 432 | ||||||
| 2025-08-13 | 13F | Northwestern Mutual Wealth Management Co | 622 816 | 21,43 | 30 045 | 46,55 | ||||
| 2025-08-07 | 13F | Vise Technologies, Inc. | 0 | −100,00 | 0 | −100,00 |