Grundläggande statistik
| Institutionella ägare | 180 total, 180 long only, 0 short only, 0 long/short - change of 7,78% MRQ |
| Genomsnittlig portföljallokering | 0.3770 % - change of −16,85% MRQ |
| Institutionella aktier (lång) | 30 321 046 (ex 13D/G) - change of 0,47MM shares 1,58% MRQ |
| Institutionellt värde (lång) | $ 664 398 USD ($1000) |
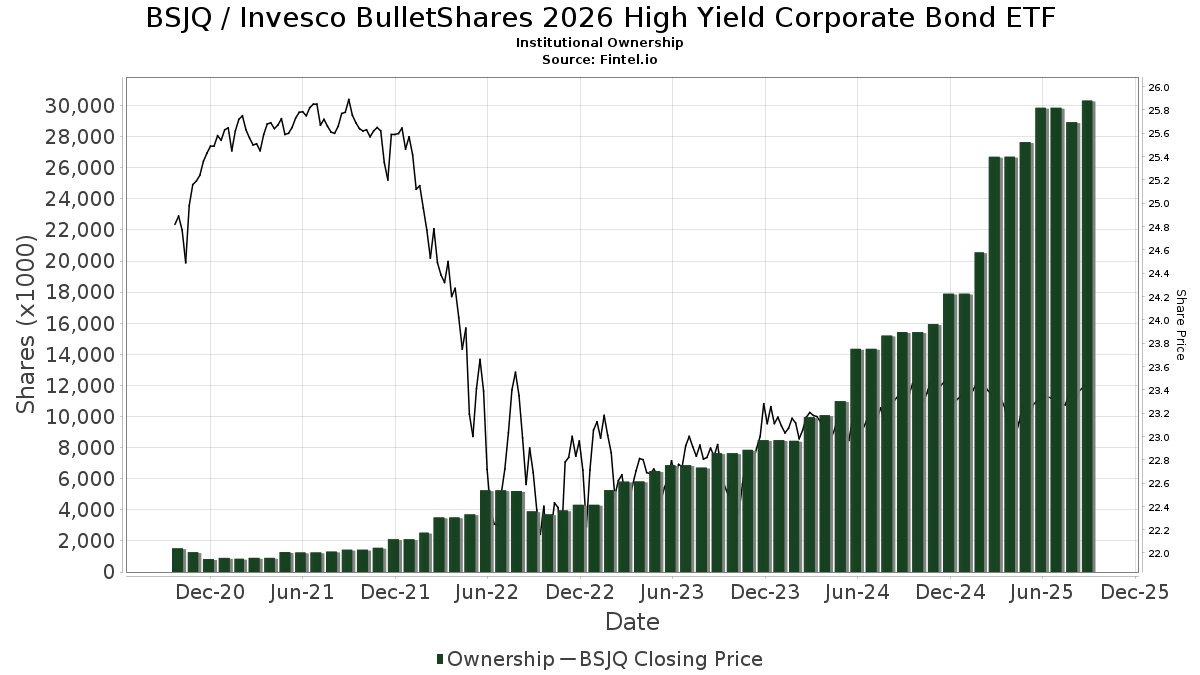
Institutionellt ägande och aktieägare
Invesco BulletShares 2026 High Yield Corporate Bond ETF (US:BSJQ) har 180 Institutionella ägare och aktieägare som har lämnat in 13D/G- eller 13F-formulär till Securities Exchange Commission (SEC). Dessa institut innehar totalt 30,321,046 aktier. Största aktieägare inkluderar UBS Group AG, Mirador Capital Partners LP, Raymond James Financial Inc, Morgan Stanley, LPL Financial LLC, Cetera Investment Advisers, Ashton Thomas Private Wealth, LLC, Wells Fargo & Company/mn, Jaffetilchin Investment Partners, LLC, and Legacy Financial Group LLC .
Invesco BulletShares 2026 High Yield Corporate Bond ETF (NasdaqGM:BSJQ) Institutionell ägarstruktur visar institutioners och fonders nuvarande positioner i företaget, samt de senaste förändringarna i positionernas storlek. Större aktieägare kan vara enskilda investerare, fonder, hedgefonder eller institutioner. Bilaga 13D visar att investeraren äger (eller ägde) mer än 5% av företaget och avser (eller avsåg) att aktivt eftersträva en förändring av affärsstrategin. Schedule 13G indikerar en passiv investering på över 5%.
The share price as of September 15, 2025 is 23,50 / share. Previously, on September 16, 2024, the share price was 23,50 / share. This represents an increase of 0,02% over that period.
Fondsentimentets poäng
Fondsentimentet poängen(fka Ägarackumulation-poäng) visar vilka aktier som är mest köpta av fonder. Det är resultatet av en sofistikerad kvantitativ flerfaktormodell som identifierar företag med de högsta nivåerna av institutionell ackumulering. Poängsättningsmodellen använder en kombination av den totala ökningen av redovisade ägare, förändringarna i portföljallokeringarna för dessa ägare och andra mått. Siffran sträcker sig från 0 till 100, där högre siffror indikerar en högre nivå av ackumulering i förhållande till sina konkurrenter, och 50 är genomsnittet.
Uppdateringsfrekvens: Dagligen
Se Ownership Explorer, som innehåller en lista över de högst rankade företagen.
Institutionell sälj/köp-kvot
Förutom att rapportera vanliga eget kapital- och skuldemissioner måste institutioner med mer än 100MM tillgångar under förvaltning också avslöja sina innehav av sälj- och köpoptioner. Eftersom säljoptioner i allmänhet indikerar ett negativt sentiment och köpoptioner indikerar ett positivt sentiment, kan vi få en uppfattning om det övergripande institutionella sentimentet genom att plotta förhållandet mellan säljoptioner och köpoptioner. Diagrammet till höger visar det historiska förhållandet mellan sälj- och köpoptioner för detta instrument.
Genom att använda sälj/köp-kvoten som en indikator på aktieägarnas sentiment undviker man en av de största bristerna med att använda det totala institutionella ägandet, nämligen att en betydande del av de förvaltade tillgångarna investeras passivt för att följa index. Passivt förvaltade fonder köper vanligtvis inte optioner, så indikatorn för sälj/köp-kvoten ger en bättre bild av stämningen i aktivt förvaltade fonder.
13F- och NPORT-arkiveringar
Detaljer om 13F-arkiveringar är gratis. Detaljer om NP-arkiveringar kräver ett premiummedlemskap. Gröna rader indikerar nya positioner. Röda rader indikerar stängda positioner. Klicka på länk symbolen för att se hela transaktionshistoriken.
Uppgradera
för att låsa upp premiumdata och exportera till Excel ![]() .
.
| Fil Datum | Källa | Investerare | Typ | Genomsnittligt pris (beräknat) |
Aktier | Δ Aktier (%) |
Rapporterat värde (1000 USD) |
Δ Värde (%) |
Portföljallokering (%) |
|
|---|---|---|---|---|---|---|---|---|---|---|
| 2025-08-18 | 13F | Geneos Wealth Management Inc. | 57 375 | 4,34 | 1 339 | 4,94 | ||||
| 2025-07-14 | 13F | CRA Financial Services, LLC | 15 572 | 10,83 | 363 | 11,69 | ||||
| 2025-08-08 | 13F | Larson Financial Group LLC | 568 763 | 0,32 | 13 269 | 0,93 | ||||
| 2025-07-11 | 13F | Farther Finance Advisors, LLC | 12 952 | 302 | ||||||
| 2025-08-06 | 13F | AE Wealth Management LLC | 286 | 0,00 | 7 | 0,00 | ||||
| 2025-08-15 | 13F | Kestra Advisory Services, LLC | 80 185 | 4,09 | 1 871 | 4,70 | ||||
| 2025-08-14 | 13F | Integrated Wealth Concepts LLC | 177 751 | −8,28 | 4 147 | −7,74 | ||||
| 2025-05-06 | 13F | VSM Wealth Advisory, LLC | 0 | −100,00 | 0 | |||||
| 2025-07-18 | 13F | Ledgewood Wealth Advisors, LLC | 54 485 | 0,23 | 1 271 | 0,87 | ||||
| 2025-07-15 | 13F | Retirement Guys Formula Llc | 11 771 | −3,29 | 275 | −2,84 | ||||
| 2025-08-01 | 13F | Envestnet Asset Management Inc | 683 504 | −0,53 | 15 946 | 0,07 | ||||
| 2025-08-13 | 13F | VestGen Advisors, LLC | 28 665 | 1,02 | 669 | 1,67 | ||||
| 2025-08-05 | 13F | Pacific Wealth Strategies Group, Inc. | 100 717 | 29,95 | 2 349 | 30,66 | ||||
| 2025-08-12 | 13F | Proequities, Inc. | 0 | 0 | ||||||
| 2025-08-14 | 13F | Arete Wealth Advisors, LLC | 13 013 | 0,00 | 0 | |||||
| 2025-08-12 | 13F | Fca Corp /tx | 50 612 | 2,45 | 1 181 | 3,06 | ||||
| 2025-05-12 | 13F | Independent Advisor Alliance | 0 | −100,00 | 0 | |||||
| 2025-08-08 | 13F | Cetera Investment Advisers | 1 353 088 | −3,26 | 31 568 | −2,68 | ||||
| 2025-08-05 | 13F | Bank Of Montreal /can/ | 0 | −100,00 | 0 | |||||
| 2025-07-21 | 13F | Ameritas Advisory Services, LLC | 1 047 | 24 | ||||||
| 2025-08-11 | 13F | Aptus Capital Advisors, LLC | 2 021 | 0,00 | 47 | 2,17 | ||||
| 2025-09-04 | 13F/A | Advisor Group Holdings, Inc. | 547 041 | 57,10 | 12 763 | 58,06 | ||||
| 2025-08-04 | 13F | Atria Investments Llc | 372 870 | 8 699 | ||||||
| 2025-04-17 | 13F | Rebalance, Llc | 0 | −100,00 | 0 | |||||
| 2025-07-28 | 13F | Harbour Investments, Inc. | 0 | −100,00 | 0 | |||||
| 2025-08-14 | 13F | Warren Averett Asset Management, LLC | 8 979 | 3,89 | 209 | 4,50 | ||||
| 2025-07-31 | 13F | Glass Jacobson Investment Advisors llc | 106 229 | 41,00 | 2 478 | 41,36 | ||||
| 2025-07-17 | 13F | Janney Montgomery Scott LLC | 26 230 | −12,93 | 1 | |||||
| 2025-07-22 | 13F | Siligmueller & Norvid Wealth Advisors LLC | 12 725 | −46,12 | 297 | −45,70 | ||||
| 2025-07-24 | 13F | Eastern Bank | 313 | 0,00 | 7 | 0,00 | ||||
| 2025-08-14 | 13F | Ameriprise Financial Inc | 166 255 | 4,51 | 3 879 | 5,12 | ||||
| 2025-08-06 | 13F | Valtinson Bruner Financial Planning LLC | 17 357 | 2,80 | 405 | 3,32 | ||||
| 2025-08-13 | 13F | Northwestern Mutual Wealth Management Co | 3 809 | 0,00 | 89 | 0,00 | ||||
| 2025-08-11 | 13F | Shufro Rose & Co Llc | 20 500 | 0,00 | 475 | 0,00 | ||||
| 2025-08-14 | 13F | Diversify Advisory Services, LLC | 8 955 | −8,99 | 210 | −8,33 | ||||
| 2025-07-17 | 13F | HB Wealth Management, LLC | 29 869 | 697 | ||||||
| 2025-08-01 | 13F | Advisory Alpha, LLC | 422 336 | 15,29 | 9 853 | 15,99 | ||||
| 2025-07-09 | 13F | Dynamic Advisor Solutions LLC | 8 751 | −9,21 | 204 | −8,52 | ||||
| 2025-08-13 | 13F | Quadrature Capital Ltd | 37 449 | 874 | ||||||
| 2025-08-15 | 13F | Global View Capital Management LLC | 0 | −100,00 | 0 | |||||
| 2025-08-12 | 13F | J.w. Cole Advisors, Inc. | 29 635 | −6,47 | 691 | −5,86 | ||||
| 2025-08-07 | 13F | Northwest Bancshares, Inc. | 93 928 | 1,17 | 2 191 | 1,76 | ||||
| 2025-07-25 | 13F | Atria Wealth Solutions, Inc. | 53 655 | −33,20 | 1 252 | −32,81 | ||||
| 2025-08-14 | 13F | Comerica Bank | 16 296 | 3,17 | 380 | 3,83 | ||||
| 2025-07-21 | 13F | Empirical Financial Services, LLC d.b.a. Empirical Wealth Management | 32 356 | 2,42 | 755 | 3,01 | ||||
| 2025-07-10 | 13F | Voisard Asset Management Group, Inc. | 20 907 | 8,23 | 488 | 8,95 | ||||
| 2025-08-06 | 13F | Prospera Financial Services Inc | 161 951 | 2,61 | 3 778 | 3,22 | ||||
| 2025-08-13 | 13F | Capital Analysts, Inc. | 40 397 | 0,58 | 1 | |||||
| 2025-07-23 | 13F | WESPAC Advisors, LLC | 12 410 | 0,00 | 290 | 0,70 | ||||
| 2025-07-11 | 13F | Meriwether Wealth & Planning, LLC | 25 258 | 3,33 | 589 | 4,06 | ||||
| 2025-08-06 | 13F | Atlantic Union Bankshares Corp | 10 450 | 10,79 | 244 | 11,47 | ||||
| 2025-08-15 | 13F | Morgan Stanley | 1 522 131 | −3,69 | 35 511 | −3,11 | ||||
| 2025-08-12 | 13F | SRS Capital Advisors, Inc. | 416 | 10 | ||||||
| 2025-07-25 | 13F | Iron Financial, LLC | 25 719 | 0,59 | 600 | 1,35 | ||||
| 2025-07-07 | 13F | Horizons Wealth Management | 112 815 | 1,80 | 2 632 | 2,41 | ||||
| 2025-08-14 | 13F | UBS Group AG | 2 331 214 | 3,80 | 54 387 | 4,42 | ||||
| 2025-08-05 | 13F | Summit Investment Advisory Services, LLC | 275 372 | 6 424 | ||||||
| 2025-08-13 | 13F | MONECO Advisors, LLC | 19 691 | −16,06 | 459 | −15,62 | ||||
| 2025-08-11 | 13F | Principal Securities, Inc. | 6 284 | 27,52 | 147 | 28,07 | ||||
| 2025-08-15 | 13F | Equitable Holdings, Inc. | 37 579 | −7,65 | 877 | −7,10 | ||||
| 2025-08-14 | 13F | CoreCap Advisors, LLC | 8 340 | 0,00 | 195 | 0,52 | ||||
| 2025-07-17 | 13F | Nelson, Van Denburg & Campbell Wealth Management Group, LLC | 343 851 | 2,74 | 8 022 | 3,36 | ||||
| 2025-08-14 | 13F | IHT Wealth Management, LLC | 236 273 | 2,34 | 5 512 | 2,97 | ||||
| 2025-07-28 | 13F | RFG Advisory, LLC | 15 300 | −5,69 | 357 | −5,32 | ||||
| 2025-08-01 | 13F | Koss-Olinger Consulting, LLC | 16 687 | −6,44 | 389 | −6,04 | ||||
| 2025-08-18 | 13F | Tyler-Stone Wealth Management | 284 051 | 22,05 | 6 627 | 22,77 | ||||
| 2025-07-23 | 13F | Ironwood Financial, llc | 466 126 | 0,00 | 10 809 | 0,00 | ||||
| 2025-07-08 | 13F | Ballew Advisors, Inc | 42 049 | 0,00 | 982 | 1,87 | ||||
| 2025-08-13 | 13F | Brown Advisory Inc | 45 180 | 4,50 | 1 054 | 5,19 | ||||
| 2025-08-14 | 13F | Diversify Wealth Management, Llc | 23 818 | 557 | ||||||
| 2025-08-04 | 13F | AlphaStar Capital Management, LLC | 21 009 | 2,78 | 490 | 3,59 | ||||
| 2025-08-12 | 13F | NFP Retirement, Inc. | 45 879 | 3,40 | 1 070 | 4,09 | ||||
| 2025-07-31 | 13F | Topsail Wealth Management, LLC | 0 | −100,00 | 0 | |||||
| 2025-07-03 | 13F | Collective Family Office Llc | 329 478 | 34,54 | 7 687 | 35,34 | ||||
| 2025-08-12 | 13F | Global Retirement Partners, LLC | 2 796 | 0,00 | 65 | 0,00 | ||||
| 2025-07-22 | 13F | McElhenny Sheffield Capital Management, LLC | 2 000 | 210 | ||||||
| 2025-08-14 | 13F | GWM Advisors LLC | 62 655 | −4,25 | 1 462 | −3,69 | ||||
| 2025-08-07 | 13F | Hennion & Walsh Asset Management, Inc. | 30 795 | −4,24 | 718 | −3,62 | ||||
| 2025-07-29 | 13F | Stephens Inc /ar/ | 24 402 | −27,15 | 569 | −26,68 | ||||
| 2025-08-11 | 13F | TD Waterhouse Canada Inc. | 59 268 | 70,31 | 1 381 | 70,70 | ||||
| 2025-05-07 | 13F | Vista Private Wealth Partners. LLC | 0 | −100,00 | 0 | |||||
| 2025-08-12 | 13F | Kaye Capital Management | 0 | −100,00 | 0 | |||||
| 2025-08-06 | 13F | Summit Investment Advisors, Inc. | 282 006 | 4,47 | 6 574 | 4,77 | ||||
| 2025-08-13 | 13F | Jones Financial Companies Lllp | 152 060 | 12,04 | 3 545 | 12,68 | ||||
| 2025-07-17 | 13F | Chatham Capital Group, Inc. | 17 000 | 0,00 | 397 | 0,51 | ||||
| 2025-08-11 | 13F | Private Advisor Group, LLC | 151 659 | 7,08 | 3 538 | 7,73 | ||||
| 2025-07-31 | 13F | Insight Wealth Partners, LLC | 24 586 | −95,70 | 574 | −95,68 | ||||
| 2025-08-19 | 13F | Asset Dedication, LLC | 3 950 | 92 | ||||||
| 2025-07-31 | 13F | Carnegie Capital Asset Management, LLC | 49 615 | −6,01 | 1 158 | −3,42 | ||||
| 2025-08-11 | 13F | Cornerstone Planning Group LLC | 87 | 2 | ||||||
| 2025-07-16 | 13F | Meridian Financial, LLC | 9 469 | 0,00 | 221 | 0,46 | ||||
| 2025-08-27 | 13F/A | Brinker Capital Investments, LLC | 57 935 | 11,68 | 1 352 | 12,30 | ||||
| 2025-08-08 | 13F | Intrua Financial, LLC | 236 040 | −2,69 | 5 507 | −2,12 | ||||
| 2025-08-15 | 13F | WFA of San Diego, LLC | 1 810 | 2 029,41 | 42 | 4 100,00 | ||||
| 2025-07-08 | 13F | Atwood & Palmer Inc | 1 000 | 0,00 | 23 | 0,00 | ||||
| 2025-07-17 | 13F | Wolff Wiese Magana Llc | 129 | −25,86 | 3 | −25,00 | ||||
| 2025-07-17 | 13F | Independence Bank of Kentucky | 101 | 0,00 | 2 | 0,00 | ||||
| 2025-04-21 | 13F | Beacon Capital Management, LLC | 0 | −100,00 | 0 | −100,00 | ||||
| 2025-07-15 | 13F | Legacy Financial Group LLC | 722 580 | −4,74 | 16 858 | −4,17 | ||||
| 2025-08-13 | 13F | Lido Advisors, LLC | 85 535 | 117,47 | 1 996 | 118,75 | ||||
| 2025-08-08 | 13F | Avantax Advisory Services, Inc. | 54 233 | −0,44 | 1 265 | 0,16 | ||||
| 2025-07-09 | 13F | Mirador Capital Partners LP | 2 075 834 | 29,65 | 48 429 | 30,43 | ||||
| 2025-07-21 | 13F | Old Second National Bank Of Aurora | 210 756 | 6,22 | 4 917 | 6,85 | ||||
| 2025-07-29 | 13F | Private Trust Co Na | 9 713 | 94,42 | 227 | 96,52 | ||||
| 2025-07-17 | 13F | E Six Thirteen, Llc | 94 964 | −0,01 | 2 216 | 0,59 | ||||
| 2025-08-01 | 13F | MorganRosel Wealth Management, LLC | 5 510 | 0,00 | 129 | 0,79 | ||||
| 2025-08-26 | 13F/A | Thrivent Financial For Lutherans | 33 783 | 168,61 | 1 | |||||
| 2025-08-01 | 13F | Delta Investment Management, LLC | 484 033 | 49,79 | 11 292 | 50,70 | ||||
| 2025-07-08 | 13F | Gradient Investments LLC | 33 136 | 2,88 | 773 | 3,62 | ||||
| 2025-07-22 | 13F | Net Worth Advisory Group | 17 867 | 23,10 | 417 | 23,81 | ||||
| 2025-08-14 | 13F | Kovitz Investment Group Partners, LLC | 167 926 | 3 918 | ||||||
| 2025-08-14 | 13F | Goldman Sachs Group Inc | 29 496 | 688 | ||||||
| 2025-07-08 | 13F | FF Advisors,LLC | 22 250 | 0,00 | 519 | 0,39 | ||||
| 2025-07-25 | 13F | We Are One Seven, LLC | 49 890 | 27,13 | 1 164 | 27,80 | ||||
| 2025-05-15 | 13F/A | Orion Portfolio Solutions, LLC | 51 876 | 0,37 | 1 203 | 0,00 | ||||
| 2025-09-15 | 13F/A | Migdal Insurance & Financial Holdings Ltd. | 488 549 | 2 185,72 | 11 | |||||
| 2025-08-12 | 13F | BlackRock, Inc. | 19 042 | −14,95 | 444 | −14,45 | ||||
| 2025-08-07 | 13F | Private Advisory Group LLC | 21 015 | −4,35 | 490 | −3,73 | ||||
| 2025-08-14 | 13F | Wilkins Miller Wealth Management, LLC | 34 827 | −5,37 | 813 | −4,81 | ||||
| 2025-08-14 | 13F | Royal Bank Of Canada | 87 631 | −46,28 | 2 045 | −45,94 | ||||
| 2025-07-29 | 13F | Werba Rubin Papier Wealth Management | 61 696 | 0,18 | 1 439 | 0,77 | ||||
| 2025-07-23 | 13F | Friedenthal Financial | 8 032 | −2,81 | 187 | −2,09 | ||||
| 2025-07-09 | 13F | Sarver Vrooman Wealth Advisors | 1 227 | 0,00 | 29 | 0,00 | ||||
| 2025-08-08 | 13F | Foundations Investment Advisors, LLC | 139 695 | 7,35 | 3 259 | 8,02 | ||||
| 2025-08-14 | 13F | Citadel Advisors Llc | 29 724 | 693 | ||||||
| 2025-07-29 | 13F | BXM Wealth LLC | 20 384 | 29,35 | 476 | 30,14 | ||||
| 2025-08-07 | 13F | 49 Wealth Management, Llc | 146 828 | 1,88 | 3 425 | 2,48 | ||||
| 2025-07-10 | 13F | Wealth Enhancement Advisory Services, Llc | 37 637 | −15,96 | 879 | −15,41 | ||||
| 2025-07-28 | 13F | Mutual Advisors, LLC | 14 633 | −3,28 | 341 | −2,86 | ||||
| 2025-08-14 | 13F | Jane Street Group, Llc | 104 904 | −65,54 | 2 447 | −65,34 | ||||
| 2025-07-11 | 13F | AA Financial Advisors, LLC | 70 627 | 2,68 | 1 648 | 3,26 | ||||
| 2025-08-14 | 13F | Wells Fargo & Company/mn | 1 052 414 | −0,64 | 24 553 | −0,04 | ||||
| 2025-07-10 | 13F | Sovran Advisors, LLC | 0 | −100,00 | 0 | |||||
| 2025-07-15 | 13F | BCS Wealth Management | 9 967 | 0 | ||||||
| 2025-05-12 | 13F | C2P Capital Advisory Group, LLC d.b.a. Prosperity Capital Advisors | 0 | −100,00 | 0 | −100,00 | ||||
| 2025-07-29 | 13F | Mattson Financial Services, LLC | 0 | −100,00 | 0 | |||||
| 2025-08-14 | 13F | TCG Advisory Services, LLC | 170 492 | −7,25 | 3 978 | −6,69 | ||||
| 2025-08-12 | 13F | Steward Partners Investment Advisory, Llc | 15 684 | −77,92 | 366 | −77,84 | ||||
| 2025-08-07 | 13F | SFE Investment Counsel | 316 978 | −2,63 | 7 395 | −2,04 | ||||
| 2025-07-25 | 13F | Cwm, Llc | 439 721 | −10,85 | 10 | −9,09 | ||||
| 2025-08-13 | 13F | RPg Family Wealth Advisory, LLC | 159 685 | 5,29 | 3 725 | 5,91 | ||||
| 2025-07-22 | 13F | 4Thought Financial Group Inc. | 20 993 | −3,05 | 490 | −2,59 | ||||
| 2025-07-30 | 13F | Brookstone Capital Management | 26 153 | −11,52 | 610 | −10,95 | ||||
| 2025-08-06 | 13F | Commonwealth Equity Services, Llc | 282 299 | 13,56 | 7 | 20,00 | ||||
| 2025-07-14 | 13F | Sound Stewardship, LLC | 50 740 | 1,10 | 1 184 | 1,72 | ||||
| 2025-07-31 | 13F | Cambridge Investment Research Advisors, Inc. | 44 299 | 41,85 | 1 | |||||
| 2025-08-14 | 13F | Fmr Llc | 568 | 175,73 | 13 | 225,00 | ||||
| 2025-08-15 | 13F | Captrust Financial Advisors | 18 997 | −92,92 | 443 | −92,88 | ||||
| 2025-07-08 | 13F | S.E.E.D. Planning Group LLC | 72 794 | 4,53 | 1 698 | 5,20 | ||||
| 2025-07-31 | 13F | United Community Bank | 2 200 | 0,00 | 51 | 0,00 | ||||
| 2025-07-21 | 13F | AIFG Consultants Ltd. | 0 | −100,00 | 0 | |||||
| 2025-07-29 | 13F | Stratos Wealth Partners, LTD. | 10 637 | 21,50 | 248 | 22,17 | ||||
| 2025-07-10 | 13F | Sterling Financial Group, Inc. | 0 | −100,00 | 0 | |||||
| 2025-07-24 | 13F | Vantage Point Financial LLC | 70 807 | −0,37 | 1 652 | 0,18 | ||||
| 2025-08-01 | 13F | Ashton Thomas Private Wealth, LLC | 1 082 054 | −3,68 | 25 244 | −3,10 | ||||
| 2025-07-24 | 13F | Leo Wealth, LLC | 252 279 | 5 886 | ||||||
| 2025-08-05 | 13F | Key FInancial Inc | 46 168 | 0,00 | 1 077 | 0,65 | ||||
| 2025-08-11 | 13F | United Capital Financial Advisers, Llc | 347 693 | −3,06 | 8 112 | −2,48 | ||||
| 2025-07-14 | 13F | GAMMA Investing LLC | 11 619 | −74,02 | 271 | −73,87 | ||||
| 2025-07-31 | 13F | Richards, Merrill & Peterson, Inc. | 1 783 | 0,00 | 42 | 0,00 | ||||
| 2025-08-14 | 13F | Mariner, LLC | 373 124 | 8 705 | ||||||
| 2025-07-23 | 13F | Evexia Wealth Llc | 127 384 | −10,88 | 2 982 | −9,47 | ||||
| 2025-07-21 | 13F | Ashton Thomas Securities, Llc | 7 266 | −1,77 | 170 | −1,17 | ||||
| 2025-08-13 | 13F | Alerus Financial Na | 2 570 | 60 | ||||||
| 2025-08-12 | 13F | Jaffetilchin Investment Partners, LLC | 823 523 | 1,10 | 19 213 | 1,71 | ||||
| 2025-08-12 | 13F | Absolute Capital Management, LLC | 40 476 | −7,47 | 944 | −6,90 | ||||
| 2025-08-14 | 13F | Stifel Financial Corp | 97 070 | 5,44 | 2 265 | 6,09 | ||||
| 2025-08-07 | 13F | Allworth Financial LP | 52 787 | 0,00 | 1 232 | 0,98 | ||||
| 2025-08-11 | 13F | CBIZ Investment Advisory Services, LLC | 484 | 1,68 | 11 | 0,00 | ||||
| 2025-08-14 | 13F | Bank Of America Corp /de/ | 422 772 | 0,81 | 9 863 | 1,42 | ||||
| 2025-08-12 | 13F | Horizon Financial Services, Llc | 8 988 | −1,44 | 210 | −0,95 | ||||
| 2025-08-14 | 13F | Atomi Financial Group, Inc. | 138 964 | 86,56 | 3 242 | 87,72 | ||||
| 2025-07-11 | 13F | Quad-Cities Investment Group, LLC | 17 839 | 1,54 | 416 | 2,21 | ||||
| 2025-08-12 | 13F | Jpmorgan Chase & Co | 0 | −100,00 | 0 | |||||
| 2025-08-11 | 13F | Oder Investment Management, LLC | 196 528 | 7,29 | 4 585 | 7,55 | ||||
| 2025-07-31 | 13F | Strait & Sound Wealth Management LLC | 63 678 | 38,04 | 1 486 | 38,91 | ||||
| 2025-08-13 | 13F | Stablepoint Partners, LLC | 150 244 | 7,23 | 3 505 | 7,88 | ||||
| 2025-07-24 | 13F | IFP Advisors, Inc | 0 | −100,00 | 0 | −100,00 | ||||
| 2025-07-17 | 13F | Camelot Portfolios, LLC | 105 806 | −5,85 | 2 468 | −5,30 | ||||
| 2025-08-14 | 13F | Raymond James Financial Inc | 1 558 291 | −28,13 | 36 355 | −27,69 | ||||
| 2025-08-06 | 13F | Altrius Capital Management Inc | 63 468 | −5,98 | 1 481 | −5,43 | ||||
| 2025-07-21 | 13F | Segment Wealth Management, LLC | 57 422 | −1,91 | 1 340 | −1,33 | ||||
| 2025-08-14 | 13F | Mml Investors Services, Llc | 246 486 | 4,66 | 6 | 0,00 | ||||
| 2025-08-12 | 13F | LPL Financial LLC | 1 507 539 | 23,57 | 35 171 | 24,32 | ||||
| 2025-08-11 | 13F | Howard Wealth Management, Llc | 99 520 | 0,26 | 2 322 | 0,87 | ||||
| 2025-08-19 | 13F | Anchor Investment Management, LLC | 400 | 0,00 | 9 | 0,00 | ||||
| 2025-08-05 | 13F | Verity Asset Management, Inc. | 328 992 | 20,78 | 7 675 | 21,52 | ||||
| 2025-08-06 | 13F | Aspect Partners, LLC | 273 | 0,00 | 6 | 0,00 | ||||
| 2025-07-30 | 13F | Strategic Blueprint, LLC | 47 316 | 42,69 | 1 104 | 43,62 | ||||
| 2025-08-13 | 13F | Invesco Ltd. | 144 281 | 29,38 | 3 366 | 30,16 | ||||
| 2025-08-07 | 13F | Bradley & Co. Private Wealth Management, LLC | 645 | 0,00 | 15 | 7,14 | ||||
| 2025-08-14 | 13F | Old Mission Capital Llc | 55 679 | 1 299 | ||||||
| 2025-07-14 | 13F | AdvisorNet Financial, Inc | 13 887 | −0,47 | 324 | 0,00 | ||||
| 2025-08-14 | 13F | Mercer Global Advisors Inc /adv | 328 423 | −2,00 | 7 662 | −1,40 | ||||
| 2025-08-14 | 13F | Guardian Wealth Advisors, Llc / Nc | 2 021 | 0,00 | 47 | 2,17 | ||||
| 2025-07-21 | 13F | River Street Advisors LLC | 177 493 | −11,08 | 4 141 | −10,56 | ||||
| 2025-07-25 | 13F | Astoria Portfolio Advisors LLC. | 18 946 | 441 | ||||||
| 2025-08-06 | 13F | Financial Advisory Corp /ut/ /adv | 220 261 | 4,77 | 5 | 25,00 |