Grundläggande statistik
| Institutionella ägare | 178 total, 178 long only, 0 short only, 0 long/short - change of −1,65% MRQ |
| Genomsnittlig portföljallokering | 0.4346 % - change of 6,37% MRQ |
| Institutionella aktier (lång) | 22 734 300 (ex 13D/G) - change of −2,14MM shares −8,61% MRQ |
| Institutionellt värde (lång) | $ 508 304 USD ($1000) |
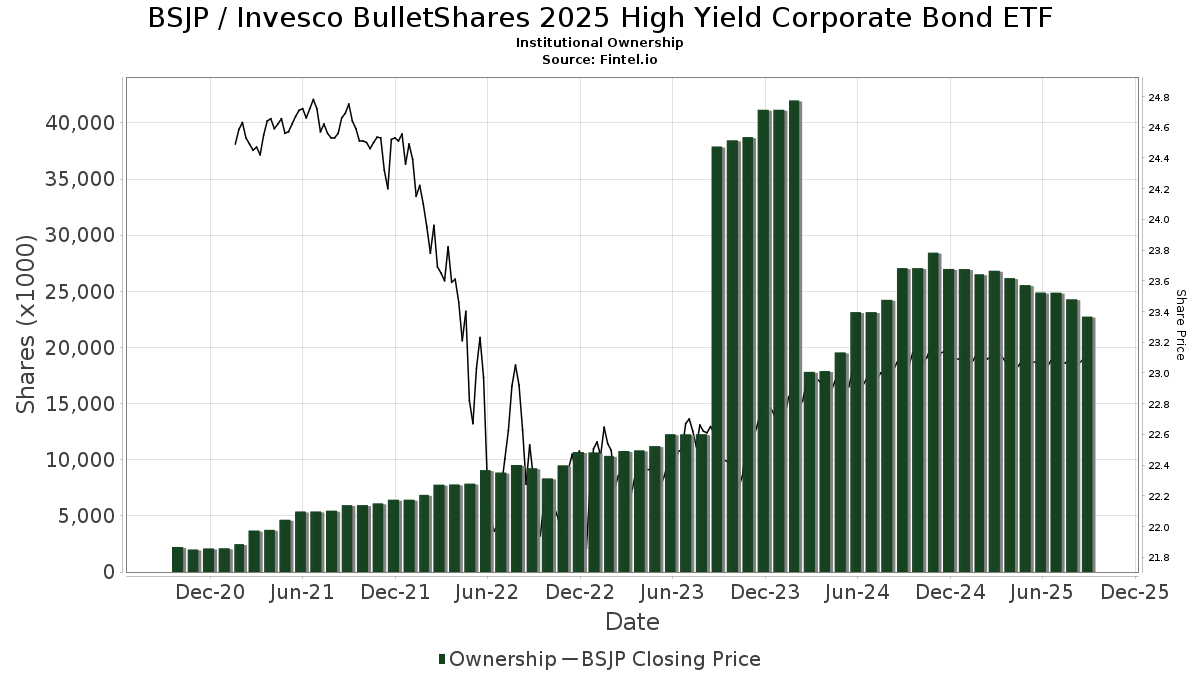
Institutionellt ägande och aktieägare
Invesco BulletShares 2025 High Yield Corporate Bond ETF (US:BSJP) har 178 Institutionella ägare och aktieägare som har lämnat in 13D/G- eller 13F-formulär till Securities Exchange Commission (SEC). Dessa institut innehar totalt 22,734,300 aktier. Största aktieägare inkluderar Mirador Capital Partners LP, LPL Financial LLC, Milestone Asset Management, Llc, Cetera Investment Advisers, Morgan Stanley, Wells Fargo & Company/mn, Envestnet Asset Management Inc, Delta Investment Management, LLC, United Capital Financial Advisers, Llc, and Advisory Alpha, LLC .
Invesco BulletShares 2025 High Yield Corporate Bond ETF (NasdaqGM:BSJP) Institutionell ägarstruktur visar institutioners och fonders nuvarande positioner i företaget, samt de senaste förändringarna i positionernas storlek. Större aktieägare kan vara enskilda investerare, fonder, hedgefonder eller institutioner. Bilaga 13D visar att investeraren äger (eller ägde) mer än 5% av företaget och avser (eller avsåg) att aktivt eftersträva en förändring av affärsstrategin. Schedule 13G indikerar en passiv investering på över 5%.
The share price as of September 10, 2025 is 23,10 / share. Previously, on September 11, 2024, the share price was 23,12 / share. This represents a decline of 0,11% over that period.
Fondsentimentets poäng
Fondsentimentet poängen(fka Ägarackumulation-poäng) visar vilka aktier som är mest köpta av fonder. Det är resultatet av en sofistikerad kvantitativ flerfaktormodell som identifierar företag med de högsta nivåerna av institutionell ackumulering. Poängsättningsmodellen använder en kombination av den totala ökningen av redovisade ägare, förändringarna i portföljallokeringarna för dessa ägare och andra mått. Siffran sträcker sig från 0 till 100, där högre siffror indikerar en högre nivå av ackumulering i förhållande till sina konkurrenter, och 50 är genomsnittet.
Uppdateringsfrekvens: Dagligen
Se Ownership Explorer, som innehåller en lista över de högst rankade företagen.
Institutionell sälj/köp-kvot
Förutom att rapportera vanliga eget kapital- och skuldemissioner måste institutioner med mer än 100MM tillgångar under förvaltning också avslöja sina innehav av sälj- och köpoptioner. Eftersom säljoptioner i allmänhet indikerar ett negativt sentiment och köpoptioner indikerar ett positivt sentiment, kan vi få en uppfattning om det övergripande institutionella sentimentet genom att plotta förhållandet mellan säljoptioner och köpoptioner. Diagrammet till höger visar det historiska förhållandet mellan sälj- och köpoptioner för detta instrument.
Genom att använda sälj/köp-kvoten som en indikator på aktieägarnas sentiment undviker man en av de största bristerna med att använda det totala institutionella ägandet, nämligen att en betydande del av de förvaltade tillgångarna investeras passivt för att följa index. Passivt förvaltade fonder köper vanligtvis inte optioner, så indikatorn för sälj/köp-kvoten ger en bättre bild av stämningen i aktivt förvaltade fonder.
13F- och NPORT-arkiveringar
Detaljer om 13F-arkiveringar är gratis. Detaljer om NP-arkiveringar kräver ett premiummedlemskap. Gröna rader indikerar nya positioner. Röda rader indikerar stängda positioner. Klicka på länk symbolen för att se hela transaktionshistoriken.
Uppgradera
för att låsa upp premiumdata och exportera till Excel ![]() .
.
| Fil Datum | Källa | Investerare | Typ | Genomsnittligt pris (beräknat) |
Aktier | Δ Aktier (%) |
Rapporterat värde (1000 USD) |
Δ Värde (%) |
Portföljallokering (%) |
|
|---|---|---|---|---|---|---|---|---|---|---|
| 2025-08-12 | 13F | Wealthbridge Capital Management, Llc | 38 127 | −0,31 | 880 | −0,23 | ||||
| 2025-07-11 | 13F | Farther Finance Advisors, LLC | 14 263 | 1 009,96 | 329 | 1 034,48 | ||||
| 2025-07-14 | 13F | CRA Financial Services, LLC | 39 116 | 3,97 | 902 | 4,04 | ||||
| 2025-04-17 | 13F | Robertson Stephens Wealth Management, LLC | 0 | −100,00 | 0 | |||||
| 2025-05-20 | 13F | Anchor Investment Management, LLC | 0 | −100,00 | 0 | |||||
| 2025-08-06 | 13F | Prospera Financial Services Inc | 172 852 | 0,83 | 3 988 | 0,91 | ||||
| 2025-04-17 | 13F | Rebalance, Llc | 0 | −100,00 | 0 | −100,00 | ||||
| 2025-08-12 | 13F | Global Retirement Partners, LLC | 1 754 | 49,40 | 40 | 48,15 | ||||
| 2025-08-13 | 13F | VestGen Advisors, LLC | 22 052 | −28,44 | 509 | −28,45 | ||||
| 2025-08-14 | 13F | Integrated Wealth Concepts LLC | 355 765 | −5,64 | 8 207 | −5,56 | ||||
| 2025-08-12 | 13F | Proequities, Inc. | 0 | 0 | ||||||
| 2025-08-01 | 13F | Envestnet Asset Management Inc | 615 461 | −31,66 | 14 199 | −31,60 | ||||
| 2025-08-14 | 13F | Ausdal Financial Partners, Inc. | 21 646 | 50,59 | 499 | 50,76 | ||||
| 2025-08-14 | 13F | Arete Wealth Advisors, LLC | 13 141 | 0,00 | 0 | |||||
| 2025-08-11 | 13F | Aptus Capital Advisors, LLC | 4 266 | 0,64 | 98 | 1,03 | ||||
| 2025-07-22 | 13F | Wealthcare Advisory Partners LLC | 45 330 | −2,43 | 1 046 | −2,34 | ||||
| 2025-07-28 | 13F | Harbour Investments, Inc. | 29 317 | 0,00 | 676 | 0,15 | ||||
| 2025-08-05 | 13F | Pacific Wealth Strategies Group, Inc. | 18 348 | −78,95 | 423 | −78,94 | ||||
| 2025-07-21 | 13F | Ameritas Advisory Services, LLC | 2 726 | 63 | ||||||
| 2025-09-04 | 13F/A | Advisor Group Holdings, Inc. | 381 450 | 24,21 | 8 801 | 24,31 | ||||
| 2025-08-12 | 13F | Fca Corp /tx | 61 070 | −1,46 | 1 409 | −1,40 | ||||
| 2025-07-29 | 13F | Flavin Financial Services, Inc. | 41 461 | −40,90 | 956 | −40,84 | ||||
| 2025-08-08 | 13F | Cetera Investment Advisers | 1 136 499 | −17,65 | 26 219 | −17,57 | ||||
| 2025-08-08 | 13F | Creative Planning | 11 228 | −1,47 | 259 | −1,15 | ||||
| 2025-08-05 | 13F | Bank Of Montreal /can/ | 0 | −100,00 | 0 | |||||
| 2025-07-17 | 13F | Janney Montgomery Scott LLC | 13 707 | −55,96 | 0 | |||||
| 2025-07-22 | 13F | Siligmueller & Norvid Wealth Advisors LLC | 12 100 | 0,00 | 280 | 0,36 | ||||
| 2025-07-31 | 13F | Buckingham Strategic Partners | 0 | −100,00 | 0 | |||||
| 2025-07-31 | 13F | Glass Jacobson Investment Advisors llc | 109 736 | −1,94 | 2 532 | −1,94 | ||||
| 2025-07-30 | 13F | Fusion Family Wealth LLC | 115 610 | −2,44 | 2 391 | −2,45 | ||||
| 2025-05-06 | 13F | VSM Wealth Advisory, LLC | 0 | −100,00 | 0 | |||||
| 2025-08-14 | 13F | Ameriprise Financial Inc | 148 735 | −1,45 | 3 431 | −1,35 | ||||
| 2025-07-23 | 13F | WESPAC Advisors, LLC | 9 638 | −40,63 | 222 | −40,64 | ||||
| 2025-05-08 | 13F | Squire Investment Management Company, LLC | 0 | −100,00 | 0 | |||||
| 2025-08-14 | 13F | Bank Of America Corp /de/ | 186 675 | −37,85 | 4 307 | −37,80 | ||||
| 2025-08-12 | 13F | Jpmorgan Chase & Co | 6 178 | 143 | ||||||
| 2025-08-14 | 13F | Susquehanna International Group, Llp | 15 420 | 1,83 | 356 | 1,72 | ||||
| 2025-08-11 | 13F | Shufro Rose & Co Llc | 24 800 | 0,00 | 572 | 0,00 | ||||
| 2025-07-29 | 13F | Semitam Bonam Llc | 30 055 | 693 | ||||||
| 2025-08-08 | 13F | Larson Financial Group LLC | 16 350 | 0,76 | 377 | 0,80 | ||||
| 2025-08-12 | 13F | J.w. Cole Advisors, Inc. | 46 267 | −14,85 | 1 067 | −14,78 | ||||
| 2025-07-23 | 13F | Ironwood Financial, llc | 431 407 | 0,00 | 9 944 | 0,00 | ||||
| 2025-08-14 | 13F | Bnp Paribas Arbitrage, Sa | 0 | −100,00 | 0 | |||||
| 2025-08-15 | 13F | WFA of San Diego, LLC | 4 285 | −93,09 | 99 | −93,16 | ||||
| 2025-05-13 | 13F | Bokf, Na | 0 | −100,00 | 0 | |||||
| 2025-08-14 | 13F | Comerica Bank | 4 962 | −4,49 | 114 | −4,20 | ||||
| 2025-07-16 | 13F | Tassel Capital Management, Inc. | 16 538 | 17,88 | 382 | 17,96 | ||||
| 2025-08-07 | 13F | Northwest Bancshares, Inc. | 102 710 | 0,70 | 2 370 | 0,77 | ||||
| 2025-08-01 | 13F | Advisory Alpha, LLC | 500 895 | 12,62 | 11 556 | 12,72 | ||||
| 2025-08-14 | 13F | Mercer Global Advisors Inc /adv | 36 786 | −88,77 | 849 | −88,77 | ||||
| 2025-07-21 | 13F | Empirical Financial Services, LLC d.b.a. Empirical Wealth Management | 32 505 | 2,48 | 750 | 2,46 | ||||
| 2025-07-10 | 13F | Voisard Asset Management Group, Inc. | 34 646 | 0,99 | 799 | 1,14 | ||||
| 2025-08-13 | 13F | Capital Analysts, Inc. | 80 329 | −0,62 | 2 | 0,00 | ||||
| 2025-08-15 | 13F | Kestra Advisory Services, LLC | 151 390 | −4,14 | 3 493 | −4,07 | ||||
| 2025-07-23 | 13F | Ti-trust, Inc | 9 060 | 0,00 | 209 | 0,48 | ||||
| 2025-08-18 | 13F | Tyler-Stone Wealth Management | 156 260 | −7,26 | 3 605 | −7,19 | ||||
| 2025-08-05 | 13F | Milestone Asset Management, Llc | 1 586 241 | 22,71 | 36 595 | 22,82 | ||||
| 2025-07-11 | 13F | Meriwether Wealth & Planning, LLC | 15 913 | 5,45 | 367 | 5,76 | ||||
| 2025-08-12 | 13F | SRS Capital Advisors, Inc. | 424 | 10 | ||||||
| 2025-08-11 | 13F | Principal Securities, Inc. | 2 099 | 95,26 | 48 | 100,00 | ||||
| 2025-07-15 | 13F | SJS Investment Consulting Inc. | 166 | 0,00 | 4 | 0,00 | ||||
| 2025-07-25 | 13F | Iron Financial, LLC | 23 312 | 19,46 | 538 | 19,60 | ||||
| 2025-07-25 | 13F | Atria Wealth Solutions, Inc. | 0 | −100,00 | 0 | |||||
| 2025-08-14 | 13F | CoreCap Advisors, LLC | 6 892 | 0,00 | 159 | 0,00 | ||||
| 2025-07-14 | 13F | Wealth Advisory Solutions, LLC | 55 384 | 17,30 | 1 278 | 17,37 | ||||
| 2025-08-15 | 13F | Equitable Holdings, Inc. | 11 255 | −54,86 | 260 | −54,88 | ||||
| 2025-07-28 | 13F | RFG Advisory, LLC | 20 946 | −3,56 | 483 | −3,40 | ||||
| 2025-08-06 | 13F | Atlantic Union Bankshares Corp | 10 587 | 10,73 | 244 | 10,91 | ||||
| 2025-07-07 | 13F | Horizons Wealth Management | 100 318 | −0,87 | 2 314 | −0,77 | ||||
| 2025-08-01 | 13F | Koss-Olinger Consulting, LLC | 16 860 | −6,53 | 389 | −6,73 | ||||
| 2025-08-13 | 13F | Brown Advisory Inc | 33 672 | 0,00 | 777 | 0,00 | ||||
| 2025-07-24 | 13F/A | TFR Capital, LLC. | 94 963 | 9,59 | 2 191 | 9,66 | ||||
| 2025-08-06 | 13F | Summit Investment Advisors, Inc. | 492 654 | 3,09 | 11 363 | 3,08 | ||||
| 2025-08-12 | 13F | NFP Retirement, Inc. | 47 115 | −13,01 | 1 087 | −12,98 | ||||
| 2025-07-08 | 13F | Ballew Advisors, Inc | 31 285 | 0,15 | 722 | 0,56 | ||||
| 2025-07-22 | 13F | McElhenny Sheffield Capital Management, LLC | 572 | 211 | ||||||
| 2025-08-05 | 13F | American Capital Advisory, LLC | 17 135 | −2,59 | 395 | −2,47 | ||||
| 2025-08-14 | 13F | GWM Advisors LLC | 64 492 | −2,85 | 1 488 | −2,81 | ||||
| 2025-08-04 | 13F | AlphaStar Capital Management, LLC | 19 522 | 0,79 | 450 | 0,90 | ||||
| 2025-07-03 | 13F | Collective Family Office Llc | 345 052 | −47,36 | 7 960 | −47,32 | ||||
| 2025-07-31 | 13F | Topsail Wealth Management, LLC | 0 | −100,00 | 0 | |||||
| 2025-08-01 | 13F | MorganRosel Wealth Management, LLC | 5 568 | 0,00 | 128 | 0,00 | ||||
| 2025-07-29 | 13F | Stephens Inc /ar/ | 12 012 | −42,10 | 277 | −42,05 | ||||
| 2025-08-14 | 13F | Wells Fargo & Company/mn | 700 261 | −6,57 | 16 155 | −6,48 | ||||
| 2025-08-18 | 13F | Geneos Wealth Management Inc. | 32 587 | −2,93 | 752 | −2,85 | ||||
| 2025-07-01 | 13F | Private Client Services, Llc | 120 448 | −7,31 | 2 779 | −7,25 | ||||
| 2025-07-24 | 13F | Wealthstar Advisors, Llc | 13 434 | 0,23 | 310 | 0,32 | ||||
| 2025-08-08 | 13F | Foundations Investment Advisors, LLC | 75 348 | 2,76 | 1 738 | 2,84 | ||||
| 2025-05-12 | 13F | Founders Financial Securities Llc | 0 | −100,00 | 0 | |||||
| 2025-08-26 | 13F/A | Thrivent Financial For Lutherans | 85 500 | −0,15 | 2 | 0,00 | ||||
| 2025-08-11 | 13F | Private Advisor Group, LLC | 116 538 | −16,29 | 2 689 | −16,24 | ||||
| 2025-07-09 | 13F | Mirador Capital Partners LP | 2 389 222 | 4,85 | 55 119 | 4,94 | ||||
| 2025-07-29 | 13F | Private Trust Co Na | 4 347 | 1,14 | 100 | 1,01 | ||||
| 2025-08-08 | 13F | Intrua Financial, LLC | 232 428 | −2,39 | 5 362 | −2,30 | ||||
| 2025-07-22 | 13F | Fortitude Advisory Group L.L.C. | 11 338 | 0,00 | 262 | 0,00 | ||||
| 2025-07-08 | 13F | Atwood & Palmer Inc | 1 550 | 0,00 | 36 | 0,00 | ||||
| 2025-08-14 | 13F | Two Sigma Securities, Llc | 21 710 | 501 | ||||||
| 2025-04-29 | 13F | Resources Investment Advisors, LLC. | 0 | −100,00 | 0 | −100,00 | ||||
| 2025-08-05 | 13F | Blue Barn Wealth, LLC | 40 729 | −28,26 | 940 | −28,21 | ||||
| 2025-07-15 | 13F | BCS Wealth Management | 32 866 | −5,64 | 1 | |||||
| 2025-07-17 | 13F | E Six Thirteen, Llc | 89 226 | −0,06 | 2 058 | 0,05 | ||||
| 2025-08-13 | 13F | Lido Advisors, LLC | 108 354 | 0,84 | 2 500 | 0,93 | ||||
| 2025-07-15 | 13F | Legacy Financial Group LLC | 71 123 | −40,24 | 1 641 | −40,21 | ||||
| 2025-07-17 | 13F | Independence Bank of Kentucky | 102 | 0,00 | 2 | 0,00 | ||||
| 2025-08-05 | 13F | Summit Investment Advisory Services, LLC | 489 692 | 11 297 | ||||||
| 2025-08-08 | 13F | Avantax Advisory Services, Inc. | 10 082 | −60,93 | 233 | −60,94 | ||||
| 2025-08-15 | 13F | Prevail Innovative Wealth Advisors, Llc | 54 756 | 20,26 | 1 263 | 20,40 | ||||
| 2025-05-07 | 13F | Vista Private Wealth Partners. LLC | 0 | −100,00 | 0 | |||||
| 2025-08-14 | 13F | UBS Group AG | 116 223 | −75,61 | 2 681 | −75,59 | ||||
| 2025-07-21 | 13F | Old Second National Bank Of Aurora | 1 085 | 0,00 | 25 | 0,00 | ||||
| 2025-08-01 | 13F | Delta Investment Management, LLC | 536 036 | −6,97 | 12 366 | −6,89 | ||||
| 2025-08-06 | 13F | Commonwealth Equity Services, Llc | 249 649 | 0,88 | 6 | 0,00 | ||||
| 2025-07-08 | 13F | Gradient Investments LLC | 30 438 | 1,16 | 702 | 1,30 | ||||
| 2025-07-17 | 13F | Sound Income Strategies, LLC | 0 | −100,00 | 0 | |||||
| 2025-07-25 | 13F | We Are One Seven, LLC | 110 275 | 19,08 | 2 544 | 19,21 | ||||
| 2025-08-14 | 13F | Goldman Sachs Group Inc | 33 877 | 782 | ||||||
| 2025-07-08 | 13F | FF Advisors,LLC | 233 139 | 2,10 | 5 379 | 2,01 | ||||
| 2025-07-10 | 13F | Focus Financial Network, Inc. | 10 000 | 231 | ||||||
| 2025-08-14 | 13F | Wilkins Miller Wealth Management, LLC | 44 200 | −5,83 | 1 020 | −5,74 | ||||
| 2025-08-14 | 13F | Royal Bank Of Canada | 189 490 | −29,52 | 4 372 | −29,45 | ||||
| 2025-08-11 | 13F | Western Wealth Management, LLC | 19 481 | −7,15 | 449 | −7,04 | ||||
| 2025-08-13 | 13F | Stablepoint Partners, LLC | 291 035 | 1,85 | 6 714 | 1,94 | ||||
| 2025-08-12 | 13F | Meridian Wealth Advisors, LLC | 13 902 | 0,00 | 321 | 0,00 | ||||
| 2025-08-11 | 13F | TD Waterhouse Canada Inc. | 2 900 | −64,42 | 67 | −64,71 | ||||
| 2025-04-23 | NP | IPSAX - IPS Strategic Capital Absolute Return Fund Institutional Class Shares | 0 | −100,00 | 0 | −100,00 | ||||
| 2025-08-07 | 13F | Private Advisory Group LLC | 21 201 | −4,35 | 489 | −4,12 | ||||
| 2025-04-21 | 13F | Nelson, Van Denburg & Campbell Wealth Management Group, LLC | 0 | −100,00 | 0 | −100,00 | ||||
| 2025-08-14 | 13F | Citadel Advisors Llc | 18 023 | 17,90 | 416 | 17,90 | ||||
| 2025-05-06 | 13F | Carnegie Capital Asset Management, LLC | 0 | −100,00 | 0 | |||||
| 2025-07-22 | 13F | Net Worth Advisory Group | 17 668 | 20,84 | 408 | 20,77 | ||||
| 2025-08-14 | 13F | Ancora Advisors, LLC | 1 509 | 0,00 | 35 | 0,00 | ||||
| 2025-07-29 | 13F | Werba Rubin Papier Wealth Management | 157 587 | −4,25 | 3 636 | −4,17 | ||||
| 2025-05-14 | 13F | Monterey Private Wealth, Inc. | 9 207 | 1,40 | 212 | 1,44 | ||||
| 2025-05-01 | 13F | Alaska Permanent Capital Management | 0 | −100,00 | 0 | |||||
| 2025-07-29 | 13F | BXM Wealth LLC | 14 082 | 9,75 | 325 | 9,83 | ||||
| 2025-07-09 | 13F | Sarver Vrooman Wealth Advisors | 622 | 0,00 | 14 | 0,00 | ||||
| 2025-07-14 | 13F | AdvisorNet Financial, Inc | 27 | 0,00 | 1 | |||||
| 2025-07-22 | 13F | Merit Financial Group, LLC | 0 | −100,00 | 0 | |||||
| 2025-07-10 | 13F | Wealth Enhancement Advisory Services, Llc | 45 122 | −1,40 | 1 041 | −1,23 | ||||
| 2025-07-28 | 13F | Mutual Advisors, LLC | 16 457 | −25,21 | 379 | −25,25 | ||||
| 2025-07-30 | 13F | Brookstone Capital Management | 28 371 | −8,07 | 655 | −8,02 | ||||
| 2025-08-14 | 13F | Jane Street Group, Llc | 159 828 | 16,25 | 3 687 | 16,38 | ||||
| 2025-08-14 | 13F | TCG Advisory Services, LLC | 34 789 | −1,95 | 803 | −1,84 | ||||
| 2025-07-11 | 13F | AA Financial Advisors, LLC | 411 444 | 16,45 | 9 492 | 16,55 | ||||
| 2025-07-17 | 13F | Wolff Wiese Magana Llc | 0 | −100,00 | 0 | |||||
| 2025-07-10 | 13F | Sovran Advisors, LLC | 0 | −100,00 | 0 | |||||
| 2025-08-07 | 13F | Allworth Financial LP | 45 937 | −0,54 | 1 060 | −0,47 | ||||
| 2025-07-31 | 13F | Oppenheimer & Co Inc | 11 690 | 15,64 | 270 | 15,45 | ||||
| 2025-08-12 | 13F | Steward Partners Investment Advisory, Llc | 21 518 | −1,56 | 496 | −1,39 | ||||
| 2025-05-12 | 13F | Independent Advisor Alliance | 0 | −100,00 | 0 | |||||
| 2025-07-22 | 13F | 4Thought Financial Group Inc. | 22 213 | −3,35 | 512 | −3,21 | ||||
| 2025-07-24 | 13F | Eastern Bank | 0 | −100,00 | 0 | |||||
| 2025-08-13 | 13F | RPg Family Wealth Advisory, LLC | 0 | −100,00 | 0 | |||||
| 2025-08-04 | 13F | Migdal Insurance & Financial Holdings Ltd. | 3 972 | −99,17 | 0 | −100,00 | ||||
| 2025-07-08 | 13F | Parallel Advisors, LLC | 2 757 | 0,00 | 64 | 0,00 | ||||
| 2025-08-13 | 13F | BCJ Capital Management, LLC | 0 | −100,00 | 0 | |||||
| 2025-07-25 | 13F | Cwm, Llc | 1 965 | −57,20 | 0 | |||||
| 2025-08-07 | 13F | SFE Investment Counsel | 82 883 | −49,15 | 1 912 | −49,11 | ||||
| 2025-07-31 | 13F | Richards, Merrill & Peterson, Inc. | 1 833 | 0,00 | 42 | 0,00 | ||||
| 2025-07-08 | 13F | S.E.E.D. Planning Group LLC | 73 467 | 4,40 | 1 695 | 4,44 | ||||
| 2025-08-14 | 13F | Guardian Wealth Advisors, Llc / Nc | 2 046 | 0,00 | 47 | 0,00 | ||||
| 2025-07-14 | 13F | Sound Stewardship, LLC | 51 303 | 0,71 | 1 184 | 0,77 | ||||
| 2025-07-30 | 13F | Strategic Blueprint, LLC | 25 407 | −16,85 | 586 | −16,76 | ||||
| 2025-07-24 | 13F | Leo Wealth, LLC | 206 218 | 4 757 | ||||||
| 2025-08-13 | 13F | Jones Financial Companies Lllp | 130 017 | 5,54 | 2 998 | 5,64 | ||||
| 2025-08-14 | 13F | Fmr Llc | 892 | 14 766,67 | 21 | |||||
| 2025-07-24 | 13F | Vantage Point Financial LLC | 66 419 | −2,27 | 1 532 | −2,17 | ||||
| 2025-07-29 | 13F | Stratos Wealth Partners, LTD. | 15 503 | 12,66 | 358 | 12,62 | ||||
| 2025-08-06 | 13F | Aspect Partners, LLC | 285 | 0,00 | 7 | 0,00 | ||||
| 2025-08-11 | 13F | United Capital Financial Advisers, Llc | 532 012 | −4,02 | 12 274 | −3,94 | ||||
| 2025-08-14 | 13F | IHT Wealth Management, LLC | 243 663 | 2,45 | 5 621 | 2,54 | ||||
| 2025-07-31 | 13F | Cambridge Investment Research Advisors, Inc. | 105 633 | −9,53 | 2 | 0,00 | ||||
| 2025-08-14 | 13F | Hrt Financial Lp | 13 881 | −62,04 | 0 | |||||
| 2025-08-06 | 13F | AE Wealth Management LLC | 669 | 0,00 | 15 | 0,00 | ||||
| 2025-08-11 | 13F | CBIZ Investment Advisory Services, LLC | 490 | 1,24 | 11 | 0,00 | ||||
| 2025-08-01 | 13F | Brinker Capital Investments, LLC | 0 | −100,00 | 0 | |||||
| 2025-08-05 | 13F | Key FInancial Inc | 59 366 | 3,79 | 1 370 | 3,87 | ||||
| 2025-07-21 | 13F | Ashton Thomas Securities, Llc | 1 718 | 0,00 | 40 | 0,00 | ||||
| 2025-08-12 | 13F | Horizon Financial Services, Llc | 16 665 | −0,81 | 384 | −0,78 | ||||
| 2025-08-14 | 13F | Diversify Advisory Services, LLC | 15 015 | −42,88 | 347 | −42,81 | ||||
| 2025-08-14 | 13F | Atomi Financial Group, Inc. | 69 407 | −4,18 | 1 601 | −4,07 | ||||
| 2025-08-13 | 13F | Northwestern Mutual Wealth Management Co | 3 916 | 0,00 | 90 | 0,00 | ||||
| 2025-08-14 | 13F | Mariner, LLC | 13 029 | 301 | ||||||
| 2025-08-08 | 13F | Flaharty Asset Management, LLC | 0 | −100,00 | 0 | |||||
| 2025-08-14 | 13F | Stifel Financial Corp | 173 075 | 4,57 | 3 993 | 4,64 | ||||
| 2025-07-23 | 13F | Evexia Wealth Llc | 135 250 | −32,61 | 3 126 | −32,43 | ||||
| 2025-08-01 | 13F | Ashton Thomas Private Wealth, LLC | 391 995 | −8,19 | 9 043 | −8,11 | ||||
| 2025-07-11 | 13F | Quad-Cities Investment Group, LLC | 18 408 | −2,89 | 425 | −2,75 | ||||
| 2025-07-18 | 13F | Consolidated Portfolio Review Corp | 21 885 | 7,89 | 505 | 7,92 | ||||
| 2025-07-29 | 13F | Straight Path Wealth Management | 17 186 | 0,37 | 396 | 0,51 | ||||
| 2025-08-14 | 13F | Raymond James Financial Inc | 479 398 | −29,89 | 11 060 | −29,83 | ||||
| 2025-08-05 | 13F | Huntington National Bank | 23 | |||||||
| 2025-08-14 | 13F | Mml Investors Services, Llc | 93 718 | −15,38 | 2 | 0,00 | ||||
| 2025-08-12 | 13F | CIBC Private Wealth Group, LLC | 0 | −100,00 | 0 | |||||
| 2025-08-11 | 13F | Oder Investment Management, LLC | 156 528 | −9,07 | 3 611 | −8,97 | ||||
| 2025-07-16 | 13F | Old Port Advisors | 10 500 | −3,67 | 242 | −3,59 | ||||
| 2025-05-09 | 13F | Pnc Financial Services Group, Inc. | 0 | −100,00 | 0 | −100,00 | ||||
| 2025-08-11 | 13F | Howard Wealth Management, Llc | 109 015 | 0,80 | 2 515 | 0,88 | ||||
| 2025-08-06 | 13F | Altrius Capital Management Inc | 34 194 | −1,31 | 789 | −1,25 | ||||
| 2025-07-29 | 13F | Mattson Financial Services, LLC | 0 | −100,00 | 0 | |||||
| 2025-08-15 | 13F | Morgan Stanley | 996 877 | −7,50 | 22 998 | −7,42 | ||||
| 2025-08-12 | 13F | MAI Capital Management | 986 | 0,00 | 23 | 0,00 | ||||
| 2025-08-13 | 13F | Invesco Ltd. | 20 709 | −77,91 | 478 | −77,92 | ||||
| 2025-07-24 | 13F | IFP Advisors, Inc | 0 | −100,00 | 0 | −100,00 | ||||
| 2025-08-12 | 13F | LPL Financial LLC | 1 872 901 | −3,54 | 43 208 | −3,46 | ||||
| 2025-04-16 | 13F | Sterling Financial Group, Inc. | 0 | −100,00 | 0 | −100,00 | ||||
| 2025-08-14 | 13F | Old Mission Capital Llc | 65 038 | 429,11 | 1 500 | 430,04 | ||||
| 2025-08-04 | 13F | Creative Financial Designs Inc /adv | 6 543 | −25,19 | 151 | −25,37 | ||||
| 2025-08-12 | 13F | Gladstone Institutional Advisory LLC | 66 398 | 0,51 | 1 532 | 0,59 | ||||
| 2025-05-07 | 13F | Trilogy Capital Inc. | 0 | −100,00 | 0 | |||||
| 2025-07-31 | 13F | Insight Wealth Partners, LLC | 0 | −100,00 | 0 | |||||
| 2025-07-14 | 13F | Masso Torrence Wealth Management Inc. | 26 017 | 0,00 | 600 | 0,17 | ||||
| 2025-08-05 | 13F | Claro Advisors LLC | 9 594 | 221 | ||||||
| 2025-08-05 | 13F | Verity Asset Management, Inc. | 312 153 | −0,10 | 7 201 | −0,01 | ||||
| 2025-08-14 | 13F | Certified Advisory Corp | 17 480 | 0,74 | 403 | 1,00 |