Grundläggande statistik
| Institutionella ägare | 289 total, 289 long only, 0 short only, 0 long/short - change of 3,20% MRQ |
| Genomsnittlig portföljallokering | 1.0126 % - change of 5,06% MRQ |
| Institutionella aktier (lång) | 24 811 620 (ex 13D/G) - change of 0,27MM shares 1,09% MRQ |
| Institutionellt värde (lång) | $ 2 155 526 USD ($1000) |
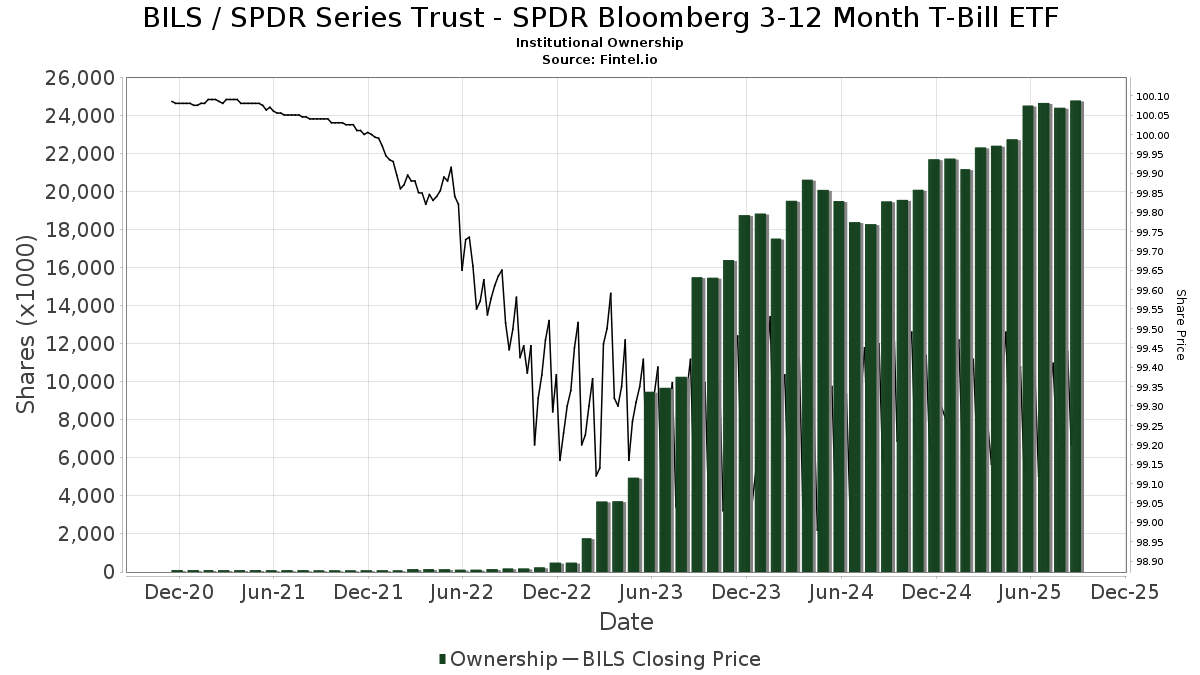
Institutionellt ägande och aktieägare
SPDR Series Trust - SPDR Bloomberg 3-12 Month T-Bill ETF (US:BILS) har 289 Institutionella ägare och aktieägare som har lämnat in 13D/G- eller 13F-formulär till Securities Exchange Commission (SEC). Dessa institut innehar totalt 24,811,620 aktier. Största aktieägare inkluderar LPL Financial LLC, Cwm, Llc, Bank Of America Corp /de/, Ameriprise Financial Inc, Miller Investment Management, LP, Sargent Investment Group, LLC, Bell Bank, Royal Bank Of Canada, Envestnet Asset Management Inc, and Commonwealth Equity Services, Llc .
SPDR Series Trust - SPDR Bloomberg 3-12 Month T-Bill ETF (ARCA:BILS) Institutionell ägarstruktur visar institutioners och fonders nuvarande positioner i företaget, samt de senaste förändringarna i positionernas storlek. Större aktieägare kan vara enskilda investerare, fonder, hedgefonder eller institutioner. Bilaga 13D visar att investeraren äger (eller ägde) mer än 5% av företaget och avser (eller avsåg) att aktivt eftersträva en förändring av affärsstrategin. Schedule 13G indikerar en passiv investering på över 5%.
The share price as of September 12, 2025 is 99,35 / share. Previously, on September 16, 2024, the share price was 99,36 / share. This represents a decline of 0,01% over that period.
Fondsentimentets poäng
Fondsentimentet poängen(fka Ägarackumulation-poäng) visar vilka aktier som är mest köpta av fonder. Det är resultatet av en sofistikerad kvantitativ flerfaktormodell som identifierar företag med de högsta nivåerna av institutionell ackumulering. Poängsättningsmodellen använder en kombination av den totala ökningen av redovisade ägare, förändringarna i portföljallokeringarna för dessa ägare och andra mått. Siffran sträcker sig från 0 till 100, där högre siffror indikerar en högre nivå av ackumulering i förhållande till sina konkurrenter, och 50 är genomsnittet.
Uppdateringsfrekvens: Dagligen
Se Ownership Explorer, som innehåller en lista över de högst rankade företagen.
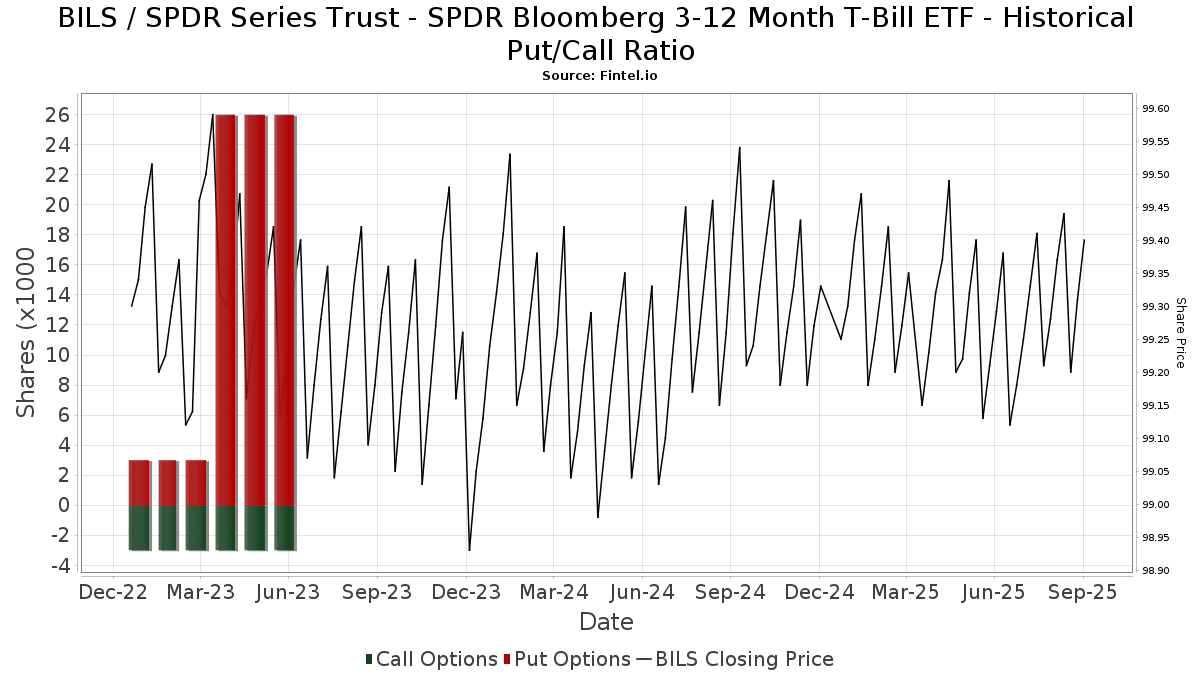
Institutionell sälj/köp-kvot
Förutom att rapportera vanliga eget kapital- och skuldemissioner måste institutioner med mer än 100MM tillgångar under förvaltning också avslöja sina innehav av sälj- och köpoptioner. Eftersom säljoptioner i allmänhet indikerar ett negativt sentiment och köpoptioner indikerar ett positivt sentiment, kan vi få en uppfattning om det övergripande institutionella sentimentet genom att plotta förhållandet mellan säljoptioner och köpoptioner. Diagrammet till höger visar det historiska förhållandet mellan sälj- och köpoptioner för detta instrument.
Genom att använda sälj/köp-kvoten som en indikator på aktieägarnas sentiment undviker man en av de största bristerna med att använda det totala institutionella ägandet, nämligen att en betydande del av de förvaltade tillgångarna investeras passivt för att följa index. Passivt förvaltade fonder köper vanligtvis inte optioner, så indikatorn för sälj/köp-kvoten ger en bättre bild av stämningen i aktivt förvaltade fonder.
13F- och NPORT-arkiveringar
Detaljer om 13F-arkiveringar är gratis. Detaljer om NP-arkiveringar kräver ett premiummedlemskap. Gröna rader indikerar nya positioner. Röda rader indikerar stängda positioner. Klicka på länk symbolen för att se hela transaktionshistoriken.
Uppgradera
för att låsa upp premiumdata och exportera till Excel ![]() .
.
| Fil Datum | Källa | Investerare | Typ | Genomsnittligt pris (beräknat) |
Aktier | Δ Aktier (%) |
Rapporterat värde (1000 USD) |
Δ Värde (%) |
Portföljallokering (%) |
|
|---|---|---|---|---|---|---|---|---|---|---|
| 2025-08-14 | 13F | Hrt Financial Lp | 53 600 | 5 | ||||||
| 2025-08-06 | 13F | Miller Investment Management, LP | 1 108 066 | 0,03 | 110 175 | −0,03 | ||||
| 2025-08-07 | 13F | Kestra Private Wealth Services, Llc | 19 744 | 29,19 | 1 963 | 29,14 | ||||
| 2025-08-12 | 13F | Putnam Fl Investment Management Co | 2 111 | 210 | ||||||
| 2025-08-06 | 13F | Prospera Financial Services Inc | 15 104 | 8,25 | 1 502 | 8,14 | ||||
| 2025-05-08 | 13F | Us Bancorp \de\ | 0 | −100,00 | 0 | |||||
| 2025-07-24 | 13F | Ridgeline Wealth Planning, LLC | 2 829 | −2,04 | 281 | −2,09 | ||||
| 2025-08-04 | 13F | Flagship Harbor Advisors, Llc | 13 835 | 28,93 | 1 376 | 28,87 | ||||
| 2025-08-15 | 13F | Tower Research Capital LLC (TRC) | 25 589 | 319 762,50 | 2 544 | |||||
| 2025-07-17 | 13F | Camelot Portfolios, LLC | 2 369 | −5,24 | 236 | −5,24 | ||||
| 2025-08-11 | 13F | Western Wealth Management, LLC | 27 895 | 7,81 | 2 774 | 7,73 | ||||
| 2025-08-06 | 13F | Mark Sheptoff Financial Planning, Llc | 800 | 80 | ||||||
| 2025-07-18 | 13F | Bartlett & Co. Wealth Management Llc | 0 | −100,00 | 0 | |||||
| 2025-08-07 | 13F | Midwest Trust Co | 4 171 | 415 | ||||||
| 2025-07-28 | 13F | Courier Capital Llc | 0 | −100,00 | 0 | |||||
| 2025-07-30 | 13F | Studio Investment Management Llc | 11 973 | −33,89 | 1 190 | −33,93 | ||||
| 2025-08-14 | 13F | Royal Bank Of Canada | 488 069 | 24,31 | 48 529 | 24,24 | ||||
| 2025-08-14 | 13F | Treasure Coast Financial Planning | 120 402 | 2,04 | 11 972 | 1,98 | ||||
| 2025-04-15 | 13F | Collier Financial | 12 432 | 4,61 | 1 237 | 4,92 | ||||
| 2025-07-18 | 13F | Parsons Capital Management Inc/ri | 15 595 | −10,00 | 1 551 | −10,04 | ||||
| 2025-08-13 | 13F | StoneX Group Inc. | 10 870 | 130,25 | 1 081 | 130,28 | ||||
| 2025-08-08 | 13F | Austin Wealth Management, LLC | 117 034 | −2,93 | 11 634 | −2,92 | ||||
| 2025-07-16 | 13F | Phil A. Younker & Associates, Ltd. | 9 475 | 0,00 | 942 | 0,00 | ||||
| 2025-08-01 | 13F | Financial Counselors Inc | 0 | −100,00 | 0 | |||||
| 2025-08-14 | 13F/A | Hutchinson Financial Advisors, INC | 22 830 | 2 270 | ||||||
| 2025-07-16 | 13F | Perigon Wealth Management, LLC | 0 | −100,00 | 0 | |||||
| 2025-07-16 | 13F | St Germain D J Co Inc | 1 494 | −5,68 | 149 | −5,73 | ||||
| 2025-07-31 | 13F | Auour Investments LLC | 35 706 | −0,88 | 3 550 | −0,92 | ||||
| 2025-08-18 | 13F | Geneos Wealth Management Inc. | 12 002 | 10,44 | 1 193 | 10,36 | ||||
| 2025-07-11 | 13F | Bell Bank | 530 257 | −14,22 | 52 723 | −14,27 | ||||
| 2025-07-21 | 13F | Synergy Financial Management, LLC | 8 000 | 0,00 | 795 | 0,00 | ||||
| 2025-07-18 | 13F | Consolidated Portfolio Review Corp | 3 823 | 380 | ||||||
| 2025-07-29 | 13F | Stratos Wealth Advisors, LLC | 21 354 | −0,36 | 2 123 | −0,42 | ||||
| 2025-08-13 | 13F | Cresset Asset Management, LLC | 0 | −100,00 | 0 | |||||
| 2025-07-17 | 13F | Hamilton Capital Partners, Llc | 52 178 | 5 188 | ||||||
| 2025-07-31 | 13F | Cambridge Investment Research Advisors, Inc. | 64 426 | 30,97 | 6 | 50,00 | ||||
| 2025-07-28 | 13F | Nvest Financial, LLC | 2 119 | 211 | ||||||
| 2025-07-29 | 13F | Private Trust Co Na | 3 085 | −75,92 | 307 | −75,98 | ||||
| 2025-07-17 | 13F | Archford Capital Strategies, LLC | 2 888 | 0,00 | 287 | 0,00 | ||||
| 2025-07-24 | 13F | Capital Advisors, Ltd. LLC | 19 281 | −1,57 | 2 | 0,00 | ||||
| 2025-08-05 | 13F | Transatlantique Private Wealth Llc | 2 168 | 216 | ||||||
| 2025-08-06 | 13F | Stonebridge Financial Planning Group, LLC | 4 707 | 0,00 | 468 | 0,00 | ||||
| 2025-07-30 | NP | OCIO - ClearShares OCIO ETF | 50 000 | 4 972 | ||||||
| 2025-07-28 | 13F | RFG Advisory, LLC | 4 395 | 437 | ||||||
| 2025-07-25 | 13F | Atria Wealth Solutions, Inc. | 3 845 | −67,04 | 382 | −67,07 | ||||
| 2025-07-23 | 13F | RiverTree Advisors, LLC | 11 594 | 22,16 | 1 153 | 22,03 | ||||
| 2025-07-29 | 13F | Stephens Inc /ar/ | 49 550 | −19,11 | 4 927 | −19,17 | ||||
| 2025-07-18 | 13F | Magnolia Private Wealth, LLC | 25 810 | −40,37 | 2 566 | −40,41 | ||||
| 2025-08-14 | 13F | Partners Capital Investment Group, Llp | 294 974 | −50,05 | 29 329 | −50,08 | ||||
| 2025-08-27 | 13F | Barnes Wealth Management Group, Inc | 13 121 | 2,36 | 1 305 | 2,27 | ||||
| 2025-07-25 | 13F | Northwest Capital Management Inc | 2 325 | −32,22 | 231 | −32,26 | ||||
| 2025-08-05 | 13F | Astra Wealth Partners LLC | 0 | −100,00 | 0 | |||||
| 2025-08-15 | 13F | Morgan Stanley | 250 650 | 28,60 | 24 922 | 28,53 | ||||
| 2025-08-12 | 13F | Coldstream Capital Management Inc | 17 864 | −3,81 | 1 776 | −3,84 | ||||
| 2025-07-21 | 13F | Ameritas Advisory Services, LLC | 32 190 | −36,03 | 3 201 | −35,92 | ||||
| 2025-07-23 | 13F | Tcfg Wealth Management, Llc | 8 995 | −7,51 | 894 | −7,55 | ||||
| 2025-08-08 | 13F | Atlantic Trust, LLC | 1 377 | 0,00 | 137 | 0,00 | ||||
| 2025-07-10 | 13F | Focus Financial Network, Inc. | 0 | −100,00 | 0 | |||||
| 2025-07-24 | 13F | IFP Advisors, Inc | 16 747 | −8,03 | 1 665 | −8,06 | ||||
| 2025-08-12 | 13F | Prudential Plc | 0 | −100,00 | 0 | |||||
| 2025-07-30 | 13F | Strategic Blueprint, LLC | 2 140 | −15,62 | 213 | −15,87 | ||||
| 2025-08-11 | 13F | Traub Capital Management LLC | 23 522 | 2 339 | ||||||
| 2025-07-28 | 13F | Harbour Investments, Inc. | 24 | 0,00 | 2 | 0,00 | ||||
| 2025-08-12 | 13F | Kohmann Bosshard Financial Services, LLC | 5 363 | −34,80 | 533 | −34,84 | ||||
| 2025-08-04 | 13F | One Day In July LLC | 257 744 | 40,90 | 25 628 | 40,82 | ||||
| 2025-08-14 | 13F | Integrated Wealth Concepts LLC | 218 687 | 26,21 | 21 744 | 26,13 | ||||
| 2025-05-15 | 13F/A | Orion Portfolio Solutions, LLC | 38 768 | 6,06 | 3 857 | 6,43 | ||||
| 2025-08-05 | 13F | Prosperity Consulting Group, LLC | 51 843 | 5 155 | ||||||
| 2025-08-12 | 13F | Financial Advocates Investment Management | 129 678 | −1,12 | 12 894 | −1,18 | ||||
| 2025-07-23 | 13F | Opulen Financial Group LLC | 7 194 | 10,85 | 715 | 10,85 | ||||
| 2025-07-22 | 13F | DBK Financial Counsel, LLC | 126 532 | 15,44 | 12 581 | 15,38 | ||||
| 2025-08-12 | 13F | Journey Strategic Wealth Llc | 2 200 | −0,90 | 219 | −0,91 | ||||
| 2025-08-12 | 13F | Jefferies Financial Group Inc. | 0 | −100,00 | 0 | |||||
| 2025-07-31 | 13F | Darden Wealth Group Inc | 4 909 | 488 | ||||||
| 2025-07-31 | 13F | Carrera Capital Advisors | 46 655 | 14,33 | 4 639 | 14,26 | ||||
| 2025-08-14 | 13F | Napa Wealth Management | 80 409 | 2 118,18 | 7 995 | 2 120,83 | ||||
| 2025-08-14 | 13F | Goldman Sachs Group Inc | 61 864 | 200,47 | 6 151 | 200,34 | ||||
| 2025-08-14 | 13F | Toroso Investments, LLC | 34 357 | −58,24 | 3 416 | −58,27 | ||||
| 2025-07-28 | 13F | Acorn Financial Advisory Services Inc /adv | 41 071 | −1,53 | 4 084 | −1,59 | ||||
| 2025-08-14 | 13F | Bank Of America Corp /de/ | 1 398 948 | −1,69 | 139 097 | −1,75 | ||||
| 2025-07-18 | 13F | Truist Financial Corp | 266 033 | 61,97 | 26 452 | 61,87 | ||||
| 2025-08-08 | 13F | Avantax Advisory Services, Inc. | 14 829 | 9,78 | 1 474 | 9,75 | ||||
| 2025-08-12 | 13F | Steward Partners Investment Advisory, Llc | 33 748 | 107,41 | 3 356 | 107,35 | ||||
| 2025-08-06 | 13F | Wedbush Securities Inc | 30 414 | −2,22 | 3 | 0,00 | ||||
| 2025-07-14 | 13F | Caitlin John, LLC | 47 906 | 25,06 | 4 763 | 24,98 | ||||
| 2025-08-08 | 13F | WealthTrust Asset Management, LLC | 46 013 | −59,26 | 4 575 | −59,29 | ||||
| 2025-07-31 | 13F | Moloney Securities Asset Management, LLC | 4 311 | 6,84 | 429 | 6,73 | ||||
| 2025-07-16 | 13F | Essex Financial Services, Inc. | 20 229 | 6,31 | 2 011 | 6,23 | ||||
| 2025-08-11 | 13F | Aptus Capital Advisors, LLC | 629 | 0,00 | 63 | 0,00 | ||||
| 2025-08-05 | 13F | Castlekeep Investment Advisors Llc | 127 671 | −7,36 | 12 694 | −7,42 | ||||
| 2025-08-07 | 13F | 1620 Investment Advisors, Inc. | 100 | 0,00 | 10 | 0,00 | ||||
| 2025-07-22 | 13F | Belpointe Asset Management LLC | 11 112 | 6,15 | 1 105 | 6,05 | ||||
| 2025-08-11 | 13F | Private Advisor Group, LLC | 142 431 | 37,25 | 14 162 | 37,17 | ||||
| 2025-07-18 | 13F | New Wave Wealth Advisors Llc | 21 786 | −57,34 | 2 166 | −57,37 | ||||
| 2025-08-13 | 13F | EverSource Wealth Advisors, LLC | 21 126 | 1,57 | 2 101 | 1,50 | ||||
| 2025-08-08 | 13F | Fortis Group Advisors, LLC | 123 761 | 36,38 | 12 303 | 36,28 | ||||
| 2025-07-30 | NP | Northern Lights Fund Trust IV - Brookstone Ultra-Short Bond ETF | 143 702 | 3,64 | 14 290 | 3,61 | ||||
| 2025-04-01 | 13F | Cornerstone Planning, LLC | 69 739 | 6 915 | ||||||
| 2025-08-13 | 13F | Victory Financial Group, Llc | 25 313 | 27,64 | 2 517 | 27,52 | ||||
| 2025-08-14 | 13F | Money Concepts Capital Corp | 59 648 | −8,32 | 5 931 | −8,37 | ||||
| 2025-08-13 | 13F | Baird Financial Group, Inc. | 41 168 | 0,43 | 4 093 | 0,37 | ||||
| 2025-07-30 | 13F/A | KPP Advisory Services LLC | 42 148 | 21,49 | 4 191 | 21,41 | ||||
| 2025-08-12 | 13F | Jpmorgan Chase & Co | 53 384 | 54,36 | 5 308 | 54,30 | ||||
| 2025-08-04 | 13F | JDM Financial Group LLC | 178 | 0,00 | 18 | 0,00 | ||||
| 2025-08-14 | 13F | Aqr Capital Management Llc | 229 093 | 72,76 | 22 779 | 72,65 | ||||
| 2025-07-25 | 13F | Priebe Wealth Holdings LLC | 33 732 | 99,73 | 3 354 | 99,58 | ||||
| 2025-07-11 | 13F | Farther Finance Advisors, LLC | 28 461 | 8,52 | 2 830 | 8,81 | ||||
| 2025-07-24 | 13F | Etesian Wealth Advisors, Inc. | 2 024 | 0,00 | 201 | 0,00 | ||||
| 2025-09-04 | 13F | ZynergyRetirementPlanningLLC | 0 | −100,00 | 0 | |||||
| 2025-08-13 | 13F | Flow Traders U.s. Llc | 40 007 | 101,82 | 4 | 200,00 | ||||
| 2025-08-05 | 13F | Simplex Trading, Llc | 0 | −100,00 | 0 | |||||
| 2025-08-14 | 13F | Great Valley Advisor Group, Inc. | 8 622 | −1,38 | 857 | −1,38 | ||||
| 2025-07-25 | 13F | Concurrent Investment Advisors, LLC | 51 347 | 18,46 | 5 105 | 18,39 | ||||
| 2025-07-25 | 13F | Total Clarity Wealth Management, Inc. | 35 183 | −46,26 | 3 498 | −46,11 | ||||
| 2025-08-14 | 13F | Mercer Global Advisors Inc /adv | 44 824 | 1 084,57 | 4 457 | 1 085,11 | ||||
| 2025-08-13 | 13F | Vertex Planning Partners, LLC | 11 401 | 393,34 | 1 134 | 394,76 | ||||
| 2025-07-15 | 13F | Fifth Third Bancorp | 852 | 0,00 | 85 | 0,00 | ||||
| 2025-08-13 | 13F | Cary Street Partners Financial Llc | 2 500 | 0,00 | 249 | 0,00 | ||||
| 2025-04-29 | 13F | Hm Payson & Co | 56 469 | −0,70 | 5 618 | −0,35 | ||||
| 2025-08-13 | 13F | Renaissance Technologies Llc | 0 | −100,00 | 0 | |||||
| 2025-08-08 | 13F | Hibernia Wealth Partners, LLC | 75 902 | 98,86 | 7 547 | 98,74 | ||||
| 2025-08-05 | 13F | Summit Investment Advisory Services, LLC | 0 | −100,00 | 0 | |||||
| 2025-08-14 | 13F | Ameriprise Financial Inc | 1 133 420 | 32,23 | 112 749 | 32,30 | ||||
| 2025-07-15 | 13F | Hofer & Associates. Inc | 2 939 | −11,66 | 292 | −11,52 | ||||
| 2025-07-15 | 13F | Capstone Wealth Management Group LLC | 44 286 | 10,73 | 4 403 | 10,68 | ||||
| 2025-07-08 | 13F | Parallel Advisors, LLC | 8 763 | 7,01 | 871 | 7,00 | ||||
| 2025-08-11 | 13F | Portside Wealth Group, LLC | 3 259 | −2,04 | 324 | −2,11 | ||||
| 2025-08-14 | 13F | Jane Street Group, Llc | 82 190 | 110,15 | 8 172 | 110,02 | ||||
| 2025-08-13 | 13F | Colonial Trust Co / SC | 426 | 123,04 | 42 | 133,33 | ||||
| 2025-08-14 | 13F | Stifel Financial Corp | 61 041 | 23,94 | 6 069 | 23,86 | ||||
| 2025-07-24 | 13F | Ronald Blue Trust, Inc. | 18 827 | −20,02 | 1 872 | −20,11 | ||||
| 2025-07-18 | 13F | Marks Wealth, LLC | 3 364 | 334 | ||||||
| 2025-07-24 | 13F | Weaver Capital Management LLC | 3 420 | 47,16 | 340 | 47,19 | ||||
| 2025-07-08 | 13F | Advance Capital Management, Inc. | 4 749 | −5,79 | 472 | −5,79 | ||||
| 2025-07-23 | 13F | Steel Peak Wealth Management LLC | 2 924 | 291 | ||||||
| 2025-08-08 | 13F | Meridian Wealth Management, LLC | 3 275 | 38,13 | 326 | 38,30 | ||||
| 2025-08-14 | 13F | Old Mission Capital Llc | 0 | −100,00 | 0 | |||||
| 2025-08-14 | 13F | EP Wealth Advisors, Inc. | 35 020 | −38,88 | 3 482 | −38,91 | ||||
| 2025-08-12 | 13F | AlphaCore Capital LLC | 80 546 | 24,49 | 8 009 | 24,41 | ||||
| 2025-08-14 | 13F | Financial Network Wealth Advisors LLC | 534 | 2,10 | 53 | 1,92 | ||||
| 2025-08-06 | 13F | Commonwealth Equity Services, Llc | 463 841 | 2,68 | 46 | 4,55 | ||||
| 2025-08-19 | 13F | Delos Wealth Advisors, LLC | 112 105 | −4,20 | 11 147 | −4,26 | ||||
| 2025-05-13 | 13F | Beacon Pointe Advisors, LLC | 0 | −100,00 | 0 | |||||
| 2025-07-01 | 13F | Harbor Investment Advisory, Llc | 352 | 590,20 | 35 | 580,00 | ||||
| 2025-07-07 | 13F | Kings Path Partners LLC | 2 128 | −69,47 | 212 | −69,55 | ||||
| 2025-07-30 | 13F | Principle Wealth Partners Llc | 3 122 | 0,00 | 310 | 0,00 | ||||
| 2025-08-19 | 13F | Advisory Services Network, LLC | 26 153 | 2 600 | ||||||
| 2025-04-16 | 13F | GEN Financial Management, INC. | 0 | −100,00 | 0 | |||||
| 2025-07-15 | 13F | MCF Advisors LLC | 12 858 | −13,18 | 1 278 | −13,24 | ||||
| 2025-07-01 | 13F | Kera Capital Partners, Inc. | 76 339 | 7 590 | ||||||
| 2025-07-29 | 13F | Salomon & Ludwin, LLC | 0 | −100,00 | 0 | |||||
| 2025-08-12 | 13F | Running Point Capital Advisors, LLC | 255 113 | 88,30 | 25 366 | 88,18 | ||||
| 2025-07-25 | 13F | MOKAN Wealth Management Inc. | 111 071 | 7,51 | 11 044 | 7,45 | ||||
| 2025-07-31 | 13F | Waldron Private Wealth LLC | 63 010 | −13,33 | 6 265 | −13,37 | ||||
| 2025-08-14 | 13F | Two Sigma Securities, Llc | 8 449 | 840 | ||||||
| 2025-08-11 | 13F | One Capital Management, LLC | 18 822 | 1 871 | ||||||
| 2025-07-16 | 13F | Pacific Sage Partners, LLC | 70 141 | 116,71 | 6 974 | 116,58 | ||||
| 2025-08-05 | 13F | C2P Capital Advisory Group, LLC d.b.a. Prosperity Capital Advisors | 0 | −100,00 | 0 | |||||
| 2025-08-14 | 13F | GWM Advisors LLC | 104 490 | −23,15 | 10 389 | −23,20 | ||||
| 2025-08-06 | 13F | Csenge Advisory Group | 3 790 | 377 | ||||||
| 2025-05-15 | 13F | Lido Advisors, LLC | 0 | −100,00 | 0 | |||||
| 2025-05-15 | 13F | National Wealth Management Group, LLC | 0 | −100,00 | 0 | |||||
| 2025-05-07 | 13F/A | Meridian Management Co | 0 | −100,00 | 0 | −100,00 | ||||
| 2025-08-04 | 13F | Spire Wealth Management | 1 000 | 0,00 | 99 | 0,00 | ||||
| 2025-07-14 | 13F | Armstrong Advisory Group, Inc | 377 | −99,77 | 38 | −99,78 | ||||
| 2025-07-28 | 13F | Mutual Advisors, LLC | 0 | −100,00 | 0 | |||||
| 2025-08-08 | 13F | Good Life Advisors, LLC | 12 536 | 2,28 | 1 246 | 2,21 | ||||
| 2025-08-14 | 13F | Modern Wealth Management, LLC | 4 405 | −13,13 | 438 | −13,10 | ||||
| 2025-07-29 | 13F | Woodard & Co Asset Management Group Inc /adv | 4 502 | −13,12 | 448 | −13,20 | ||||
| 2025-06-26 | NP | WLTG - WealthTrust DBS Long Term Growth ETF | 75 347 | 763,87 | 7 496 | 763,59 | ||||
| 2025-07-15 | 13F | Sightline Wealth Advisors, LLC | 9 968 | 5,51 | 991 | 5,54 | ||||
| 2025-05-06 | 13F | Kelman-Lazarov, Inc. | 0 | −100,00 | 0 | |||||
| 2025-08-14 | 13F | Mariner, LLC | 22 980 | 0,26 | 2 285 | 0,18 | ||||
| 2025-08-11 | 13F | Promethium Advisors,llc | 71 734 | 51,17 | 7 133 | 51,07 | ||||
| 2025-08-06 | 13F | Long Run Wealth Advisors, LLC | 108 203 | 20,09 | 10 759 | 20,01 | ||||
| 2025-04-14 | 13F | NavPoint Financial, Inc. | 0 | −100,00 | 0 | |||||
| 2025-07-15 | 13F | Sheets Smith Wealth Management | 16 529 | −6,56 | 1 643 | −6,59 | ||||
| 2025-08-13 | 13F | Virtue Capital Management, LLC | 0 | −100,00 | 0 | |||||
| 2025-08-12 | 13F | Choate Investment Advisors | 120 750 | −3,38 | 12 006 | −3,43 | ||||
| 2025-08-14 | 13F/A | Rockefeller Capital Management L.P. | 126 120 | 82,75 | 12 540 | 82,64 | ||||
| 2025-07-16 | 13F | Embree Financial Group | 6 257 | −19,71 | 622 | −19,74 | ||||
| 2025-08-12 | 13F | Proequities, Inc. | 0 | 0 | ||||||
| 2025-07-24 | 13F/A | TFR Capital, LLC. | 23 369 | −8,05 | 2 324 | −8,11 | ||||
| 2025-08-14 | 13F | Ieq Capital, Llc | 25 122 | 0,00 | 2 498 | −0,08 | ||||
| 2025-08-08 | 13F | Creative Planning | 5 500 | 35,37 | 547 | 35,15 | ||||
| 2025-08-14 | 13F | Wiley Bros.-aintree Capital, Llc | 11 753 | 1,52 | 1 169 | 1,48 | ||||
| 2025-07-22 | 13F | Schwab Charitable Fund | 7 666 | −51,12 | 762 | −51,15 | ||||
| 2025-08-06 | 13F | Sound Financial Strategies Group, LLC | 11 930 | 78,41 | 1 186 | 78,35 | ||||
| 2025-08-06 | 13F | Stokes Family Office, LLC | 10 300 | 51,47 | 1 024 | 51,48 | ||||
| 2025-08-06 | 13F | Pekin Hardy Strauss, Inc. | 9 490 | 56,09 | 944 | 56,13 | ||||
| 2025-07-21 | 13F | Tilia Fiduciary Partners, Inc. | 0 | −100,00 | 0 | |||||
| 2025-07-14 | 13F | Opal Wealth Advisors, LLC | 5 588 | −15,56 | 556 | −15,65 | ||||
| 2025-08-14 | 13F | Sargent Investment Group, LLC | 600 218 | 3,32 | 59 548 | 3,03 | ||||
| 2025-08-13 | 13F | Northwestern Mutual Wealth Management Co | 129 475 | 19,43 | 12 874 | 19,36 | ||||
| 2025-07-14 | 13F | Stapp Wealth Management, Pllc | 3 180 | −16,62 | 316 | −16,62 | ||||
| 2025-07-30 | 13F | Cullen/frost Bankers, Inc. | 1 000 | 99 | ||||||
| 2025-08-13 | 13F | Luminist Capital LLC | 1 469 | −11,45 | 146 | −11,59 | ||||
| 2025-07-30 | 13F | Eqis Capital Management, Inc. | 3 682 | 56,61 | 366 | 57,08 | ||||
| 2025-04-29 | 13F | Checchi Capital Advisers, LLC | 0 | −100,00 | 0 | −100,00 | ||||
| 2025-07-16 | 13F | Novem Group | 2 322 | −24,27 | 231 | −24,59 | ||||
| 2025-07-17 | 13F | SeaBridge Investment Advisors LLC | 49 727 | 116,10 | 4 944 | 115,99 | ||||
| 2025-07-23 | 13F | Valmark Advisers, Inc. | 79 190 | 8,62 | 7 874 | 8,55 | ||||
| 2025-07-30 | 13F | Brookstone Capital Management | 51 855 | 5 156 | ||||||
| 2025-08-12 | 13F | Belmont Capital, LLC | 0 | −100,00 | 0 | |||||
| 2025-07-18 | 13F | Lynx Investment Advisory | 9 935 | 7,22 | 988 | 7,17 | ||||
| 2025-08-06 | 13F | Entrewealth, Llc | 85 941 | −8,70 | 8 545 | −8,76 | ||||
| 2025-07-31 | 13F | SoundView Advisors Inc. | 274 348 | 2,36 | 27 | 3,85 | ||||
| 2025-08-06 | 13F | AE Wealth Management LLC | 2 031 | 1,65 | 202 | 1,52 | ||||
| 2025-08-01 | 13F | Envestnet Asset Management Inc | 478 109 | 19,29 | 47 538 | 19,21 | ||||
| 2025-08-05 | 13F | Bank Of Montreal /can/ | 5 464 | 14,19 | 542 | 13,66 | ||||
| 2025-08-13 | 13F | Mount Yale Investment Advisors, LLC | 452 | 45 | ||||||
| 2025-08-14 | 13F | Raymond James Financial Inc | 181 239 | 7,43 | 18 021 | 7,37 | ||||
| 2025-08-14 | 13F | Kovitz Investment Group Partners, LLC | 172 723 | 13,51 | 17 174 | 13,44 | ||||
| 2025-07-15 | 13F | Carr Financial Group Corp | 25 554 | −3,57 | 2 541 | −3,64 | ||||
| 2025-08-14 | 13F | Ausdal Financial Partners, Inc. | 18 199 | 8,87 | 1 810 | 8,78 | ||||
| 2025-08-14 | 13F | Principia Wealth Advisory, LLC | 38 | 0,00 | 4 | 0,00 | ||||
| 2025-04-23 | 13F | Vectors Research Management, LLC | 0 | −100,00 | 0 | |||||
| 2025-07-14 | 13F | GAMMA Investing LLC | 8 658 | −80,13 | 861 | −80,16 | ||||
| 2025-08-14 | 13F | Destination Wealth Management | 2 547 | 0,00 | 253 | 0,00 | ||||
| 2025-07-09 | 13F | Alesco Advisors Llc | 8 686 | −13,88 | 864 | −13,96 | ||||
| 2025-07-14 | 13F | Iams Wealth Management, Llc | 30 838 | 0,98 | 3 067 | 0,92 | ||||
| 2025-07-25 | 13F | Transcendent Capital Group LLC | 7 955 | −80,87 | 791 | −80,90 | ||||
| 2025-08-14 | 13F | UBS Group AG | 403 026 | 8,38 | 40 073 | 8,31 | ||||
| 2025-08-11 | 13F | Nordwand Advisors, LLC | 1 933 | 192 | ||||||
| 2025-07-22 | 13F | Legacy CG, LLC | 2 292 | −37,45 | 228 | −37,64 | ||||
| 2025-08-18 | 13F | Hershey Financial Advisers, LLC | 46 579 | −25,28 | 4 631 | −25,06 | ||||
| 2025-07-10 | 13F | Western Pacific Wealth Management, LP | 400 | 40 | ||||||
| 2025-07-29 | 13F | May Barnhard Investments LLC | 4 111 | 6,97 | 409 | 6,81 | ||||
| 2025-08-12 | 13F | Global Retirement Partners, LLC | 0 | −100,00 | 0 | |||||
| 2025-08-14 | 13F | CoreCap Advisors, LLC | 52 618 | 3,96 | 5 232 | 3,89 | ||||
| 2025-07-17 | 13F | Nelson, Van Denburg & Campbell Wealth Management Group, LLC | 7 072 | −2,16 | 703 | −2,23 | ||||
| 2025-08-11 | 13F | Citigroup Inc | 49 095 | 4 882 | ||||||
| 2025-07-25 | 13F | We Are One Seven, LLC | 16 277 | −26,02 | 1 618 | −26,08 | ||||
| 2025-07-31 | 13F | Turning Point Benefit Group, Inc. | 8 314 | −4,03 | 827 | −3,84 | ||||
| 2025-08-05 | 13F | Sigma Planning Corp | 4 975 | 8,03 | 495 | 7,86 | ||||
| 2025-08-11 | 13F | Tidemark, LLC | 7 209 | −3,49 | 717 | −3,63 | ||||
| 2025-08-12 | 13F | Nemes Rush Group LLC | 7 064 | 19,45 | 702 | 19,39 | ||||
| 2025-08-11 | 13F | HighTower Advisors, LLC | 91 438 | 7,98 | 9 092 | 7,92 | ||||
| 2025-09-09 | 13F | NWF Advisory Services Inc. | 2 274 | 226 | ||||||
| 2025-08-11 | 13F | Retirement Capital Strategies | 59 276 | 34,17 | 5 894 | 34,08 | ||||
| 2025-09-04 | 13F/A | Advisor Group Holdings, Inc. | 433 925 | −24,63 | 43 148 | −24,67 | ||||
| 2025-08-12 | 13F | CIBC Private Wealth Group, LLC | 1 100 | −19,83 | 109 | −19,85 | ||||
| 2025-08-11 | 13F | Perennial Investment Advisors, LLC | 4 258 | 423 | ||||||
| 2025-08-11 | 13F | Advisor Resource Council | 8 379 | −76,60 | 833 | −69,48 | ||||
| 2025-08-15 | 13F | Equitable Holdings, Inc. | 107 823 | −2,97 | 10 721 | −3,03 | ||||
| 2025-07-17 | 13F | Janney Montgomery Scott LLC | 68 131 | −7,86 | 7 | −14,29 | ||||
| 2025-05-02 | 13F | Lokken Investment Group LLC | 0 | −100,00 | 0 | −100,00 | ||||
| 2025-07-29 | 13F | Values First Advisors, Inc. | 13 765 | −6,82 | 1 369 | −6,88 | ||||
| 2025-07-30 | 13F | Onyx Bridge Wealth Group LLC | 42 638 | −1,77 | 4 240 | −1,83 | ||||
| 2025-08-08 | 13F | Altiora Financial Group, LLC | 93 772 | −11,57 | 9 324 | −11,62 | ||||
| 2025-07-14 | 13F | Wooster Corthell Wealth Management, Inc. | 73 464 | 106,38 | 7 305 | 106,27 | ||||
| 2025-08-07 | 13F | Proficio Capital Partners LLC | 164 099 | −73,08 | 16 316 | −73,03 | ||||
| 2025-04-22 | 13F | Tower View Investment Management & Research LLC | 0 | −100,00 | 0 | |||||
| 2025-04-22 | 13F | Bright Futures Wealth Management, LLC. | 6 671 | 139,28 | 663 | 138,99 | ||||
| 2025-08-04 | 13F | Creative Financial Designs Inc /adv | 26 | 0,00 | 3 | 0,00 | ||||
| 2025-08-11 | 13F | Insight 2811, Inc. | 4 635 | −35,04 | 461 | −35,12 | ||||
| 2025-08-11 | 13F | Strategic Wealth Partners, Ltd. | 75 765 | −7,88 | 7 533 | −7,72 | ||||
| 2025-08-13 | 13F | Townsquare Capital Llc | 0 | −100,00 | 0 | |||||
| 2025-07-17 | 13F | CWA Asset Management Group, LLC | 209 539 | −7,07 | 20 834 | −7,12 | ||||
| 2025-08-14 | 13F | Comerica Bank | 1 152 | 0,00 | 115 | 0,00 | ||||
| 2025-09-04 | 13F | Beacon Capital Management, Inc. | 65 886 | −16,89 | 6 551 | −16,79 | ||||
| 2025-08-13 | 13F | Portland Global Advisors LLC | 39 662 | −28,38 | 3 944 | −28,43 | ||||
| 2025-08-14 | 13F | Citadel Advisors Llc | 64 628 | −1,82 | 6 426 | −1,88 | ||||
| 2025-08-14 | 13F | IHT Wealth Management, LLC | 3 950 | −11,24 | 393 | −11,31 | ||||
| 2025-08-14 | 13F | Peak Asset Management, LLC | 198 943 | 1,29 | 19 781 | 1,23 | ||||
| 2025-08-27 | 13F/A | Brinker Capital Investments, LLC | 20 222 | −47,84 | 2 011 | −47,89 | ||||
| 2025-08-14 | 13F | Betterment LLC | 3 316 | 0 | ||||||
| 2025-08-12 | 13F | Wealth Advisors of Iowa, LLC | 9 811 | 976 | ||||||
| 2025-08-12 | 13F | O'shaughnessy Asset Management, Llc | 5 003 | −52,43 | 497 | −52,49 | ||||
| 2025-08-12 | 13F | Calton & Associates, Inc. | 75 373 | 118,00 | 7 494 | 117,91 | ||||
| 2025-07-25 | 13F | Cwm, Llc | 1 875 910 | −7,48 | 187 | −7,46 | ||||
| 2025-08-12 | 13F | LPL Financial LLC | 3 276 982 | 14,16 | 325 830 | 14,09 | ||||
| 2025-05-12 | 13F | Independent Advisor Alliance | 0 | −100,00 | 0 | |||||
| 2025-07-31 | 13F | Ndwm Llc | 140 079 | −16,54 | 13 928 | −16,58 | ||||
| 2025-08-13 | 13F | Cerity Partners LLC | 174 125 | 169,14 | 17 313 | 169,00 | ||||
| 2025-08-13 | 13F | Keystone Financial Group | 9 306 | 0,00 | 925 | 0,00 | ||||
| 2025-05-14 | 13F | Huntington National Bank | 20 | |||||||
| 2025-08-08 | 13F | Cetera Investment Advisers | 458 535 | 7,32 | 45 592 | 7,26 | ||||
| 2025-08-11 | 13F | Sykon Capital Llc | 10 588 | 66,82 | 1 053 | 66,72 | ||||
| 2025-07-16 | 13F | Highline Wealth Partners Llc | 1 791 | −1,65 | 178 | −1,66 | ||||
| 2025-07-11 | 13F | Petredis Investment Advisors Llc | 0 | −100,00 | 0 | |||||
| 2025-05-06 | 13F | Atria Investments Llc | 0 | −100,00 | 0 | |||||
| 2025-07-28 | 13F | Ritholtz Wealth Management | 2 070 | −70,40 | 206 | −70,50 | ||||
| 2025-08-12 | 13F | MAI Capital Management | 10 224 | 2 034,45 | 1 017 | 2 061,70 | ||||
| 2025-07-16 | 13F | Dakota Wealth Management | 23 825 | 75,77 | 2 369 | 75,67 | ||||
| 2025-08-06 | 13F | Convergence Financial, LLC | 5 705 | −94,33 | 567 | −94,33 | ||||
| 2025-08-04 | 13F | Bay Colony Advisory Group, Inc d/b/a Bay Colony Advisors | 5 160 | −12,42 | 513 | −12,46 | ||||
| 2025-08-14 | 13F | Colony Group, LLC | 16 174 | −8,08 | 1 608 | −8,11 | ||||
| 2025-07-09 | 13F | Dynamic Advisor Solutions LLC | 6 844 | 51,05 | 680 | 51,11 | ||||
| 2025-07-08 | 13F | GK Wealth Management LLC | 10 435 | −5,27 | 1 038 | −5,30 | ||||
| 2025-07-18 | 13F | O'ROURKE & COMPANY, Inc | 14 329 | 297,26 | 1 425 | 297,77 | ||||
| 2025-05-13 | 13F | CacheTech Inc. | 5 125 | 0,00 | 510 | 0,20 | ||||
| 2025-07-18 | 13F | PFG Investments, LLC | 4 533 | −10,82 | 451 | −10,89 | ||||
| 2025-07-29 | 13F | Stratos Wealth Partners, LTD. | 46 544 | 7,93 | 4 628 | 7,86 | ||||
| 2025-08-14 | 13F | First Wilshire Securities Management Inc | 2 133 | −2,42 | 212 | −2,30 | ||||
| 2025-08-13 | 13F | JT Stratford LLC | 2 970 | 295 | ||||||
| 2025-07-30 | 13F | Patten Group, Inc. | 12 788 | 37,64 | 1 272 | 37,55 | ||||
| 2025-07-22 | 13F | Simplicity Wealth,LLC | 4 483 | −56,17 | 446 | −56,24 | ||||
| 2025-08-14 | 13F | Susquehanna International Group, Llp | 106 711 | 298,61 | 10 610 | 298,42 | ||||
| 2025-08-05 | 13F | Plante Moran Financial Advisors, LLC | 3 | 0 | ||||||
| 2025-08-13 | 13F | Russell Investments Group, Ltd. | 0 | −100,00 | 0 | |||||
| 2025-08-14 | 13F | Wells Fargo & Company/mn | 448 581 | 63,54 | 44 602 | 63,44 | ||||
| 2025-08-29 | 13F | Centaurus Financial, Inc. | 20 715 | 0,06 | 2 | 0,00 | ||||
| 2025-08-08 | 13F | Gts Securities Llc | 37 703 | 3 749 | ||||||
| 2025-07-10 | 13F | Wealth Enhancement Advisory Services, Llc | 26 704 | −12,98 | 2 648 | −13,30 | ||||
| 2025-08-08 | 13F | Ogorek Anthony Joseph /ny/ /adv | 2 715 | 0,00 | 0 | |||||
| 2025-07-30 | 13F | Wbh Advisory Inc | 4 063 | 6,14 | 404 | 6,05 | ||||
| 2025-07-16 | 13F | Gradient Capital Advisors, LLC | 26 384 | 80,66 | 2 623 | 80,65 | ||||
| 2025-08-14 | 13F | Mml Investors Services, Llc | 216 762 | 58,14 | 22 | 61,54 | ||||
| 2025-08-07 | 13F | Fonville Wealth Management LLC | 2 445 | 243 | ||||||
| 2025-08-14 | 13F | Atomi Financial Group, Inc. | 0 | −100,00 | 0 | |||||
| 2025-08-14 | 13F | Pecaut & Co. | 376 756 | 0,14 | 37 461 | 0,08 | ||||
| 2025-08-13 | 13F | Gibbs Wealth Management | 6 425 | 639 | ||||||
| 2025-08-07 | 13F | Birchcreek Wealth Management, LLC | 120 933 | 1,19 | 12 024 | 1,14 | ||||
| 2025-08-05 | 13F | Rareview Capital LLC | 44 841 | 4 459 | ||||||
| 2025-08-01 | 13F | Anson Capital, Inc. | 96 355 | 9,12 | 9 581 | 9,06 | ||||
| 2025-08-01 | 13F | Ashton Thomas Private Wealth, LLC | 297 399 | −39,69 | 29 570 | −39,73 | ||||
| 2025-07-23 | 13F | Clear Creek Financial Management, LLC | 9 015 | −13,39 | 896 | −13,43 | ||||
| 2025-08-04 | 13F | Premier Path Wealth Partners, LLC | 2 339 | −22,40 | 233 | −22,41 | ||||
| 2025-07-18 | 13F | Pacific Point Advisors, LLC | 8 496 | −16,20 | 845 | −16,27 | ||||
| 2025-07-25 | NP | SRGAX - Stringer Growth Fund Class A Shares | 17 686 | −2,02 | 1 759 | −2,12 | ||||
| 2025-07-11 | 13F | Eagle Bay Advisors LLC | 0 | −100,00 | 0 | |||||
| 2025-07-25 | 13F | NorthRock Partners, LLC | 420 | −20,75 | 42 | −21,15 | ||||
| 2025-08-15 | 13F | Kestra Advisory Services, LLC | 46 932 | 18,06 | 4 666 | 18,01 | ||||
| 2025-08-13 | 13F | Quadrant Capital Group Llc | 46 343 | −19,57 | 4 608 | −19,63 | ||||
| 2025-04-22 | 13F | Castleview Partners, Llc | 0 | −100,00 | 0 | |||||
| 2025-08-14 | 13F | Acas, Llc | 19 286 | 3,40 | 1 915 | 3,52 | ||||
| 2025-04-28 | 13F | Strategic Financial Concepts, LLC | 0 | −100,00 | 0 | −100,00 | ||||
| 2025-08-28 | NP | RDFI - RAREVIEW DYNAMIC FIXED INCOME ETF | 44 841 | 4 459 | ||||||
| 2025-08-05 | 13F | Fourth Dimension Wealth, LLC | 1 008 | −55,56 | 100 | −55,56 | ||||
| 2025-07-22 | 13F | Wealthcare Advisory Partners LLC | 88 368 | 99,53 | 8 786 | 99,41 | ||||
| 2025-08-08 | 13F | Horizon Family Wealth, Inc. | 121 631 | 4,24 | 12 094 | 4,17 | ||||
| 2025-07-28 | 13F | WJ Wealth Management, LLC | 10 763 | −28,16 | 1 070 | −28,19 |