Grundläggande statistik
| Institutionella ägare | 346 total, 344 long only, 0 short only, 2 long/short - change of −4,13% MRQ |
| Genomsnittlig portföljallokering | 0.8710 % - change of −8,83% MRQ |
| Institutionella aktier (lång) | 152 686 053 (ex 13D/G) - change of 13,16MM shares 9,44% MRQ |
| Institutionellt värde (lång) | $ 7 010 211 USD ($1000) |
Institutionellt ägande och aktieägare
Vanguard Scottsdale Funds - Vanguard Long-Term Corporate Bond ETF (US:VCLT) har 346 Institutionella ägare och aktieägare som har lämnat in 13D/G- eller 13F-formulär till Securities Exchange Commission (SEC). Dessa institut innehar totalt 152,686,053 aktier. Största aktieägare inkluderar Gallagher Fiduciary Advisors, LLC, Prudential Plc, Morgan Stanley, VTC - Vanguard Total Corporate Bond ETF ETF Shares, Meiji Yasuda Life Insurance Co, State of Tennessee, Treasury Department, Allianz Investment Management U.S. LLC, Bank Of America Corp /de/, Charles Schwab Investment Management Inc, and Angeles Investment Advisors, LLC .
Vanguard Scottsdale Funds - Vanguard Long-Term Corporate Bond ETF (NasdaqGM:VCLT) Institutionell ägarstruktur visar institutioners och fonders nuvarande positioner i företaget, samt de senaste förändringarna i positionernas storlek. Större aktieägare kan vara enskilda investerare, fonder, hedgefonder eller institutioner. Bilaga 13D visar att investeraren äger (eller ägde) mer än 5% av företaget och avser (eller avsåg) att aktivt eftersträva en förändring av affärsstrategin. Schedule 13G indikerar en passiv investering på över 5%.
The share price as of September 12, 2025 is 78,16 / share. Previously, on September 13, 2024, the share price was 81,60 / share. This represents a decline of 4,22% over that period.

Fondsentimentets poäng
Fondsentimentet poängen(fka Ägarackumulation-poäng) visar vilka aktier som är mest köpta av fonder. Det är resultatet av en sofistikerad kvantitativ flerfaktormodell som identifierar företag med de högsta nivåerna av institutionell ackumulering. Poängsättningsmodellen använder en kombination av den totala ökningen av redovisade ägare, förändringarna i portföljallokeringarna för dessa ägare och andra mått. Siffran sträcker sig från 0 till 100, där högre siffror indikerar en högre nivå av ackumulering i förhållande till sina konkurrenter, och 50 är genomsnittet.
Uppdateringsfrekvens: Dagligen
Se Ownership Explorer, som innehåller en lista över de högst rankade företagen.
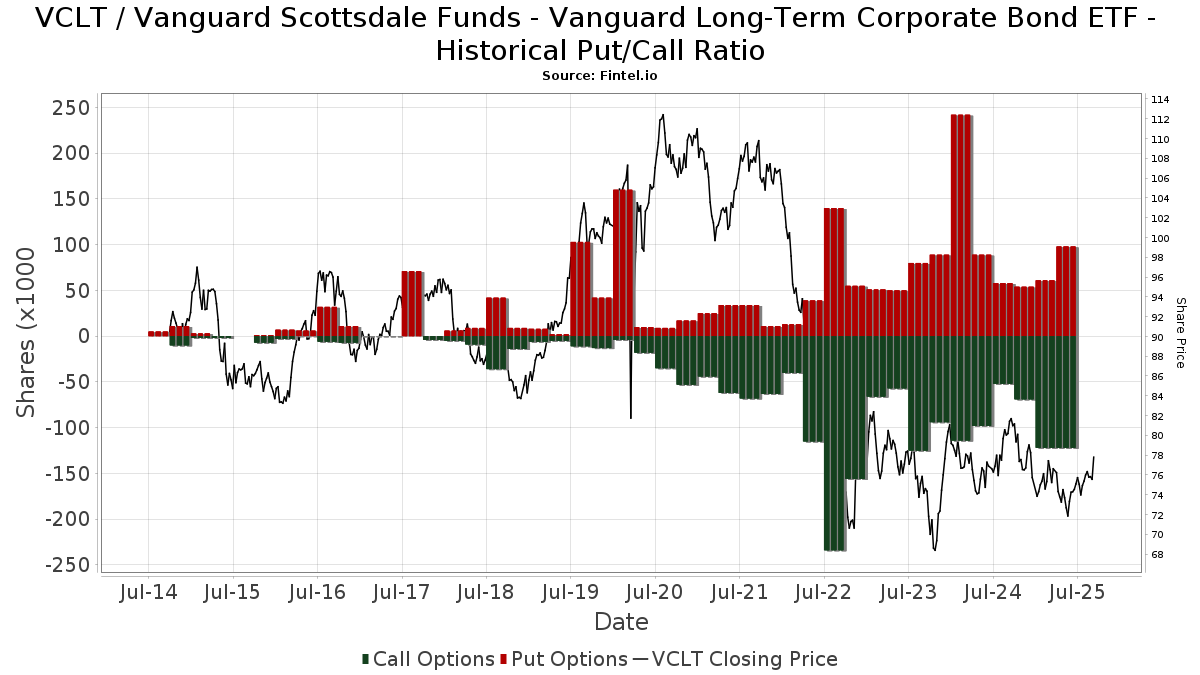
Institutionell sälj/köp-kvot
Förutom att rapportera vanliga eget kapital- och skuldemissioner måste institutioner med mer än 100MM tillgångar under förvaltning också avslöja sina innehav av sälj- och köpoptioner. Eftersom säljoptioner i allmänhet indikerar ett negativt sentiment och köpoptioner indikerar ett positivt sentiment, kan vi få en uppfattning om det övergripande institutionella sentimentet genom att plotta förhållandet mellan säljoptioner och köpoptioner. Diagrammet till höger visar det historiska förhållandet mellan sälj- och köpoptioner för detta instrument.
Genom att använda sälj/köp-kvoten som en indikator på aktieägarnas sentiment undviker man en av de största bristerna med att använda det totala institutionella ägandet, nämligen att en betydande del av de förvaltade tillgångarna investeras passivt för att följa index. Passivt förvaltade fonder köper vanligtvis inte optioner, så indikatorn för sälj/köp-kvoten ger en bättre bild av stämningen i aktivt förvaltade fonder.
13D/G-Arkiveringar
Vi presenterar 13D/G-arkiveringar separat från 13F-arkiveringar på grund av att de behandlas olika av SEC. 13D/G-arkiveringar kan lämnas in av grupper av investerare (med en ledare), medan 13F-arkiveringar inte kan det. Detta leder till situationer där en investerare kan lämna in en 13D/G-ansökan med ett värde för de totala aktierna (vilket motsvarar alla aktier som ägs av investerargruppen), men sedan lämna in en 13F-ansökan med ett annat värde för de totala aktierna (vilket motsvarar enbart deras eget ägande). Detta innebär att aktieägandet i 13D/G-arkiveringar och 13F-arkiveringar ofta inte är direkt jämförbara, så vi presenterar dem separat.
Notera: Från och med den 16 maj 2021 visar vi inte längre ägare som inte har lämnat in en 13D/G under det senaste året. Tidigare visade vi hela historiken för 13D/G-arkiveringar. I allmänhet måste enheter som är skyldiga att lämna in 13D/G-arkiveringar lämna in minst en gång per år innan de lämnar in en stängningsarkivering. Fonder avslutar dock ibland positioner utan att lämna in en avslutande arkivering (dvs. de avvecklar), så att visa hela historiken resulterade ibland i förvirring om det nuvarande ägandet. För att förhindra förvirring visar vi nu endast "nuvarande" ägare - det vill säga ägare som har lämnat in en ansökan under det senaste året.
Upgrade to unlock premium data.
| Fil Datum | Formulär | Investerare | Föregående aktier |
Senaste aktier |
Δ Aktier (Procent) |
Ägande (Procent) |
Δ Ägande (Procent) |
|
|---|---|---|---|---|---|---|---|---|
| 2025-07-15 | BlackRock Portfolio Management LLC | 7,394,021 | 622,629 | -91.58 | 0.50 | -90.57 |
13F- och NPORT-arkiveringar
Detaljer om 13F-arkiveringar är gratis. Detaljer om NP-arkiveringar kräver ett premiummedlemskap. Gröna rader indikerar nya positioner. Röda rader indikerar stängda positioner. Klicka på länk symbolen för att se hela transaktionshistoriken.
Uppgradera
för att låsa upp premiumdata och exportera till Excel ![]() .
.
| Fil Datum | Källa | Investerare | Typ | Genomsnittligt pris (beräknat) |
Aktier | Δ Aktier (%) |
Rapporterat värde (1000 USD) |
Δ Värde (%) |
Portföljallokering (%) |
|
|---|---|---|---|---|---|---|---|---|---|---|
| 2025-08-14 | 13F | Raymond James Financial Inc | 694 259 | −3,41 | 52 694 | −3,42 | ||||
| 2025-07-23 | 13F | H&H Retirement Design & Management INC | 99 207 | 9,50 | 7 422 | 13,38 | ||||
| 2025-07-28 | 13F | Sagace Wealth Management LLC | 42 973 | 1,88 | 3 262 | 1,87 | ||||
| 2025-07-22 | 13F | Sage Investment Counsel LLC | 5 265 | 0,00 | 400 | 0,00 | ||||
| 2025-07-22 | 13F | Oak Hill Wealth Advisors, Llc | 6 163 | 459 | ||||||
| 2025-08-07 | 13F | Alpha Cubed Investments, LLC | 8 269 | 628 | ||||||
| 2025-08-14 | 13F | Citadel Advisors Llc | 77 737 | −76,63 | 5 900 | −76,63 | ||||
| 2025-07-28 | 13F | Perfromance Wealth Partners, LLC | 4 291 | −24,67 | 326 | −24,77 | ||||
| 2025-08-08 | 13F | Hartland & Co., LLC | 0 | −100,00 | 0 | |||||
| 2025-08-14 | 13F | Citadel Advisors Llc | Put | 15 800 | 12,86 | 1 199 | 12,90 | |||
| 2025-08-14 | 13F | Citadel Advisors Llc | Call | 6 700 | 31,37 | 509 | 31,27 | |||
| 2025-07-25 | 13F | NorthRock Partners, LLC | 906 | 655,00 | 69 | 655,56 | ||||
| 2025-07-23 | 13F | Kingswood Wealth Advisors, Llc | 26 927 | 0,89 | 2 044 | 0,89 | ||||
| 2025-08-08 | 13F | Pnc Financial Services Group, Inc. | 163 392 | −19,37 | 12 401 | −19,38 | ||||
| 2025-07-31 | 13F | City State Bank | 48 | 0,00 | 4 | 0,00 | ||||
| 2025-05-15 | 13F | BTG Pactual Asset Management US LLC | 0 | −100,00 | 0 | |||||
| 2025-08-11 | 13F | Lcnb Corp | 5 190 | 4,05 | 394 | 3,97 | ||||
| 2025-08-15 | 13F | Morgan Stanley | 5 324 964 | −8,63 | 404 165 | −8,64 | ||||
| 2025-08-14 | 13F | Bnp Paribas | 118 378 | 2 534,13 | 8 985 | 2 534,60 | ||||
| 2025-08-14 | 13F | Transamerica Financial Advisors, Inc. | 4 | 0,00 | 0 | |||||
| 2025-08-14 | 13F | CoreCap Advisors, LLC | 9 615 | −97,81 | 730 | −97,81 | ||||
| 2025-08-28 | NP | SCLAX - SIMT MULTI-ASSET CAPITAL STABILITY FUND Class F | 1 901 | −43,96 | 144 | −43,97 | ||||
| 2025-08-15 | 13F | United Services Automobile Association | 189 350 | −50,00 | 14 372 | −49,91 | ||||
| 2025-07-15 | 13F | Fifth Third Bancorp | 557 | 1,09 | 42 | 2,44 | ||||
| 2025-08-13 | 13F | Jones Financial Companies Lllp | 54 236 | 8,49 | 4 079 | 7,91 | ||||
| 2025-08-05 | 13F | McGinn Investment Management, Inc. | 0 | −100,00 | 0 | |||||
| 2025-08-06 | 13F | Wedbush Securities Inc | 0 | −100,00 | 0 | |||||
| 2025-08-29 | NP | BHILX - BHILL Fund Managed Account Completion Shares | 18 416 | 1 398 | ||||||
| 2025-08-05 | 13F | NewSquare Capital LLC | 59 597 | 2,92 | 4 523 | 2,91 | ||||
| 2025-07-29 | 13F | Stableford Capital Ii Llc | 3 689 | 4,56 | 278 | 6,95 | ||||
| 2025-07-29 | 13F | Tide Cove Capital Partners LLC | 31 293 | 2,62 | 2 345 | 1,30 | ||||
| 2025-08-14 | 13F | Sunbelt Securities, Inc. | 300 | −0,66 | 22 | 0,00 | ||||
| 2025-08-05 | 13F | Bank Of Montreal /can/ | 2 727 | 0,07 | 207 | 0,00 | ||||
| 2025-08-14 | 13F | Cardiff Park Advisors, Llc | 280 | 1,45 | 21 | 5,00 | ||||
| 2025-07-22 | 13F | Checchi Capital Advisers, LLC | 28 080 | −82,94 | 2 131 | −82,94 | ||||
| 2025-08-06 | 13F | Anchor Capital Advisors Llc | 4 135 | 0,00 | 314 | 0,00 | ||||
| 2025-07-23 | 13F | WestEnd Advisors, LLC | 533 | 17,66 | 40 | 17,65 | ||||
| 2025-08-14 | 13F | Capitolis Liquid Global Markets LLC | 670 500 | 50 891 | ||||||
| 2025-07-28 | 13F | Rosenberg Matthew Hamilton | 10 565 | −6,85 | 802 | −6,86 | ||||
| 2025-05-02 | 13F | Dakota Wealth Management | 0 | −100,00 | 0 | |||||
| 2025-07-15 | 13F | Avaii Wealth Management, Llc | 6 224 | 2,27 | 472 | 2,39 | ||||
| 2025-08-05 | 13F | Tsfg, Llc | 1 500 | 1,49 | 0 | |||||
| 2025-08-21 | 13F | Aveo Capital Partners, LLC | 0 | −100,00 | 0 | |||||
| 2025-08-11 | 13F | Capital Square, LLC | 14 036 | −2,32 | 1 044 | −4,31 | ||||
| 2025-08-14 | 13F | Peapack Gladstone Financial Corp | 0 | −100,00 | 0 | |||||
| 2025-08-14 | 13F | Mariner, LLC | 6 494 | −2,83 | 493 | −2,96 | ||||
| 2025-07-10 | 13F | Websterrogers Financial Advisors, Llc | 87 630 | 1,42 | 6 651 | 1,40 | ||||
| 2025-06-25 | NP | RLGAX - RiverFront Asset Allocation Growth & Income Investor Shares | 0 | −100,00 | 0 | −100,00 | ||||
| 2025-05-02 | 13F | First Command Advisory Services, Inc. | 0 | −100,00 | 0 | |||||
| 2025-08-29 | 13F | Centaurus Financial, Inc. | 1 450 | −5,91 | 0 | |||||
| 2025-04-28 | 13F | Principal Financial Group Inc | 0 | −100,00 | 0 | |||||
| 2025-08-14 | 13F | Optiver Holding B.V. | 118 | 9 | ||||||
| 2025-08-14 | 13F | Old Mission Capital Llc | 0 | −100,00 | 0 | |||||
| 2025-05-15 | 13F | Keebeck Wealth Management, LLC | 0 | −100,00 | 0 | |||||
| 2025-07-16 | 13F | Register Financial Advisors LLC | 152 | 12 | ||||||
| 2025-08-14 | 13F | Mml Investors Services, Llc | 387 173 | −5,58 | 29 | −6,45 | ||||
| 2025-07-15 | 13F | Td Private Client Wealth Llc | 1 042 | 79 | ||||||
| 2025-04-25 | NP | VTC - Vanguard Total Corporate Bond ETF ETF Shares | 5 066 991 | 9,39 | 391 729 | 7,06 | ||||
| 2025-08-20 | 13F/A | Coppell Advisory Solutions LLC | 6 423 | −3,01 | 483 | −2,82 | ||||
| 2025-07-21 | 13F | Crews Bank & Trust | 5 475 | −14,09 | 416 | −14,08 | ||||
| 2025-07-30 | 13F | Nottingham Advisors, Inc. | 18 582 | −73,82 | 1 410 | −73,83 | ||||
| 2025-07-23 | 13F | Prime Capital Investment Advisors, LLC | 10 467 | 6,61 | 794 | 6,58 | ||||
| 2025-07-17 | 13F | Raleigh Capital Management Inc. | 0 | −100,00 | 0 | |||||
| 2025-08-13 | 13F | 1832 Asset Management L.P. | 357 866 | 5,26 | 27 162 | 5,25 | ||||
| 2025-07-30 | 13F | White Lighthouse Investment Management Inc. | 78 502 | 0,01 | 5 958 | 0,00 | ||||
| 2025-05-15 | 13F | BlueCrest Capital Management Ltd | 0 | −100,00 | 0 | |||||
| 2025-08-28 | NP | BlackRock Funds V - BlackRock Strategic Income Opportunities Portfolio Investor A Shares | 570 850 | 0,00 | 43 328 | −0,01 | ||||
| 2025-05-27 | NP | TINIX - AXS Tactical Income Fund Class I Shares | 20 187 | 1 532 | ||||||
| 2025-07-18 | 13F | Institute for Wealth Management, LLC. | 3 672 | 0,03 | 279 | 0,00 | ||||
| 2025-08-14 | 13F | Bnp Paribas Arbitrage, Sa | 902 723 | −18,14 | 68 517 | −18,15 | ||||
| 2025-04-15 | 13F | Ibex Wealth Advisors | 0 | −100,00 | 0 | |||||
| 2025-08-19 | 13F | National Asset Management, Inc. | 0 | −100,00 | 0 | |||||
| 2025-04-15 | 13F | Focus Financial Network, Inc. | 0 | −100,00 | 0 | −100,00 | ||||
| 2025-08-14 | 13F | Meiji Yasuda Life Insurance Co | 2 833 000 | 0,00 | 215 025 | −0,01 | ||||
| 2025-07-10 | 13F | Exchange Traded Concepts, Llc | 212 142 | 16 102 | ||||||
| 2025-07-21 | 13F | Ameriflex Group, Inc. | 16 156 | −9,47 | 1 218 | −10,04 | ||||
| 2025-04-30 | 13F | AlphaStar Capital Management, LLC | 0 | −100,00 | 0 | |||||
| 2025-08-12 | 13F | CIBC Private Wealth Group, LLC | 959 | 0,95 | 73 | 5,88 | ||||
| 2025-05-29 | NP | Northern Lights Fund Trust - Sierra Tactical Risk Spectrum 30 Fund Instl Class | 67 600 | 5 132 | ||||||
| 2025-08-13 | 13F | Scotia Capital Inc. | 0 | −100,00 | 0 | |||||
| 2025-08-13 | 13F | EverSource Wealth Advisors, LLC | 1 046 | 0,00 | 79 | 0,00 | ||||
| 2025-07-17 | 13F | Janney Montgomery Scott LLC | 124 487 | 2,04 | 9 | 0,00 | ||||
| 2025-08-13 | 13F | Cresset Asset Management, LLC | 11 266 | −21,04 | 855 | −21,05 | ||||
| 2025-08-14 | 13F | Two Sigma Securities, Llc | 0 | −100,00 | 0 | |||||
| 2025-08-01 | 13F | First National Trust Co | 4 415 | −3,03 | 335 | −2,90 | ||||
| 2025-08-14 | 13F | Gallagher Fiduciary Advisors, LLC | 59 297 124 | 19 539,62 | 786 | −96,57 | ||||
| 2025-08-12 | 13F | XTX Topco Ltd | 8 187 | 99,34 | 621 | 99,68 | ||||
| 2025-08-11 | 13F | Beaumont Capital Management, LLC | 33 748 | 1,21 | 2 561 | 1,19 | ||||
| 2025-07-08 | 13F | Nbc Securities, Inc. | 5 390 | 27,45 | 0 | |||||
| 2025-08-06 | 13F | Legacy Investment Solutions, LLC | 23 | 0,00 | 2 | 0,00 | ||||
| 2025-07-15 | 13F | Farrell Financial LLC | 26 913 | 7,12 | 2 043 | 7,08 | ||||
| 2025-07-30 | 13F | Avidian Wealth Solutions, LLC | 6 821 | −3,43 | 518 | −3,54 | ||||
| 2025-08-12 | 13F | Allianz Investment Management U.S. LLC | 2 416 012 | 0,00 | 183 375 | 3,60 | ||||
| 2025-07-15 | 13F | Sightline Wealth Advisors, LLC | 43 352 | 0,91 | 3 290 | 0,89 | ||||
| 2025-08-12 | 13F | RiverFront Investment Group, LLC | 64 839 | −49,01 | 4 921 | −49,02 | ||||
| 2025-08-11 | 13F | Nomura Asset Management Co Ltd | 0 | −100,00 | 0 | |||||
| 2025-08-14 | 13F | Goldman Sachs Group Inc | 95 577 | −39,58 | 7 254 | −39,59 | ||||
| 2025-08-01 | 13F | Ashton Thomas Private Wealth, LLC | 5 111 | 388 | ||||||
| 2025-07-22 | 13F | Belpointe Asset Management LLC | 146 005 | 11 082 | ||||||
| 2025-08-08 | 13F | Globe Life Inc. | 474 500 | 0,00 | 36 015 | −0,01 | ||||
| 2025-08-13 | 13F | Custom Index Systems, Llc | 8 549 | 649 | ||||||
| 2025-07-31 | 13F | Nisa Investment Advisors, Llc | 183 600 | 2,53 | 13 935 | 2,52 | ||||
| 2025-07-16 | 13F | Beaumont Financial Advisors, LLC | 3 480 | −11,25 | 264 | −11,11 | ||||
| 2025-07-31 | 13F | Topsail Wealth Management, LLC | 23 786 | 1,46 | 1 805 | 1,46 | ||||
| 2025-07-31 | 13F | Glass Jacobson Investment Advisors llc | 0 | −100,00 | 0 | |||||
| 2025-08-14 | 13F/A | Barclays Plc | 109 647 | 996 690,91 | 8 | |||||
| 2025-07-15 | 13F | Sheets Smith Wealth Management | 8 297 | 7,82 | 630 | 7,71 | ||||
| 2025-08-12 | 13F | Sandhill Capital Partners LLC | 4 143 | 0,00 | 314 | 0,00 | ||||
| 2025-08-14 | 13F | Daiwa Securities Group Inc. | 15 900 | 0,00 | 1 | 0,00 | ||||
| 2025-07-29 | 13F | Stephens Inc /ar/ | 2 640 | 200 | ||||||
| 2025-08-13 | 13F | Cerity Partners LLC | 0 | −100,00 | 0 | |||||
| 2025-07-30 | 13F | Bogart Wealth, LLC | 89 | 0,00 | 7 | 0,00 | ||||
| 2025-08-05 | 13F | Gould Asset Management Llc /ca/ | 5 894 | −39,49 | 447 | −39,51 | ||||
| 2025-08-04 | 13F | IFG Advisory, LLC | 34 490 | −6,56 | 2 618 | −6,57 | ||||
| 2025-05-29 | NP | SSIZX - Sierra Tactical Core Income Fund Class A Shares | 1 156 700 | 421,74 | 87 805 | 387,59 | ||||
| 2025-07-23 | 13F | Elm3 Financial Group, LLC | 5 907 | −47,07 | 448 | −47,11 | ||||
| 2025-08-15 | 13F | CI Private Wealth, LLC | 25 272 | 80,54 | 1 918 | 80,60 | ||||
| 2025-08-12 | 13F | Northwestern Mutual Investment Management Company, Llc | 274 190 | 20 811 | ||||||
| 2025-08-07 | 13F | Guidance Capital, Inc | 45 637 | 12,51 | 3 455 | 15,79 | ||||
| 2025-08-13 | 13F | Northern Trust Corp | 0 | −100,00 | 0 | |||||
| 2025-08-11 | 13F | TAGStone Capital, Inc. | 0 | −100,00 | 0 | |||||
| 2025-04-21 | 13F | Hartford Financial Management Inc. | 0 | −100,00 | 0 | |||||
| 2025-08-11 | 13F | Anfield Capital Management, LLC | 397 | 185,61 | 30 | 200,00 | ||||
| 2025-05-30 | NP | TBFG - The Brinsmere Fund - Growth ETF | 0 | −100,00 | 0 | −100,00 | ||||
| 2025-05-01 | 13F | High Note Wealth, LLC | 0 | −100,00 | 0 | |||||
| 2025-08-04 | 13F | Econ Financial Services Corp | 71 983 | 0,90 | 5 464 | 0,89 | ||||
| 2025-08-08 | 13F | Creative Planning | 7 854 | 1,21 | 596 | 1,19 | ||||
| 2025-08-26 | 13F/A | Thrivent Financial For Lutherans | 9 872 | 1 | ||||||
| 2025-08-08 | 13F | Emerald Investment Partners, Llc | 26 487 | −2,45 | 2 010 | −2,47 | ||||
| 2025-08-15 | 13F | Semmax Financial Advisors Inc. | 191 | 14 | ||||||
| 2025-05-29 | NP | Northern Lights Fund Trust - Sierra Tactical Risk Spectrum 70 Fund Investor Class | 7 300 | 2,82 | 554 | −3,82 | ||||
| 2025-07-21 | 13F | Mirae Asset Global Investments Co., Ltd. | 324 336 | 18,73 | 24 617 | 38,46 | ||||
| 2025-08-14 | 13F | Jane Street Group, Llc | 250 852 | −72,37 | 19 040 | −72,38 | ||||
| 2025-08-12 | 13F | Employees' Retirement Fund of the City of Fort Worth | 416 500 | 0,00 | 31 617 | 0,00 | ||||
| 2025-08-07 | 13F | Sound View Wealth Advisors Group, LLC | 5 195 | 0,00 | 394 | 0,00 | ||||
| 2025-08-11 | 13F | Aptus Capital Advisors, LLC | 204 | 0,00 | 15 | 0,00 | ||||
| 2025-07-31 | 13F | Wright Fund Managment, LLC | 1 327 700 | 0,00 | 100 786 | 0,00 | ||||
| 2025-07-30 | 13F | Onyx Bridge Wealth Group LLC | 4 408 | −40,33 | 335 | −40,36 | ||||
| 2025-08-08 | 13F | Pinney & Scofield, Inc. | 607 | 1,51 | 46 | 2,22 | ||||
| 2025-08-12 | 13F | Coldstream Capital Management Inc | 0 | −100,00 | 0 | |||||
| 2025-08-11 | 13F | AXS Investments LLC | 0 | −100,00 | 0 | |||||
| 2025-08-12 | 13F | MAI Capital Management | 1 198 | −17,21 | 91 | −17,43 | ||||
| 2025-08-14 | 13F | Ameriprise Financial Inc | 732 016 | −13,13 | 55 497 | −13,09 | ||||
| 2025-04-29 | 13F | Penserra Capital Management LLC | 0 | −100,00 | 0 | |||||
| 2025-08-05 | 13F | Cassaday & Co Wealth Management LLC | 0 | −100,00 | 0 | |||||
| 2025-08-06 | 13F | AE Wealth Management LLC | 319 | 8,50 | 24 | 9,09 | ||||
| 2025-08-13 | 13F | Dow Chemical Co /de/ | 264 221 | 0,00 | 20 054 | −0,01 | ||||
| 2025-08-08 | 13F | Avantax Advisory Services, Inc. | 17 958 | 2,62 | 1 363 | 2,64 | ||||
| 2025-08-13 | 13F | Invesco Ltd. | 64 985 | 0,24 | 4 932 | 0,22 | ||||
| 2025-07-29 | 13F | Private Trust Co Na | 5 869 | 0,00 | 445 | 0,00 | ||||
| 2025-08-14 | 13F | Toroso Investments, LLC | 7 950 | 601 | ||||||
| 2025-08-15 | 13F | First Heartland Consultants, Inc. | 5 053 | 4,53 | 839 | 128,96 | ||||
| 2025-08-01 | 13F | Boyd Watterson Asset Management Llc/oh | 3 235 | −94,68 | 246 | −94,70 | ||||
| 2025-08-11 | 13F | Principal Securities, Inc. | 2 425 | 26,76 | 184 | 28,67 | ||||
| 2025-08-11 | 13F | NewEdge Wealth, LLC | 187 172 | −40,62 | 14 214 | −40,60 | ||||
| 2025-08-04 | 13F | AMG National Trust Bank | 180 805 | −7,29 | 13 723 | −7,30 | ||||
| 2025-04-23 | 13F | Golden State Wealth Management, LLC | 311 | 1 627,78 | 24 | 2 200,00 | ||||
| 2025-08-13 | 13F | Capital Group Private Client Services, Inc. | 0 | −100,00 | 0 | |||||
| 2025-08-14 | 13F | MidWestOne Financial Group, Inc. | 219 590 | −26,27 | 16 667 | −26,29 | ||||
| 2025-07-22 | 13F | Visionary Horizons, LLC | 5 806 | −74,51 | 441 | −74,55 | ||||
| 2025-08-12 | 13F | DiMeo Schneider & Associates, L.L.C. | 468 948 | 4,20 | 35 593 | 4,19 | ||||
| 2025-07-30 | 13F | Denali Advisors Llc | 18 665 | −4,04 | 1 417 | −4,07 | ||||
| 2025-08-12 | 13F | Horizon Financial Services, Llc | 50 793 | −0,29 | 3 855 | −0,28 | ||||
| 2025-05-13 | 13F | Quadrature Capital Ltd | 0 | −100,00 | 0 | −100,00 | ||||
| 2025-05-15 | 13F/A | Orion Portfolio Solutions, LLC | 6 369 | 1,40 | 483 | 2,99 | ||||
| 2025-08-05 | 13F | Marion Wealth Management | 75 286 | 1,08 | 5 714 | 1,06 | ||||
| 2025-08-12 | 13F | SRS Capital Advisors, Inc. | 27 075 | −1,70 | 2 055 | −1,72 | ||||
| 2025-08-14 | 13F | Fmr Llc | 341 | −88,82 | 26 | −89,18 | ||||
| 2025-07-07 | 13F | Insight Wealth Strategies, LLC | 380 395 | 0,86 | 28 845 | 0,76 | ||||
| 2025-08-04 | 13F | Creative Financial Designs Inc /adv | 1 900 | 5,56 | 144 | 5,88 | ||||
| 2025-08-04 | 13F | Atria Investments Llc | 37 805 | 11,26 | 2 869 | 11,24 | ||||
| 2025-07-16 | 13F | Signaturefd, Llc | 148 | −27,80 | 11 | −26,67 | ||||
| 2025-07-25 | 13F | Transcendent Capital Group LLC | 33 521 | 0,16 | 2 544 | 0,16 | ||||
| 2025-07-24 | 13F | Us Bancorp \de\ | 47 | −84,64 | 4 | −86,96 | ||||
| 2025-08-12 | 13F | BlackRock, Inc. | 622 629 | 0,07 | 47 258 | 0,06 | ||||
| 2025-04-28 | 13F | Mainstream Capital Management LLC | 0 | −100,00 | 0 | |||||
| 2025-08-15 | 13F | Orcam Financial Group | 2 678 | 0,60 | 203 | 0,50 | ||||
| 2025-08-13 | 13F | Guggenheim Capital Llc | 121 048 | 37,91 | 9 188 | 37,90 | ||||
| 2025-08-13 | 13F | Everstar Asset Management, LLC | 3 790 | 0,00 | 288 | 0,00 | ||||
| 2025-08-12 | 13F | LPL Financial LLC | 649 206 | −18,07 | 49 275 | −18,08 | ||||
| 2025-07-22 | 13F | 4Thought Financial Group Inc. | 52 712 | 6,31 | 4 001 | 6,30 | ||||
| 2025-08-05 | 13F | Sigma Planning Corp | 5 482 | −77,66 | 416 | −77,66 | ||||
| 2025-07-14 | 13F | Abacus Wealth Partners, LLC | 6 529 | 496 | ||||||
| 2025-08-07 | 13F | Palouse Capital Management, Inc. | 49 803 | 0,34 | 3 780 | 0,35 | ||||
| 2025-08-14 | 13F | Hrt Financial Lp | 12 829 | 1 | ||||||
| 2025-07-14 | 13F | Argentarii, LLC | 2 696 | 205 | ||||||
| 2025-05-14 | 13F | Estate Counselors, LLC | 0 | −100,00 | 0 | |||||
| 2025-08-14 | 13F | Stifel Financial Corp | 35 398 | 8,41 | 2 687 | 8,39 | ||||
| 2025-08-14 | 13F/A | Skopos Labs, Inc. | 454 | 15 033,33 | 34 | |||||
| 2025-08-11 | 13F | Private Advisor Group, LLC | 7 742 | −7,50 | 588 | −7,56 | ||||
| 2025-07-24 | 13F | Robertson Stephens Wealth Management, LLC | 28 329 | 35,81 | 2 150 | 35,82 | ||||
| 2025-08-14 | 13F | Janus Henderson Group Plc | 3 415 | −92,12 | 259 | −92,09 | ||||
| 2025-07-08 | 13F | GK Wealth Management LLC | 9 456 | 68,23 | 718 | 68,31 | ||||
| 2025-08-14 | 13F | State Street Corp | 1 121 846 | 20,57 | 85 148 | 20,55 | ||||
| 2025-08-12 | 13F | Eisler Capital Management Ltd. | 0 | −100,00 | 0 | |||||
| 2025-08-11 | 13F | Regal Investment Advisors LLC | 72 982 | 0,50 | 5 539 | 0,49 | ||||
| 2025-08-14 | 13F | Harmony Asset Management Llc | 8 824 | 36,30 | 670 | 36,25 | ||||
| 2025-08-13 | 13F | Sumitomo Mitsui Financial Group, Inc. | 81 693 | −10,96 | 6 200 | −10,97 | ||||
| 2025-08-14 | 13F | Colony Group, LLC | 50 273 | −4,90 | 3 816 | −4,91 | ||||
| 2025-07-11 | 13F/A | Umb Bank N A/mo | 3 068 | 0,00 | 233 | 0,00 | ||||
| 2025-05-08 | 13F | BRYN MAWR TRUST Co | 0 | −100,00 | 0 | |||||
| 2025-08-14 | 13F | Mercer Global Advisors Inc /adv | 0 | −100,00 | 0 | |||||
| 2025-09-11 | 13F | Silicon Valley Capital Partners | 23 | 2 | ||||||
| 2025-08-06 | 13F | Aspect Partners, LLC | 254 | 19 | ||||||
| 2025-08-12 | 13F | Mufg Securities Americas Inc. | 0 | −100,00 | 0 | |||||
| 2025-08-12 | 13F | Absolute Capital Management, LLC | 24 218 | −2,99 | 1 838 | −3,01 | ||||
| 2025-07-28 | 13F | Moran Wealth Management, LLC | 38 863 | 8,37 | 2 950 | 8,34 | ||||
| 2025-05-09 | 13F | Vanguard Group Inc | 0 | −100,00 | 0 | |||||
| 2025-08-05 | 13F | Huntington National Bank | 5 | |||||||
| 2025-08-13 | 13F | Wealthedge Investment Advisors, Llc | 0 | −100,00 | 0 | |||||
| 2025-08-05 | 13F | Transatlantique Private Wealth Llc | 8 300 | 2,77 | 630 | 2,61 | ||||
| 2025-08-07 | 13F | King Luther Capital Management Corp | 3 587 | −3,03 | ||||||
| 2025-05-08 | 13F | Plante Moran Financial Advisors, LLC | 0 | −100,00 | 0 | |||||
| 2025-08-14 | 13F | Bramshill Investments, LLC | 314 098 | 5,48 | 23 840 | 5,47 | ||||
| 2025-08-15 | 13F | Kestra Advisory Services, LLC | 7 147 | 165,19 | 542 | 165,69 | ||||
| 2025-05-12 | 13F | SOUTH STATE Corp | 0 | −100,00 | 0 | |||||
| 2025-08-14 | 13F | Alliancebernstein L.p. | 542 428 | 0,28 | 41 170 | 0,27 | ||||
| 2025-07-23 | 13F | Eagle Strategies LLC | 4 974 | 7,85 | 378 | 7,71 | ||||
| 2025-04-22 | 13F | Echo Wealth Management, LLC | 0 | −100,00 | 0 | |||||
| 2025-04-21 | 13F | Ronald Blue Trust, Inc. | 0 | −100,00 | 0 | |||||
| 2025-07-17 | 13F | Independence Bank of Kentucky | 2 742 | −7,80 | 208 | −7,56 | ||||
| 2025-08-13 | 13F | Nyl Investors Llc | 625 629 | 1,05 | 47 485 | 1,04 | ||||
| 2025-08-13 | 13F | Beacon Pointe Advisors, LLC | 4 317 | 4,25 | 328 | 4,14 | ||||
| 2025-08-13 | 13F | Fortress Financial Solutions, LLC | 16 546 | 3,24 | 1 256 | 3,21 | ||||
| 2025-08-08 | 13F | Fortis Group Advisors, LLC | 266 | 0,00 | 20 | 0,00 | ||||
| 2025-07-29 | 13F | Signature Estate & Investment Advisors Llc | 9 262 | 17,30 | 703 | 17,36 | ||||
| 2025-08-12 | 13F | Howe & Rusling Inc | 369 | 292,55 | 28 | 300,00 | ||||
| 2025-08-14 | 13F/A | Rockefeller Capital Management L.P. | 12 224 | 0,16 | 928 | 0,11 | ||||
| 2025-08-14 | 13F | GWM Advisors LLC | 186 473 | 54,11 | 14 153 | 54,09 | ||||
| 2025-07-30 | 13F | Phillips Financial Management, Llc | 86 | 7 | ||||||
| 2025-04-23 | 13F | Aspetuck Financial Management LLC | 0 | −100,00 | 0 | −100,00 | ||||
| 2025-05-05 | 13F | Transce3nd, LLC | 0 | −100,00 | 0 | |||||
| 2025-04-15 | 13F | Integrated Advisors Network LLC | 0 | −100,00 | 0 | |||||
| 2025-08-11 | 13F | Lighthouse Financial LLC | 130 698 | −0,42 | 9 920 | −0,44 | ||||
| 2025-08-14 | 13F | Wells Fargo & Company/mn | 1 591 904 | −4,67 | 120 826 | −4,68 | ||||
| 2025-08-07 | 13F | PFG Advisors | 8 242 | −9,02 | 626 | −9,02 | ||||
| 2025-08-11 | 13F | Heritage Wealth Advisors | 0 | −100,00 | 0 | |||||
| 2025-08-12 | 13F | Insigneo Advisory Services, Llc | 9 649 | 0,00 | 732 | 0,00 | ||||
| 2025-04-22 | 13F | Buck Wealth Strategies, LLC | 0 | −100,00 | 0 | |||||
| 2025-08-14 | 13F | TT Capital Management LLC | 54 100 | 4 001 | ||||||
| 2025-08-12 | 13F | Founders Financial Alliance, LLC | 0 | −100,00 | 0 | |||||
| 2025-07-30 | 13F | D.a. Davidson & Co. | 5 493 | 0,16 | 417 | 0,00 | ||||
| 2025-05-16 | 13F | CTC Alternative Strategies, Ltd. | 0 | −100,00 | 0 | |||||
| 2025-08-19 | 13F | Newbridge Financial Services Group, Inc. | 981 | 5,83 | 74 | 5,71 | ||||
| 2025-08-27 | NP | Brighthouse Funds Trust I - SSGA Growth and Income ETF Portfolio Class A | 779 375 | 20,55 | 59 155 | 20,53 | ||||
| 2025-07-31 | 13F | Pacitti Group Inc. | 23 844 | 8,98 | 1 810 | 8,98 | ||||
| 2025-07-31 | 13F | Ssa Swiss Advisors Ag | 0 | −100,00 | 0 | |||||
| 2025-07-17 | 13F | Catalytic Wealth RIA, LLC | 5 029 | 12,53 | 382 | 12,39 | ||||
| 2025-08-13 | 13F | Dai-Ichi Life Insurance Company, Ltd | 11 859 | −80,86 | 900 | −80,86 | ||||
| 2025-08-14 | 13F | Boston Private Wealth Llc | 0 | −100,00 | 0 | |||||
| 2025-08-14 | 13F | Wiley Bros.-aintree Capital, Llc | 55 046 | −13,15 | 4 178 | −12,81 | ||||
| 2025-07-18 | 13F | Consolidated Portfolio Review Corp | 10 681 | 1,24 | 811 | 1,25 | ||||
| 2025-08-12 | 13F | Charles Schwab Investment Management Inc | 2 274 819 | 2,62 | 172 659 | 2,61 | ||||
| 2025-08-12 | 13F | Change Path, LLC | 4 701 | −91,66 | 357 | −91,68 | ||||
| 2025-08-28 | NP | GPARX - GuidePath(R) Absolute Return Allocation Fund Service Shares | 59 081 | −60,09 | 4 484 | −60,10 | ||||
| 2025-07-30 | 13F | Berkeley Capital Partners, LLC | 202 842 | 3,58 | 15 396 | 3,57 | ||||
| 2025-04-17 | 13F | Vicus Capital | 0 | −100,00 | 0 | |||||
| 2025-08-07 | 13F | Resources Investment Advisors, LLC. | 4 077 | 28,98 | 309 | 29,29 | ||||
| 2025-07-31 | 13F | Wealthfront Advisers Llc | 17 876 | −13,73 | 1 357 | −13,74 | ||||
| 2025-08-12 | 13F | Tradition Wealth Management, LLC | 9 760 | −31,30 | 741 | −31,35 | ||||
| 2025-07-31 | 13F | United Community Bank | 117 | −81,63 | 9 | −83,33 | ||||
| 2025-08-18 | 13F | Geneos Wealth Management Inc. | 10 604 | 101,83 | 805 | 102,01 | ||||
| 2025-05-12 | 13F | Cahill Wealth Management, LLC | 3 200 | 0,00 | 243 | 1,26 | ||||
| 2025-07-16 | 13F | Marmo Financial Group, LLC | 127 911 | −0,22 | 9 708 | −0,24 | ||||
| 2025-07-17 | 13F | San Luis Wealth Advisors LLC | 169 348 | 13 | ||||||
| 2025-07-25 | 13F | Allspring Global Investments Holdings, LLC | 633 641 | 28,57 | 48 093 | 28,55 | ||||
| 2025-08-05 | 13F | GPS Wealth Strategies Group, LLC | 142 | 0,00 | 11 | 0,00 | ||||
| 2025-08-08 | 13F/A | Prospect Financial Services LLC | 119 970 | −34,64 | 9 106 | −34,65 | ||||
| 2025-08-08 | 13F | Foundations Investment Advisors, LLC | 2 846 | −21,12 | 216 | −20,88 | ||||
| 2025-08-14 | 13F | Royal Bank Of Canada | 595 360 | −20,36 | 45 187 | −20,38 | ||||
| 2025-07-11 | 13F | Compass Ion Advisors, LLC | 8 812 | 0,00 | 669 | 0,00 | ||||
| 2025-08-18 | 13F | Wolverine Trading, Llc | Put | 0 | −100,00 | 0 | ||||
| 2025-07-11 | 13F | Farther Finance Advisors, LLC | 1 070 | 618,12 | 81 | 636,36 | ||||
| 2025-08-27 | 13F/A | Brinker Capital Investments, LLC | 7 704 | 20,96 | 585 | 20,91 | ||||
| 2025-08-07 | 13F | Hennion & Walsh Asset Management, Inc. | 5 542 | 4,33 | 421 | 4,22 | ||||
| 2025-07-10 | 13F | Security National Bank | 150 | 0,00 | 11 | 0,00 | ||||
| 2025-07-15 | 13F | Revisor Wealth Management LLC | 119 517 | 21,58 | 8 981 | 20,34 | ||||
| 2025-08-04 | 13F | Wealth Management Associates, Inc. | 3 650 | −21,51 | 277 | −21,31 | ||||
| 2025-08-14 | 13F | Bank Of Hawaii | 84 162 | 4,91 | 6 388 | 4,89 | ||||
| 2025-07-25 | 13F | Prostatis Group LLC | 3 882 | −73,21 | 295 | −73,25 | ||||
| 2025-08-13 | 13F | Northwestern Mutual Wealth Management Co | 23 951 | −70,27 | 1 818 | −70,29 | ||||
| 2025-08-12 | 13F | O'shaughnessy Asset Management, Llc | 1 313 | 23,63 | 100 | 23,75 | ||||
| 2025-08-11 | 13F | Citigroup Inc | 1 356 114 | 4 898,02 | 102 929 | 4 898,98 | ||||
| 2025-07-10 | 13F | Rockland Trust Co | 9 903 | 0,45 | 752 | 0,40 | ||||
| 2025-08-11 | 13F | Angeles Investment Advisors, LLC | 1 606 000 | 0,00 | 121 895 | −0,01 | ||||
| 2025-08-13 | 13F | Farnam Financial LLC | 3 856 | 2,39 | 293 | 2,46 | ||||
| 2025-07-22 | 13F | Simplicity Wealth,LLC | 33 720 | 2 559 | ||||||
| 2025-04-25 | 13F | Tradewinds Capital Management, LLC | 0 | −100,00 | 0 | −100,00 | ||||
| 2025-05-08 | 13F | Harbour Investments, Inc. | 0 | −100,00 | 0 | |||||
| 2025-08-13 | 13F | Manning & Napier Advisors Llc | 15 853 | 48,62 | 1 203 | 48,70 | ||||
| 2025-08-11 | 13F | Banque Cantonale Vaudoise | 1 568 | 0,00 | 0 | |||||
| 2025-08-12 | 13F | Steward Partners Investment Advisory, Llc | 4 608 | −13,29 | 350 | −13,40 | ||||
| 2025-08-13 | 13F | Alerus Financial Na | 409 515 | 0,96 | 31 082 | 0,95 | ||||
| 2025-08-01 | 13F | James Investment Research Inc | 20 652 | −2,42 | 1 567 | −2,43 | ||||
| 2025-08-14 | 13F | Headlands Technologies LLC | 2 866 | 218 | ||||||
| 2025-08-14 | 13F | Heritage Wealth Management, Inc. | 4 845 | −23,84 | 368 | −23,86 | ||||
| 2025-08-11 | 13F | HighTower Advisors, LLC | 37 506 | 8,07 | 2 847 | 8,05 | ||||
| 2025-07-30 | 13F | Caliber Wealth Management, LLC / KS | 5 281 | 0,94 | 401 | 0,76 | ||||
| 2025-08-15 | 13F/A | Rakuten Securities, Inc. | 295 | 150,00 | 22 | 175,00 | ||||
| 2025-07-29 | 13F | Woodard & Co Asset Management Group Inc /adv | 86 | 0,00 | 7 | 0,00 | ||||
| 2025-08-12 | 13F | Bokf, Na | 0 | −100,00 | 0 | |||||
| 2025-08-14 | 13F | McIlrath & Eck, LLC | 51 | 0,00 | 4 | 0,00 | ||||
| 2025-08-12 | 13F | GDS Wealth Management | 567 222 | −8,01 | 43 052 | −8,02 | ||||
| 2025-08-14 | 13F | Financial Engines Advisors L.L.C. | 3 212 | 244 | ||||||
| 2025-07-24 | 13F | Galvin, Gaustad & Stein, LLC | 10 041 | −9,82 | 762 | −9,82 | ||||
| 2025-08-11 | 13F | Y.D. More Investments Ltd | 150 | 0,00 | 11 | 0,00 | ||||
| 2025-08-01 | 13F | Providence First Trust Co | 146 640 | −0,24 | 11 130 | −0,26 | ||||
| 2025-07-07 | 13F | Wesbanco Bank Inc | 40 017 | 4,11 | 3 037 | 4,11 | ||||
| 2025-07-10 | 13F | Wealth Enhancement Advisory Services, Llc | 10 455 | −31,20 | 788 | −31,66 | ||||
| 2025-07-02 | 13F | S. R. Schill & Associates | 17 387 | 1 320 | ||||||
| 2025-08-14 | 13F | Tudor Investment Corp Et Al | 0 | −100,00 | 0 | |||||
| 2025-07-14 | 13F | GAMMA Investing LLC | 0 | −100,00 | 0 | |||||
| 2025-07-17 | 13F | LifeGoal Wealth Advisors | 19 078 | 19,30 | 1 448 | 19,37 | ||||
| 2025-08-12 | 13F | Barings Llc | 35 856 | 0,00 | 2 721 | 0,00 | ||||
| 2025-08-27 | NP | FFSAX - Touchstone Flexible Income Fund Class A | 46 791 | 2,68 | 3 551 | 2,66 | ||||
| 2025-07-25 | 13F | Cwm, Llc | 960 | 1 115,19 | 0 | |||||
| 2025-08-01 | 13F | Envestnet Asset Management Inc | 336 965 | −13,15 | 25 570 | −13,19 | ||||
| 2025-08-13 | 13F | Johnson Financial Group, Inc. | 0 | −100,00 | 0 | |||||
| 2025-08-18 | 13F | Wolverine Trading, Llc | Call | 0 | −100,00 | 0 | ||||
| 2025-08-15 | 13F | Tower Research Capital LLC (TRC) | 20 | −57,45 | 2 | −66,67 | ||||
| 2025-08-08 | 13F | Francis Financial, Inc. | 0 | −100,00 | 0 | |||||
| 2025-08-04 | 13F | Assetmark, Inc | 59 120 | −60,22 | 4 487 | −60,23 | ||||
| 2025-08-15 | 13F | Captrust Financial Advisors | 14 474 | 218,67 | 1 099 | 219,19 | ||||
| 2025-07-18 | 13F | Union Bancaire Privee, UBP SA | 0 | −100,00 | 0 | |||||
| 2025-08-08 | 13F | SBI Securities Co., Ltd. | 35 005 | 6,19 | 2 657 | 6,16 | ||||
| 2025-08-06 | 13F | Commonwealth Equity Services, Llc | 77 217 | −3,06 | 6 | −16,67 | ||||
| 2025-07-07 | 13F | Thurston, Springer, Miller, Herd & Titak, Inc. | 103 | 0,00 | 8 | 0,00 | ||||
| 2025-08-06 | 13F | Prospera Financial Services Inc | 37 662 | −50,15 | 2 859 | −50,15 | ||||
| 2025-08-27 | NP | Brighthouse Funds Trust I - SSGA Growth ETF Portfolio Class A | 342 471 | 20,62 | 25 994 | 20,61 | ||||
| 2025-07-14 | 13F | Mechanics Bank Trust Department | 25 660 | 51,79 | 1 948 | 51,75 | ||||
| 2025-07-23 | 13F | Sax Wealth Advisors, Llc | 9 531 | 129,66 | 723 | 129,52 | ||||
| 2025-08-05 | 13F | Scarborough Advisors, LLC | 1 593 | 121 | ||||||
| 2025-04-25 | 13F | New Perspectives, Inc | 0 | −100,00 | 0 | |||||
| 2025-08-14 | 13F | Benjamin Edwards Inc | 436 328 | 35,30 | 33 117 | 35,28 | ||||
| 2025-07-10 | 13F | Redhawk Wealth Advisors, Inc. | 18 520 | 1 406 | ||||||
| 2025-07-10 | 13F | High Net Worth Advisory Group LLC | 11 414 | −16,61 | 866 | −16,65 | ||||
| 2025-08-13 | 13F | Cary Street Partner Investment Advisory Llc | 0 | −100,00 | 0 | |||||
| 2025-05-15 | 13F | Gwn Securities Inc. | 0 | −100,00 | 0 | |||||
| 2025-08-07 | 13F | Varma Mutual Pension Insurance Co | 1 600 000 | 0,00 | 121 440 | −0,01 | ||||
| 2025-06-27 | NP | Calamos ETF Trust - Calamos Alternative Nasdaq & Bond ETF | 1 204 | 75,00 | 90 | 74,51 | ||||
| 2025-08-07 | 13F | Davidson Capital Management Inc. | 292 881 | 22,06 | 22 230 | 22,04 | ||||
| 2025-08-07 | 13F | CENTRAL TRUST Co | 112 | 86,67 | 9 | 100,00 | ||||
| 2025-07-17 | 13F | Refined Wealth Management | 65 669 | 0,04 | 4 984 | 0,02 | ||||
| 2025-05-15 | 13F | Rakuten Investment Management, Inc. | 86 525 | 25,70 | 6 542 | 16,65 | ||||
| 2025-08-14 | 13F | Snowden Capital Advisors LLC | 31 674 | −1,14 | 2 404 | −1,15 | ||||
| 2025-08-12 | 13F | Proequities, Inc. | 0 | 0 | ||||||
| 2025-08-14 | 13F | Great Valley Advisor Group, Inc. | 5 806 | −73,46 | 440 | −73,49 | ||||
| 2025-05-13 | 13F | Resona Asset Management Co.,Ltd. | 0 | −100,00 | 0 | |||||
| 2025-08-18 | 13F | Castleark Management Llc | 236 450 | 17 947 | ||||||
| 2025-07-25 | 13F | Atria Wealth Solutions, Inc. | 11 817 | −32,79 | 895 | −32,98 | ||||
| 2025-08-13 | 13F | Cary Street Partners Financial Llc | 3 643 | −15,73 | 277 | −15,85 | ||||
| 2025-07-18 | 13F | Northeast Financial Group, Inc. | 139 065 | 11,01 | 10 555 | 11,00 | ||||
| 2025-07-24 | 13F | Conning Inc. | 11 380 | 0,00 | 864 | 0,00 | ||||
| 2025-08-11 | 13F | WPG Advisers, LLC | 206 | 121,51 | 16 | 114,29 | ||||
| 2025-08-14 | 13F | Dearborn Partners Llc | 23 968 | 77,70 | 1 819 | 77,81 | ||||
| 2025-07-29 | 13F | Quotient Wealth Partners, LLC | 0 | −100,00 | 0 | |||||
| 2025-08-12 | 13F | Global Retirement Partners, LLC | 16 817 | 107,18 | 1 276 | 110,56 | ||||
| 2025-08-12 | 13F | Running Point Capital Advisors, LLC | 736 | 0,00 | 56 | 0,00 | ||||
| 2025-08-14 | 13F | Bank Of America Corp /de/ | 2 389 158 | 0,46 | 181 337 | 0,45 | ||||
| 2025-08-05 | 13F | Bank of New York Mellon Corp | 49 808 | 155,15 | 3 780 | 155,23 | ||||
| 2025-07-24 | 13F | Stonebridge Financial Group, LLC | 8 557 | 17,06 | 649 | 17,15 | ||||
| 2025-07-24 | 13F | Aurora Private Wealth, Inc. | 2 798 | 1,45 | 0 | |||||
| 2025-07-28 | 13F | Courier Capital Llc | 32 148 | 5,96 | 2 440 | 5,95 | ||||
| 2025-09-04 | 13F/A | Advisor Group Holdings, Inc. | 268 855 | 20,56 | 20 418 | 20,59 | ||||
| 2025-04-25 | 13F | Wall Street Financial Group, Inc. | 17 123 | −10,52 | 1 300 | −9,16 | ||||
| 2025-08-13 | 13F | Victory Financial Group, Llc | 57 998 | −4,79 | 4 402 | −4,05 | ||||
| 2025-07-30 | 13F | Brookstone Capital Management | 3 708 | 7,42 | 281 | 7,25 | ||||
| 2025-08-06 | 13F | First Horizon Advisors, Inc. | 2 838 | 0,00 | 215 | 0,00 | ||||
| 2025-08-13 | 13F | Flow Traders U.s. Llc | 0 | −100,00 | 0 | |||||
| 2025-05-12 | 13F | Richard W. Paul & Associates, LLC | 0 | −100,00 | 0 | |||||
| 2025-08-01 | 13F | Advisory Alpha, LLC | 503 551 | −1,39 | 38 220 | −1,25 | ||||
| 2025-08-14 | 13F | Susquehanna International Group, Llp | Call | 115 800 | 14,31 | 8 789 | 14,31 | |||
| 2025-08-14 | 13F | Susquehanna International Group, Llp | Put | 82 200 | 108,10 | 6 239 | 108,07 | |||
| 2025-04-10 | 13F | Smith Anglin Financial, LLC | 0 | −100,00 | 0 | |||||
| 2025-08-29 | 13F | Evolution Wealth Management Inc. | 99 | 8 | ||||||
| 2025-08-12 | 13F | Ameritas Investment Partners, Inc. | 780 | 1,17 | 59 | 1,72 | ||||
| 2025-08-28 | NP | Northern Lights Fund Trust - Sierra Tactical Risk Spectrum 50 Fund Investor Class | 0 | −100,00 | 0 | −100,00 | ||||
| 2025-08-28 | NP | SIRAX - Sierra Tactical All Asset Fund Class A | 0 | −100,00 | 0 | −100,00 | ||||
| 2025-08-14 | 13F | Susquehanna International Group, Llp | 131 038 | −37,64 | 9 946 | −37,65 | ||||
| 2025-08-13 | 13F | Safe Harbor Fiduciary, LLC | 0 | −100,00 | 0 | |||||
| 2025-08-05 | 13F | Mma Asset Management Llc | 28 615 | −55,89 | 2 172 | −55,91 | ||||
| 2025-04-30 | 13F | POM Investment Strategies, LLC | 0 | −100,00 | 0 | |||||
| 2025-08-12 | 13F | Prudential Financial Inc | 10 865 | 832 | ||||||
| 2025-07-14 | 13F | Signature Securities Group Corporation | 0 | −100,00 | 0 | |||||
| 2025-08-08 | 13F | Cetera Investment Advisers | 154 519 | −41,45 | 11 728 | −41,46 | ||||
| 2025-08-08 | 13F | Capital Investment Advisory Services, LLC | 800 | 0,00 | 61 | 0,00 | ||||
| 2025-07-29 | 13F | Elevation Capital Advisory, LLC | 0 | −100,00 | 0 | −100,00 | ||||
| 2025-08-15 | 13F | State of Tennessee, Treasury Department | 2 827 927 | 3,94 | 214 640 | 3,93 | ||||
| 2025-08-15 | 13F | Provenance Wealth Advisors, LLC | 0 | −100,00 | 0 | |||||
| 2025-07-25 | 13F | Community Bank, N.A. | 0 | −100,00 | 0 | |||||
| 2025-04-14 | 13F | RWM Asset Management, LLC | 0 | −100,00 | 0 | |||||
| 2025-07-15 | 13F | LeConte Wealth Management, LLC | 75 996 | −9,14 | 5 768 | −9,15 | ||||
| 2025-07-28 | 13F | Mutual Advisors, LLC | 7 384 | 125,74 | 555 | 127,46 | ||||
| 2025-08-11 | 13F | Nations Financial Group Inc, /ia/ /adv | 41 751 | 8,57 | 3 169 | 8,53 | ||||
| 2025-08-08 | 13F | Gts Securities Llc | 0 | −100,00 | 0 | |||||
| 2025-07-14 | 13F | Painted Porch Advisors LLC | 0 | −100,00 | 0 | |||||
| 2025-07-17 | 13F | Beacon Capital Management, LLC | 847 | 1,56 | 64 | 1,59 | ||||
| 2025-08-26 | NP | TFPN - Blueprint Chesapeake Multi-Asset Trend ETF | 1 565 | 0,00 | 119 | 0,00 | ||||
| 2025-07-14 | 13F | Golden State Equity Partners | 10 103 | −5,45 | 767 | −5,55 | ||||
| 2025-08-14 | 13F | Comerica Bank | 50 096 | −8,63 | 3 802 | −8,63 | ||||
| 2025-07-21 | 13F | Ameritas Advisory Services, LLC | 2 798 | 2,23 | 212 | 3,92 | ||||
| 2025-08-14 | 13F | Toronto Dominion Bank | 200 000 | 15 180 | ||||||
| 2025-08-14 | 13F | Navigoe, LLC | 17 | 0 | ||||||
| 2025-07-01 | 13F | GP Brinson Investments LLC | 13 210 | 0,00 | 1 003 | 0,00 | ||||
| 2025-07-07 | 13F | Investors Research Corp | 843 | 0,00 | 64 | 0,00 | ||||
| 2025-07-31 | 13F | Hobart Private Capital, LLC | 5 695 | −79,30 | 432 | −79,31 | ||||
| 2025-04-28 | 13F | Financial Advocates Investment Management | 0 | −100,00 | 0 | |||||
| 2025-04-30 | 13F | Stratos Wealth Advisors, LLC | 0 | −100,00 | 0 | −100,00 | ||||
| 2025-08-08 | 13F | Diana Davis Spencer Foundation | 461 000 | 0,00 | 34 990 | −0,01 | ||||
| 2025-04-08 | 13F | Rooted Wealth Advisors, Inc. | 0 | −100,00 | 0 | |||||
| 2025-08-11 | 13F | TD Waterhouse Canada Inc. | 9 794 | −30,49 | 741 | −30,49 | ||||
| 2025-08-12 | 13F | PSI Advisors, LLC | 0 | −100,00 | 0 | |||||
| 2025-08-14 | 13F | Qube Research & Technologies Ltd | 0 | −100,00 | 0 | |||||
| 2025-07-24 | 13F | Antonelli Financial Advisors, LLC | 72 943 | 15,01 | 5 536 | 15,00 | ||||
| 2025-08-14 | 13F | Sei Investments Co | 146 574 | 664,60 | 11 125 | 664,60 | ||||
| 2025-07-14 | 13F | Financial Advisory Partners, Llc | 84 605 | 7,80 | 6 422 | 7,79 | ||||
| 2025-07-23 | 13F | Narwhal Capital Management | 0 | −100,00 | 0 | |||||
| 2025-08-12 | 13F | Jpmorgan Chase & Co | 219 122 | −37,34 | 16 631 | −37,35 | ||||
| 2025-08-13 | 13F/A | StoneX Group Inc. | 2 965 | 217 | ||||||
| 2025-05-13 | 13F | Brooklyn FI, LLC | 0 | −100,00 | 0 | −100,00 | ||||
| 2025-08-13 | 13F | GeoWealth Management, LLC | 5 036 | 12,51 | 382 | 12,68 | ||||
| 2025-08-04 | 13F | Lockheed Martin Investment Management Co | 0 | −100,00 | 0 | |||||
| 2025-07-24 | 13F | IFP Advisors, Inc | 0 | −100,00 | 0 | |||||
| 2025-08-07 | 13F | LFA - Lugano Financial Advisors SA | 7 266 | −4,07 | 546 | −5,05 | ||||
| 2025-07-17 | 13F | Fifth Third Securities, Inc. | 2 734 | 208 | ||||||
| 2025-05-15 | 13F | DSC Meridian Capital LP | 0 | −100,00 | 0 | |||||
| 2025-07-30 | NP | WTBN - WisdomTree Bianco Total Return Fund | 8 502 | −84,23 | 630 | −84,91 | ||||
| 2025-07-18 | 13F | Truist Financial Corp | 186 379 | −37,45 | 14 146 | −37,46 | ||||
| 2025-08-06 | 13F | Legacy Wealth Managment, LLC/ID | 23 | 0,00 | 2 | 0,00 | ||||
| 2025-08-12 | 13F | Franklin Resources Inc | 3 101 | 0,00 | 235 | 0,00 | ||||
| 2025-07-23 | 13F | Friedenthal Financial | 304 | 0,00 | 23 | 0,00 | ||||
| 2025-07-31 | 13F | Cambridge Investment Research Advisors, Inc. | 112 500 | 5,17 | 9 | 0,00 | ||||
| 2025-08-14 | 13F | SWAN Capital LLC | 245 377 | −5,91 | 18 624 | −5,92 | ||||
| 2025-07-07 | 13F | Bangor Savings Bank | 9 190 | 0,00 | 698 | 0,00 | ||||
| 2025-08-07 | 13F | Commerce Bank | 10 970 | 39,66 | 833 | 39,60 | ||||
| 2025-05-14 | 13F | Idaho Trust Bank | 0 | −100,00 | 0 | |||||
| 2025-07-17 | 13F | Nelson, Van Denburg & Campbell Wealth Management Group, LLC | 5 909 | 0,00 | 448 | 0,00 | ||||
| 2025-07-24 | 13F | Blair William & Co/il | 894 | 36,28 | 68 | 36,73 | ||||
| 2025-08-11 | 13F | United Capital Financial Advisers, Llc | 7 590 | 1,85 | 576 | 1,95 | ||||
| 2025-08-12 | 13F | Prudential Plc | 40 444 804 | −52,22 | 3 069 761 | −52,22 | ||||
| 2025-07-14 | 13F | Ridgewood Investments LLC | 200 | 0,00 | 15 | 0,00 | ||||
| 2025-08-14 | 13F | UBS Group AG | 649 790 | 2,13 | 49 319 | 2,12 | ||||
| 2025-08-05 | 13F | Palogic Value Management, L.P. | 34 565 | −3,20 | 2 620 | −3,25 | ||||
| 2025-08-06 | 13F | Summit Wealth Group, LLC | 3 186 | 0,00 | 0 | |||||
| 2025-08-29 | NP | BRMSX - Bramshill Income Performance Fund Institutional Class | 41 519 | 0,00 | 3 151 | 0,00 | ||||
| 2025-07-22 | 13F | Merit Financial Group, LLC | 6 710 | 509 | ||||||
| 2025-08-18 | 13F/A | National Bank Of Canada /fi/ | 342 | −7,82 | 26 | −10,71 | ||||
| 2025-07-14 | 13F | Sellwood Investment Partners LLC | 91 606 | 6,84 | 6 953 | 6,82 |