Grundläggande statistik
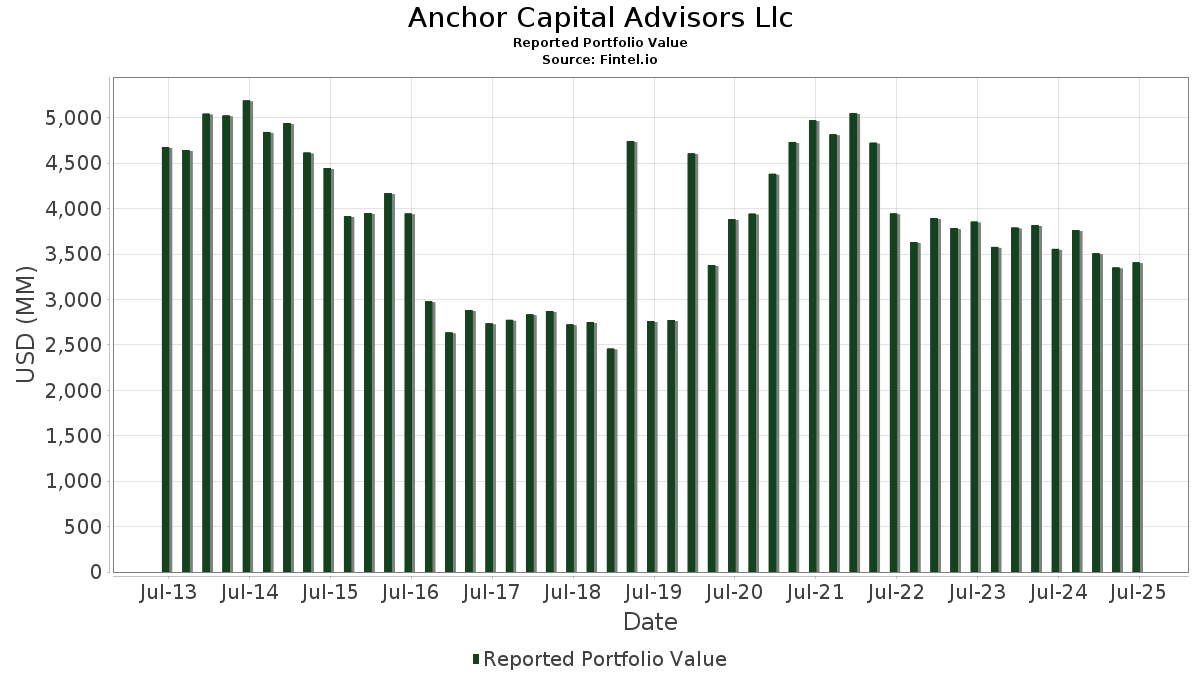
| Portföljvärde | $ 3 406 979 397 |
| Aktuella positioner | 240 |
Senaste innehav, resultat, förvaltat kapital (från 13F, 13D)
Anchor Capital Advisors Llc har redovisat 240 totala innehav i sina senaste SEC-arkiveringar. Det senaste portföljvärdet beräknas vara $ 3 406 979 397 USD. Faktiskt förvaltade tillgångar (AUM) är detta värde plus likvida medel (som inte redovisas). Anchor Capital Advisors Llcs största innehav är W. R. Berkley Corporation (US:WRB) , McKesson Corporation (US:MCK) , Ferguson Enterprises Inc. (US:FERG) , Cboe Global Markets, Inc. (US:CBOE) , and Markel Group Inc. (US:MKL) . Anchor Capital Advisors Llcs nya positioner inkluderar Rexford Industrial Realty, Inc. (US:REXR) , ConnectOne Bancorp, Inc. (US:CNOB) , The Toro Company (US:TTC) , Mr. Cooper Group Inc. (US:WMIH) , and .
Största ökningarna detta kvartal
Vi använder förändringen i portföljallokeringen eftersom det är det mest meningsfulla måttet. Förändringar kan bero på transaktioner eller förändringar i aktiekurser.
| Värdepapper | Aktier (MM) |
Värde (MM$) |
Portfölj % av | ΔPortfölj % av |
|---|---|---|---|---|
| 0,66 | 45,29 | 1,3292 | 1,3235 | |
| 1,13 | 40,37 | 1,1849 | 1,1849 | |
| 0,36 | 77,94 | 2,2877 | 1,0109 | |
| 0,09 | 16,16 | 0,4742 | 0,4649 | |
| 0,31 | 45,11 | 1,3240 | 0,3543 | |
| 0,46 | 56,32 | 1,6531 | 0,2935 | |
| 0,36 | 49,20 | 1,4440 | 0,2892 | |
| 0,08 | 14,77 | 0,4334 | 0,2717 | |
| 0,28 | 67,70 | 1,9872 | 0,2696 | |
| 0,19 | 25,63 | 0,7521 | 0,2635 |
Största minskningarna detta kvartal
Vi använder förändringen i portföljallokeringen eftersom det är det mest meningsfulla måttet. Förändringar kan bero på transaktioner eller förändringar i aktiepriser.
| Värdepapper | Aktier (MM) |
Värde (MM$) |
Portfölj % av | ΔPortfölj % av |
|---|---|---|---|---|
| 0,04 | 4,75 | 0,1395 | −1,1263 | |
| 0,05 | 1,62 | 0,0474 | −1,0314 | |
| 0,01 | 0,95 | 0,0280 | −0,9427 | |
| 0,26 | 21,64 | 0,6352 | −0,4051 | |
| 0,02 | 2,61 | 0,0766 | −0,3063 | |
| 0,29 | 40,42 | 1,1864 | −0,2600 | |
| 0,18 | 25,15 | 0,7381 | −0,2207 | |
| 0,73 | 29,68 | 0,8711 | −0,2178 | |
| 0,08 | 34,94 | 1,0257 | −0,2140 | |
| 0,06 | 11,86 | 0,3483 | −0,2099 |
13F- och fond arkiveringar
Denna blankett lämnades in den 2025-08-06 för rapporteringsperioden 2025-06-30. Klicka på länksymbolen för att se hela transaktionshistoriken.
Uppgradera för att låsa upp premiumdata och exportera till Excel![]() .
.
| Värdepapper | Typ | Genomsnittligt aktiepris | Aktier (MM) |
ΔAktier (%) |
ΔAktier (%) |
Värde ($MM) |
Portfölj (%) |
ΔPortfölj (%) |
|
|---|---|---|---|---|---|---|---|---|---|
| WRB / W. R. Berkley Corporation | 1,18 | −4,14 | 86,98 | −1,03 | 2,5529 | −0,0703 | |||
| MCK / McKesson Corporation | 0,12 | −3,58 | 85,75 | 4,99 | 2,5170 | 0,0790 | |||
| FERG / Ferguson Enterprises Inc. | 0,36 | 34,07 | 77,94 | 82,20 | 2,2877 | 1,0109 | |||
| CBOE / Cboe Global Markets, Inc. | 0,32 | −5,01 | 75,77 | −2,10 | 2,2241 | −0,0862 | |||
| MKL / Markel Group Inc. | 0,04 | −5,48 | 71,10 | 0,98 | 2,0868 | −0,0147 | |||
| MTB / M&T Bank Corporation | 0,36 | 5,63 | 70,45 | 14,63 | 2,0680 | 0,2335 | |||
| ADI / Analog Devices, Inc. | 0,28 | −0,31 | 67,70 | 17,65 | 1,9872 | 0,2696 | |||
| PNC / The PNC Financial Services Group, Inc. | 0,35 | 0,10 | 66,14 | 6,17 | 1,9412 | 0,0819 | |||
| CRH / CRH plc | 0,67 | −2,75 | 61,79 | 1,48 | 1,8137 | −0,0037 | |||
| CNH / CNH Industrial N.V. | 4,67 | −0,82 | 60,57 | 4,67 | 1,7778 | 0,0506 | |||
| CASY / Casey's General Stores, Inc. | 0,11 | −4,09 | 58,12 | 12,75 | 1,7059 | 0,1673 | |||
| LAMR / Lamar Advertising Company | 0,46 | 15,92 | 56,32 | 23,65 | 1,6531 | 0,2935 | |||
| MAA / Mid-America Apartment Communities, Inc. | 0,36 | 18,34 | 52,79 | 4,52 | 1,5495 | 0,0419 | |||
| BSX / Boston Scientific Corporation | 0,48 | −3,05 | 51,69 | 3,22 | 1,5171 | 0,0225 | |||
| CTVA / Corteva, Inc. | 0,69 | −4,00 | 51,07 | 13,70 | 1,4990 | 0,1583 | |||
| SNX / TD SYNNEX Corporation | 0,36 | −2,58 | 49,20 | 27,16 | 1,4440 | 0,2892 | |||
| LNT / Alliant Energy Corporation | 0,80 | −1,84 | 48,54 | −7,75 | 1,4247 | −0,1459 | |||
| ADSK / Autodesk, Inc. | 0,16 | −3,35 | 48,09 | 14,28 | 1,4114 | 0,1555 | |||
| CCI / Crown Castle Inc. | 0,46 | 2,73 | 47,71 | 1,25 | 1,4004 | −0,0061 | |||
| GEHC / GE HealthCare Technologies Inc. | 0,63 | 6,14 | 46,83 | −2,59 | 1,3745 | −0,0604 | |||
| SOLV / Solventum Corporation | 0,61 | −3,42 | 46,36 | −3,67 | 1,3607 | −0,0758 | |||
| HUBB / Hubbell Incorporated | 0,11 | −1,49 | 46,36 | 21,58 | 1,3606 | 0,2226 | |||
| KDP / Keurig Dr Pepper Inc. | 1,38 | 0,40 | 45,55 | −3,00 | 1,3370 | −0,0647 | |||
| DD / DuPont de Nemours, Inc. | 0,66 | 17 836,78 | 45,29 | 16 610,70 | 1,3292 | 1,3235 | |||
| BWXT / BWX Technologies, Inc. | 0,31 | −4,92 | 45,11 | 38,85 | 1,3240 | 0,3543 | |||
| XEL / Xcel Energy Inc. | 0,66 | 2,42 | 44,97 | −1,47 | 1,3199 | −0,0423 | |||
| JPM / JPMorgan Chase & Co. | 0,15 | −1,18 | 44,73 | 16,79 | 1,3130 | 0,1698 | |||
| FLR / Fluor Corporation | 0,86 | −12,45 | 44,24 | 25,31 | 1,2984 | 0,2447 | |||
| HSY / The Hershey Company | 0,26 | 0,61 | 42,96 | −2,38 | 1,2610 | −0,0526 | |||
| BR / Broadridge Financial Solutions, Inc. | 0,17 | −4,69 | 41,75 | −4,47 | 1,2253 | −0,0790 | |||
| YUM / Yum! Brands, Inc. | 0,28 | 19,13 | 41,57 | 12,18 | 1,2202 | 0,1141 | |||
| ACGL / Arch Capital Group Ltd. | 0,45 | −3,20 | 41,27 | −8,37 | 1,2113 | −0,1329 | |||
| FANG / Diamondback Energy, Inc. | 0,29 | −2,94 | 40,42 | −16,59 | 1,1864 | −0,2600 | |||
| REXR / Rexford Industrial Realty, Inc. | 1,13 | 40,37 | 1,1849 | 1,1849 | |||||
| EXPD / Expeditors International of Washington, Inc. | 0,35 | −2,06 | 40,35 | −6,94 | 1,1843 | −0,1099 | |||
| TEL / TE Connectivity plc | 0,24 | −22,30 | 40,00 | −7,26 | 1,1740 | −0,1133 | |||
| AJG / Arthur J. Gallagher & Co. | 0,12 | −1,45 | 39,74 | −8,62 | 1,1666 | −0,1316 | |||
| TOL / Toll Brothers, Inc. | 0,34 | −7,70 | 38,30 | −0,23 | 1,1242 | −0,0217 | |||
| WSO / Watsco, Inc. | 0,08 | −3,16 | 34,94 | −15,86 | 1,0257 | −0,2140 | |||
| SSNC / SS&C Technologies Holdings, Inc. | 0,42 | −3,29 | 34,74 | −4,14 | 1,0197 | −0,0620 | |||
| FIS / Fidelity National Information Services, Inc. | 0,42 | −8,53 | 33,86 | −0,28 | 0,9939 | −0,0197 | |||
| NSC / Norfolk Southern Corporation | 0,13 | −2,46 | 33,36 | 5,41 | 0,9792 | 0,0346 | |||
| GMED / Globus Medical, Inc. | 0,56 | 4,84 | 33,23 | −15,47 | 0,9752 | −0,1980 | |||
| MSFT / Microsoft Corporation | 0,07 | −2,61 | 33,12 | 29,05 | 0,9721 | 0,2061 | |||
| AVY / Avery Dennison Corporation | 0,19 | −0,44 | 32,69 | −1,83 | 0,9595 | −0,0345 | |||
| GPC / Genuine Parts Company | 0,26 | −1,97 | 31,77 | −0,19 | 0,9326 | −0,0176 | |||
| CPAY / Corpay, Inc. | 0,09 | −2,93 | 30,39 | −7,63 | 0,8920 | −0,0900 | |||
| POR / Portland General Electric Company | 0,73 | −10,70 | 29,68 | −18,65 | 0,8711 | −0,2178 | |||
| TT / Trane Technologies plc | 0,06 | −4,98 | 28,26 | 23,36 | 0,8293 | 0,1456 | |||
| IT / Gartner, Inc. | 0,07 | −0,41 | 27,66 | −4,09 | 0,8120 | −0,0490 | |||
| RTX / RTX Corporation | 0,18 | −2,62 | 26,54 | 7,35 | 0,7791 | 0,0411 | |||
| IWS / iShares Trust - iShares Russell Mid-Cap Value ETF | 0,19 | 49,21 | 25,63 | 56,53 | 0,7521 | 0,2635 | |||
| GS / The Goldman Sachs Group, Inc. | 0,04 | −0,12 | 25,33 | 29,40 | 0,7436 | 0,1592 | |||
| NSIT / Insight Enterprises, Inc. | 0,18 | −14,96 | 25,15 | −21,72 | 0,7381 | −0,2207 | |||
| BRK.A / Berkshire Hathaway Inc. | 0,05 | −2,13 | 23,91 | −10,74 | 0,7018 | −0,0977 | |||
| IEI / iShares Trust - iShares 3-7 Year Treasury Bond ETF | 0,20 | −2,96 | 23,90 | −2,18 | 0,7016 | −0,0278 | |||
| JNJ / Johnson & Johnson | 0,15 | −0,36 | 23,45 | −8,22 | 0,6883 | −0,0744 | |||
| IEF / iShares Trust - iShares 7-10 Year Treasury Bond ETF | 0,23 | 42,20 | 22,23 | 42,80 | 0,6524 | 0,1878 | |||
| SHY / iShares Trust - iShares 1-3 Year Treasury Bond ETF | 0,26 | −38,01 | 21,64 | −37,91 | 0,6352 | −0,4051 | |||
| CB / Chubb Limited | 0,07 | −2,00 | 21,58 | −5,98 | 0,6335 | −0,0517 | |||
| PGR / The Progressive Corporation | 0,07 | −3,23 | 19,64 | −8,76 | 0,5766 | −0,0660 | |||
| IDA / IDACORP, Inc. | 0,17 | −2,49 | 19,51 | −3,13 | 0,5726 | −0,0285 | |||
| SHEL / Shell plc - Depositary Receipt (Common Stock) | 0,27 | 0,01 | 18,86 | −3,90 | 0,5536 | −0,0322 | |||
| ABT / Abbott Laboratories | 0,14 | −2,06 | 18,46 | 0,42 | 0,5420 | −0,0068 | |||
| CME / CME Group Inc. | 0,07 | −0,63 | 18,08 | 3,24 | 0,5307 | 0,0080 | |||
| SHV / iShares Trust - iShares Short Treasury Bond ETF | 0,16 | −1,67 | 18,04 | −1,71 | 0,5296 | −0,0183 | |||
| AXP / American Express Company | 0,06 | 20,67 | 18,00 | 43,06 | 0,5282 | 0,1528 | |||
| TECK / Teck Resources Limited | 0,43 | −10,21 | 17,52 | −0,47 | 0,5143 | −0,0112 | |||
| IGSB / iShares Trust - iShares 1-5 Year Investment Grade Corporate Bond ETF | 0,33 | −2,46 | 17,34 | −1,73 | 0,5089 | −0,0177 | |||
| PG / The Procter & Gamble Company | 0,11 | −2,11 | 17,07 | −8,48 | 0,5011 | −0,0557 | |||
| CVX / Chevron Corporation | 0,12 | −0,96 | 16,99 | −15,22 | 0,4987 | −0,0995 | |||
| ETR / Entergy Corporation | 0,20 | −3,75 | 16,97 | −6,42 | 0,4979 | −0,0432 | |||
| BDX / Becton, Dickinson and Company | 0,09 | 6 761,89 | 16,16 | 5 061,98 | 0,4742 | 0,4649 | |||
| HON / Honeywell International Inc. | 0,07 | −0,37 | 16,10 | 9,57 | 0,4726 | 0,0340 | |||
| HAL / Halliburton Company | 0,79 | 22,80 | 16,08 | −1,36 | 0,4720 | −0,0146 | |||
| WMT / Walmart Inc. | 0,16 | −24,86 | 15,94 | −16,31 | 0,4678 | −0,1006 | |||
| MCD / McDonald's Corporation | 0,05 | −2,23 | 15,62 | −8,56 | 0,4583 | −0,0514 | |||
| AMT / American Tower Corporation | 0,07 | −1,85 | 15,09 | −0,31 | 0,4429 | −0,0089 | |||
| AMAT / Applied Materials, Inc. | 0,08 | 116,11 | 14,77 | 172,62 | 0,4334 | 0,2717 | |||
| LMT / Lockheed Martin Corporation | 0,03 | 21,21 | 14,50 | 25,68 | 0,4255 | 0,0812 | |||
| APD / Air Products and Chemicals, Inc. | 0,05 | −0,91 | 14,32 | −5,22 | 0,4202 | −0,0307 | |||
| UNP / Union Pacific Corporation | 0,06 | −1,29 | 14,00 | −3,87 | 0,4109 | −0,0238 | |||
| LOW / Lowe's Companies, Inc. | 0,06 | −1,05 | 13,89 | −5,86 | 0,4076 | −0,0327 | |||
| V / Visa Inc. | 0,04 | −2,36 | 13,84 | −1,09 | 0,4063 | −0,0114 | |||
| ALC / Alcon Inc. | 0,15 | −2,09 | 13,38 | −8,95 | 0,3926 | −0,0459 | |||
| PEP / PepsiCo, Inc. | 0,10 | −0,14 | 13,26 | −12,06 | 0,3892 | −0,0609 | |||
| O / Realty Income Corporation | 0,22 | −0,80 | 12,92 | −1,49 | 0,3793 | −0,0122 | |||
| IGIB / iShares Trust - iShares 5-10 Year Investment Grade Corporate Bond ETF | 0,23 | −2,61 | 12,20 | −1,18 | 0,3582 | −0,0104 | |||
| CMCSA / Comcast Corporation | 0,34 | −1,83 | 11,97 | −5,04 | 0,3513 | −0,0249 | |||
| ABBV / AbbVie Inc. | 0,06 | −28,38 | 11,86 | −36,55 | 0,3483 | −0,2099 | |||
| MPC / Marathon Petroleum Corporation | 0,07 | −1,44 | 11,74 | 12,37 | 0,3445 | 0,0327 | |||
| TMO / Thermo Fisher Scientific Inc. | 0,03 | −5,44 | 11,18 | −22,94 | 0,3282 | −0,1050 | |||
| PH / Parker-Hannifin Corporation | 0,02 | −2,40 | 10,88 | 12,16 | 0,3192 | 0,0298 | |||
| SLB / Schlumberger Limited | 0,27 | −3,98 | 9,28 | −22,36 | 0,2724 | −0,0844 | |||
| DEO / Diageo plc - Depositary Receipt (Common Stock) | 0,09 | 1,46 | 9,17 | −2,36 | 0,2693 | −0,0112 | |||
| RIO / Rio Tinto Group - Depositary Receipt (Common Stock) | 0,15 | −2,80 | 8,95 | −5,63 | 0,2628 | −0,0204 | |||
| MBB / iShares Trust - iShares MBS ETF | 0,09 | −2,62 | 8,69 | −2,50 | 0,2550 | −0,0110 | |||
| OTIS / Otis Worldwide Corporation | 0,08 | −1,74 | 8,19 | −5,72 | 0,2405 | −0,0189 | |||
| AZN / AstraZeneca PLC - Depositary Receipt (Common Stock) | 0,12 | −26,80 | 8,14 | −30,41 | 0,2389 | −0,1102 | |||
| CRM / Salesforce, Inc. | 0,03 | −0,84 | 8,02 | 0,75 | 0,2353 | −0,0022 | |||
| UNH / UnitedHealth Group Incorporated | 0,03 | −7,67 | 7,84 | −45,00 | 0,2301 | −0,1953 | |||
| FCX / Freeport-McMoRan Inc. | 0,16 | 0,16 | 6,78 | 14,69 | 0,1991 | 0,0226 | |||
| VCSH / Vanguard Scottsdale Funds - Vanguard Short-Term Corporate Bond ETF | 0,08 | −5,89 | 6,34 | −5,23 | 0,1862 | −0,0136 | |||
| AAPL / Apple Inc. | 0,03 | −2,16 | 6,17 | −9,63 | 0,1810 | −0,0227 | |||
| AHR / American Healthcare REIT, Inc. | 0,17 | −1,45 | 6,14 | 19,49 | 0,1802 | 0,0268 | |||
| REGN / Regeneron Pharmaceuticals, Inc. | 0,01 | 3,41 | 5,97 | −14,40 | 0,1752 | −0,0329 | |||
| IWB / iShares Trust - iShares Russell 1000 ETF | 0,02 | −6,02 | 5,27 | 4,05 | 0,1546 | 0,0035 | |||
| VCIT / Vanguard Scottsdale Funds - Vanguard Intermediate-Term Corporate Bond ETF | 0,06 | −1,58 | 5,07 | −0,20 | 0,1487 | −0,0028 | |||
| SUI / Sun Communities, Inc. | 0,04 | −88,60 | 4,75 | −88,79 | 0,1395 | −1,1263 | |||
| ETN / Eaton Corporation plc | 0,01 | −31,96 | 4,62 | −10,65 | 0,1355 | −0,0187 | |||
| IWD / iShares Trust - iShares Russell 1000 Value ETF | 0,02 | 33,38 | 4,60 | 37,69 | 0,1350 | 0,0353 | |||
| MINT / PIMCO ETF Trust - PIMCO Enhanced Short Maturity Active Exchange-Traded Fund | 0,04 | −20,00 | 3,92 | −20,09 | 0,1151 | −0,0313 | |||
| LQD / iShares Trust - iShares iBoxx $ Investment Grade Corporate Bond ETF | 0,03 | −0,62 | 3,19 | 0,22 | 0,0935 | −0,0014 | |||
| UL / Unilever PLC - Depositary Receipt (Common Stock) | 0,05 | −1,99 | 3,15 | 0,67 | 0,0923 | −0,0009 | |||
| TPL / Texas Pacific Land Corporation | 0,00 | −0,07 | 3,10 | −20,32 | 0,0910 | −0,0252 | |||
| DAKT / Daktronics, Inc. | 0,20 | −2,22 | 2,96 | 21,40 | 0,0869 | 0,0141 | |||
| IWR / iShares Trust - iShares Russell Mid-Cap ETF | 0,03 | −12,49 | 2,83 | −5,38 | 0,0832 | −0,0062 | |||
| IWM / iShares Trust - iShares Russell 2000 ETF | 0,01 | −14,77 | 2,81 | −7,83 | 0,0826 | −0,0085 | |||
| BSV / Vanguard Bond Index Funds - Vanguard Short-Term Bond ETF | 0,04 | −0,98 | 2,78 | −0,47 | 0,0816 | −0,0018 | |||
| NIC / Nicolet Bankshares, Inc. | 0,02 | −3,49 | 2,75 | 9,36 | 0,0806 | 0,0057 | |||
| REVG / REV Group, Inc. | 0,06 | −7,93 | 2,71 | 38,67 | 0,0796 | 0,0212 | |||
| BAH / Booz Allen Hamilton Holding Corporation | 0,03 | −11,07 | 2,65 | −11,48 | 0,0777 | −0,0115 | |||
| APO / Apollo Global Management, Inc. | 0,02 | −80,36 | 2,61 | −79,65 | 0,0766 | −0,3063 | |||
| MGNR / American Beacon Select Funds - American Beacon GLG Natural Resources ETF | 0,08 | 6,94 | 2,52 | 19,32 | 0,0740 | 0,0109 | |||
| EG / Everest Group, Ltd. | 0,01 | 13,04 | 2,48 | 5,75 | 0,0729 | 0,0028 | |||
| SENEA / Seneca Foods Corporation | 0,02 | −3,41 | 2,30 | 10,03 | 0,0676 | 0,0051 | |||
| RPM / RPM International Inc. | 0,02 | 0,79 | 2,28 | −4,28 | 0,0670 | −0,0042 | |||
| AON / Aon plc | 0,01 | −6,46 | 2,27 | −16,38 | 0,0665 | −0,0144 | |||
| MGY / Magnolia Oil & Gas Corporation | 0,10 | −3,04 | 2,15 | −13,71 | 0,0632 | −0,0113 | |||
| ATMU / Atmus Filtration Technologies Inc. | 0,06 | −0,83 | 2,10 | −1,69 | 0,0616 | −0,0021 | |||
| JCI / Johnson Controls International plc | 0,02 | 0,00 | 2,09 | 31,90 | 0,0613 | 0,0140 | |||
| HWKN / Hawkins, Inc. | 0,01 | −3,04 | 2,00 | 30,05 | 0,0588 | 0,0128 | |||
| CNOB / ConnectOne Bancorp, Inc. | 0,09 | 2,00 | 0,0587 | 0,0587 | |||||
| CBU / Community Financial System, Inc. | 0,03 | −0,34 | 1,88 | −0,32 | 0,0551 | −0,0011 | |||
| PJT / PJT Partners Inc. | 0,01 | −3,02 | 1,87 | 16,08 | 0,0549 | 0,0068 | |||
| CVCO / Cavco Industries, Inc. | 0,00 | −17,01 | 1,84 | −30,62 | 0,0539 | −0,0251 | |||
| CL / Colgate-Palmolive Company | 0,02 | −7,53 | 1,82 | −10,28 | 0,0533 | −0,0071 | |||
| MSA / MSA Safety Incorporated | 0,01 | −1,13 | 1,81 | 12,88 | 0,0530 | 0,0053 | |||
| ICFI / ICF International, Inc. | 0,02 | 1,74 | 0,0511 | 0,0511 | |||||
| UBSI / United Bankshares, Inc. | 0,05 | −2,55 | 1,74 | 2,36 | 0,0510 | 0,0003 | |||
| VGSH / Vanguard Scottsdale Funds - Vanguard Short-Term Treasury ETF | 0,03 | 0,00 | 1,72 | 0,12 | 0,0505 | −0,0008 | |||
| TTC / The Toro Company | 0,02 | 1,72 | 0,0504 | 0,0504 | |||||
| STAG / STAG Industrial, Inc. | 0,04 | −2,40 | 1,63 | −1,99 | 0,0477 | −0,0018 | |||
| NSA / National Storage Affiliates Trust | 0,05 | −94,49 | 1,62 | −95,53 | 0,0474 | −1,0314 | |||
| UTL / Unitil Corporation | 0,03 | 0,64 | 1,62 | −9,01 | 0,0474 | −0,0056 | |||
| SKYW / SkyWest, Inc. | 0,02 | −3,26 | 1,58 | 14,02 | 0,0463 | 0,0050 | |||
| MDLZ / Mondelez International, Inc. | 0,02 | −39,84 | 1,56 | −40,21 | 0,0459 | −0,0322 | |||
| NNI / Nelnet, Inc. | 0,01 | −3,42 | 1,56 | 5,41 | 0,0458 | 0,0016 | |||
| MEC / Mayville Engineering Company, Inc. | 0,10 | −3,18 | 1,56 | 15,07 | 0,0457 | 0,0053 | |||
| ROCK / Gibraltar Industries, Inc. | 0,03 | −1,23 | 1,55 | −0,64 | 0,0456 | −0,0011 | |||
| CHRD / Chord Energy Corporation | 0,02 | −20,70 | 1,54 | −31,87 | 0,0451 | −0,0222 | |||
| FBND / Fidelity Merrimack Street Trust - Fidelity Total Bond ETF | 0,03 | −38,86 | 1,37 | −38,71 | 0,0402 | −0,0265 | |||
| GOOGL / Alphabet Inc. | 0,01 | 0,00 | 1,35 | 13,98 | 0,0395 | 0,0043 | |||
| HIFS / Hingham Institution for Savings | 0,01 | −1,40 | 1,31 | 2,98 | 0,0386 | 0,0005 | |||
| KO / The Coca-Cola Company | 0,02 | −10,44 | 1,30 | −11,50 | 0,0382 | −0,0057 | |||
| SAFT / Safety Insurance Group, Inc. | 0,02 | −3,39 | 1,29 | −2,79 | 0,0379 | −0,0017 | |||
| VV / Vanguard Index Funds - Vanguard Large-Cap ETF | 0,00 | −7,41 | 1,29 | 2,71 | 0,0379 | 0,0004 | |||
| WINA / Winmark Corporation | 0,00 | −2,83 | 1,27 | 15,48 | 0,0372 | 0,0044 | |||
| ORCL / Oracle Corporation | 0,01 | 0,00 | 1,26 | 56,54 | 0,0369 | 0,0129 | |||
| ETON / Eton Pharmaceuticals, Inc. | 0,09 | 45,67 | 1,25 | 59,92 | 0,0367 | 0,0133 | |||
| CHCT / Community Healthcare Trust Incorporated | 0,08 | −2,03 | 1,25 | −10,27 | 0,0367 | −0,0049 | |||
| SYK / Stryker Corporation | 0,00 | 0,00 | 1,24 | 6,27 | 0,0363 | 0,0016 | |||
| ULH / Universal Logistics Holdings, Inc. | 0,05 | −1,25 | 1,23 | −4,49 | 0,0362 | −0,0023 | |||
| IWN / iShares Trust - iShares Russell 2000 Value ETF | 0,01 | 17,77 | 1,18 | 23,15 | 0,0347 | 0,0060 | |||
| FI / Fiserv, Inc. | 0,01 | −2,01 | 1,18 | −23,47 | 0,0346 | −0,0114 | |||
| QCOM / QUALCOMM Incorporated | 0,01 | −84,16 | 1,15 | −83,58 | 0,0337 | −0,1752 | |||
| BV / BrightView Holdings, Inc. | 0,07 | −3,05 | 1,14 | 25,72 | 0,0334 | 0,0064 | |||
| ASUR / Asure Software, Inc. | 0,12 | −3,31 | 1,14 | −1,22 | 0,0334 | −0,0010 | |||
| SSD / Simpson Manufacturing Co., Inc. | 0,01 | −0,43 | 1,12 | −1,59 | 0,0328 | −0,0011 | |||
| XOM / Exxon Mobil Corporation | 0,01 | −2,31 | 1,11 | −11,47 | 0,0326 | −0,0048 | |||
| GOOG / Alphabet Inc. | 0,01 | 0,00 | 1,11 | 13,60 | 0,0326 | 0,0034 | |||
| EA / Electronic Arts Inc. | 0,01 | −12,53 | 1,10 | −3,34 | 0,0323 | −0,0017 | |||
| HLMN / Hillman Solutions Corp. | 0,15 | 2,90 | 1,09 | −16,44 | 0,0319 | −0,0069 | |||
| UFPT / UFP Technologies, Inc. | 0,00 | −2,57 | 1,05 | 17,95 | 0,0307 | 0,0042 | |||
| MGRC / McGrath RentCorp | 0,01 | −2,62 | 1,03 | 1,38 | 0,0303 | −0,0001 | |||
| PYPL / PayPal Holdings, Inc. | 0,01 | −4,66 | 1,03 | 8,58 | 0,0301 | 0,0019 | |||
| EFA / iShares Trust - iShares MSCI EAFE ETF | 0,01 | −5,76 | 1,02 | 3,02 | 0,0301 | 0,0004 | |||
| AMZN / Amazon.com, Inc. | 0,00 | 70,50 | 1,01 | 96,88 | 0,0296 | 0,0143 | |||
| IGF / iShares Trust - iShares Global Infrastructure ETF | 0,02 | −0,70 | 0,98 | 7,56 | 0,0288 | 0,0016 | |||
| CXT / Crane NXT, Co. | 0,02 | −26,83 | 0,98 | −23,29 | 0,0286 | −0,0093 | |||
| HOLX / Hologic, Inc. | 0,01 | 0,00 | 0,96 | 5,52 | 0,0280 | 0,0010 | |||
| AOS / A. O. Smith Corporation | 0,01 | −97,08 | 0,95 | −97,07 | 0,0280 | −0,9427 | |||
| CTRN / Citi Trends, Inc. | 0,03 | −2,97 | 0,94 | 46,50 | 0,0277 | 0,0084 | |||
| VOO / Vanguard Index Funds - Vanguard S&P 500 ETF | 0,00 | 78,32 | 0,92 | 97,20 | 0,0269 | 0,0130 | |||
| MDT / Medtronic plc | 0,01 | −5,75 | 0,88 | −8,53 | 0,0258 | −0,0029 | |||
| FLOT / iShares Trust - iShares Floating Rate Bond ETF | 0,02 | 0,00 | 0,83 | 0,00 | 0,0243 | −0,0004 | |||
| MAR / Marriott International, Inc. | 0,00 | −2,06 | 0,82 | 12,35 | 0,0240 | 0,0023 | |||
| FAF / First American Financial Corporation | 0,01 | −28,78 | 0,82 | −33,44 | 0,0240 | −0,0127 | |||
| BA / The Boeing Company | 0,00 | 0,00 | 0,74 | 22,85 | 0,0218 | 0,0038 | |||
| CSCO / Cisco Systems, Inc. | 0,01 | −0,58 | 0,72 | 11,84 | 0,0211 | 0,0019 | |||
| ACWI / iShares Trust - iShares MSCI ACWI ETF | 0,01 | −9,97 | 0,71 | −0,56 | 0,0210 | −0,0005 | |||
| FDS / FactSet Research Systems Inc. | 0,00 | 0,00 | 0,67 | −1,62 | 0,0197 | −0,0007 | |||
| JILL / J.Jill, Inc. | 0,05 | −3,08 | 0,66 | −27,31 | 0,0194 | −0,0077 | |||
| CROX / Crocs, Inc. | 0,01 | −2,71 | 0,66 | −7,19 | 0,0193 | −0,0019 | |||
| STT / State Street Corporation | 0,01 | −1,45 | 0,65 | 17,12 | 0,0191 | 0,0025 | |||
| ES / Eversource Energy | 0,01 | −42,10 | 0,61 | −40,66 | 0,0179 | −0,0128 | |||
| RMD / ResMed Inc. | 0,00 | 0,00 | 0,60 | 15,33 | 0,0177 | 0,0021 | |||
| LLY / Eli Lilly and Company | 0,00 | 0,00 | 0,60 | −5,69 | 0,0175 | −0,0014 | |||
| IVV / iShares Trust - iShares Core S&P 500 ETF | 0,00 | −4,47 | 0,60 | 5,66 | 0,0175 | 0,0006 | |||
| VTI / Vanguard Index Funds - Vanguard Total Stock Market ETF | 0,00 | 0,00 | 0,58 | 10,63 | 0,0171 | 0,0014 | |||
| TXN / Texas Instruments Incorporated | 0,00 | 0,00 | 0,58 | 15,51 | 0,0171 | 0,0020 | |||
| SAIC / Science Applications International Corporation | 0,01 | −1,54 | 0,57 | −1,22 | 0,0167 | −0,0005 | |||
| ITW / Illinois Tool Works Inc. | 0,00 | 0,00 | 0,54 | −0,37 | 0,0159 | −0,0003 | |||
| DFH / Dream Finders Homes, Inc. | 0,02 | −6,36 | 0,53 | 4,31 | 0,0157 | 0,0004 | |||
| AME / AMETEK, Inc. | 0,00 | 0,00 | 0,49 | 5,11 | 0,0145 | 0,0005 | |||
| COP / ConocoPhillips | 0,01 | −1,04 | 0,47 | −15,47 | 0,0138 | −0,0028 | |||
| IEFA / iShares Trust - iShares Core MSCI EAFE ETF | 0,00 | 0,00 | 0,42 | 10,37 | 0,0122 | 0,0010 | |||
| SPY / SPDR S&P 500 ETF | 0,00 | 2,45 | 0,41 | 13,15 | 0,0121 | 0,0012 | |||
| VNT / Vontier Corporation | 0,01 | −13,94 | 0,41 | −3,28 | 0,0121 | −0,0006 | |||
| HD / The Home Depot, Inc. | 0,00 | 0,00 | 0,41 | 0,00 | 0,0121 | −0,0002 | |||
| ULTA / Ulta Beauty, Inc. | 0,00 | −6,16 | 0,41 | 19,77 | 0,0121 | 0,0018 | |||
| AGG / iShares Trust - iShares Core U.S. Aggregate Bond ETF | 0,00 | −13,24 | 0,41 | −13,01 | 0,0120 | −0,0020 | |||
| MAGS / Listed Funds Trust - Roundhill Magnificent Seven ETF | 0,01 | −36,90 | 0,38 | −23,66 | 0,0113 | −0,0037 | |||
| BND / Vanguard Bond Index Funds - Vanguard Total Bond Market ETF | 0,01 | 0,00 | 0,38 | 0,27 | 0,0110 | −0,0002 | |||
| SPGI / S&P Global Inc. | 0,00 | 0,00 | 0,37 | 3,92 | 0,0109 | 0,0002 | |||
| XPO / XPO, Inc. | 0,00 | −6,41 | 0,37 | 9,85 | 0,0108 | 0,0008 | |||
| CAT / Caterpillar Inc. | 0,00 | 0,00 | 0,36 | 17,43 | 0,0105 | 0,0014 | |||
| AMGN / Amgen Inc. | 0,00 | 0,00 | 0,34 | −10,42 | 0,0101 | −0,0014 | |||
| MDY / SPDR S&P MidCap 400 ETF Trust | 0,00 | 0,00 | 0,31 | 6,08 | 0,0092 | 0,0004 | |||
| VCLT / Vanguard Scottsdale Funds - Vanguard Long-Term Corporate Bond ETF | 0,00 | 0,00 | 0,31 | 0,00 | 0,0092 | −0,0002 | |||
| K / Kellanova | 0,00 | 0,00 | 0,30 | −3,51 | 0,0089 | −0,0005 | |||
| KR / The Kroger Co. | 0,00 | 0,00 | 0,29 | 5,93 | 0,0084 | 0,0003 | |||
| SO / The Southern Company | 0,00 | 0,00 | 0,28 | 0,00 | 0,0081 | −0,0001 | |||
| VNQ / Vanguard Specialized Funds - Vanguard Real Estate ETF | 0,00 | −1,76 | 0,27 | −3,55 | 0,0080 | −0,0004 | |||
| USMV / iShares Trust - iShares MSCI USA Min Vol Factor ETF | 0,00 | 0,00 | 0,27 | 0,37 | 0,0079 | −0,0001 | |||
| META / Meta Platforms, Inc. | 0,00 | 0,00 | 0,27 | 28,37 | 0,0078 | 0,0016 | |||
| C / Citigroup Inc. | 0,00 | −22,50 | 0,25 | −7,06 | 0,0074 | −0,0007 | |||
| WWD / Woodward, Inc. | 0,00 | 0,25 | 0,0072 | 0,0072 | |||||
| HCI / HCI Group, Inc. | 0,00 | 10,53 | 0,24 | 12,74 | 0,0070 | 0,0007 | |||
| CP / Canadian Pacific Kansas City Limited | 0,00 | −9,85 | 0,23 | 1,78 | 0,0067 | 0,0000 | |||
| WAT / Waters Corporation | 0,00 | −2,38 | 0,23 | −7,29 | 0,0067 | −0,0007 | |||
| LIN / Linde plc | 0,00 | 0,00 | 0,23 | 0,90 | 0,0066 | −0,0001 | |||
| IJJ / iShares Trust - iShares S&P Mid-Cap 400 Value ETF | 0,00 | −52,29 | 0,22 | −50,67 | 0,0065 | −0,0069 | |||
| IWX / iShares Trust - iShares Russell Top 200 Value ETF | 0,00 | −20,19 | 0,22 | −18,18 | 0,0064 | −0,0015 | |||
| WMIH / Mr. Cooper Group Inc. | 0,00 | 0,21 | 0,0062 | 0,0062 | |||||
| HES / Hess Corporation | 0,00 | 0,00 | 0,21 | −13,22 | 0,0062 | −0,0011 | |||
| NVS / Novartis AG - Depositary Receipt (Common Stock) | 0,00 | 0,21 | 0,0061 | 0,0061 | |||||
| WTW / Willis Towers Watson Public Limited Company | 0,00 | 0,00 | 0,20 | −9,42 | 0,0059 | −0,0007 | |||
| PEG / Public Service Enterprise Group Incorporated | 0,00 | −4,00 | 0,20 | −1,46 | 0,0059 | −0,0002 | |||
| EVLV / Evolv Technologies Holdings, Inc. | 0,02 | 0,00 | 0,10 | 102,00 | 0,0030 | 0,0015 | |||
| PLOW / Douglas Dynamics, Inc. | 0,00 | −100,00 | 0,00 | 0,0000 | |||||
| HELE / Helen of Troy Limited | 0,00 | −100,00 | 0,00 | 0,0000 | |||||
| VOE / Vanguard Index Funds - Vanguard Mid-Cap Value ETF | 0,00 | −100,00 | 0,00 | 0,0000 | |||||
| BIO / Bio-Rad Laboratories, Inc. | 0,00 | −100,00 | 0,00 | 0,0000 | |||||
| NEE / NextEra Energy, Inc. | 0,00 | −100,00 | 0,00 | 0,0000 | |||||
| PFE / Pfizer Inc. | 0,00 | −100,00 | 0,00 | 0,0000 | |||||
| FLIC / The First of Long Island Corporation | 0,00 | −100,00 | 0,00 | 0,0000 | |||||
| ROST / Ross Stores, Inc. | 0,00 | −100,00 | 0,00 | 0,0000 | |||||
| SPB / Spectrum Brands Holdings, Inc. | 0,00 | −100,00 | 0,00 | 0,0000 |