Grundläggande statistik
| Institutionella ägare | 331 total, 331 long only, 0 short only, 0 long/short - change of −4,58% MRQ |
| Genomsnittlig portföljallokering | 0.2789 % - change of −4,71% MRQ |
| Institutionella aktier (lång) | 71 594 749 (ex 13D/G) - change of −10,87MM shares −13,18% MRQ |
| Institutionellt värde (lång) | $ 738 887 USD ($1000) |
Institutionellt ägande och aktieägare
Nuveen AMT-Free Quality Municipal Income Fund (US:NEA) har 331 Institutionella ägare och aktieägare som har lämnat in 13D/G- eller 13F-formulär till Securities Exchange Commission (SEC). Dessa institut innehar totalt 71,594,749 aktier. Största aktieägare inkluderar Morgan Stanley, Mackay Shields Llc, Wells Fargo & Company/mn, Bramshill Investments, LLC, Rivernorth Capital Management, Llc, Raymond James Financial Inc, BlackRock, Inc., UBS Group AG, BLACKROCK MUNICIPAL SERIES TRUST - BlackRock Strategic Municipal Opportunities Fund of BlackRock Municipal Series Trust Investor A1, and Bank Of America Corp /de/ .
Nuveen AMT-Free Quality Municipal Income Fund (NYSE:NEA) Institutionell ägarstruktur visar institutioners och fonders nuvarande positioner i företaget, samt de senaste förändringarna i positionernas storlek. Större aktieägare kan vara enskilda investerare, fonder, hedgefonder eller institutioner. Bilaga 13D visar att investeraren äger (eller ägde) mer än 5% av företaget och avser (eller avsåg) att aktivt eftersträva en förändring av affärsstrategin. Schedule 13G indikerar en passiv investering på över 5%.
The share price as of September 16, 2025 is 11,33 / share. Previously, on September 17, 2024, the share price was 11,83 / share. This represents a decline of 4,23% over that period.

Fondsentimentets poäng
Fondsentimentet poängen(fka Ägarackumulation-poäng) visar vilka aktier som är mest köpta av fonder. Det är resultatet av en sofistikerad kvantitativ flerfaktormodell som identifierar företag med de högsta nivåerna av institutionell ackumulering. Poängsättningsmodellen använder en kombination av den totala ökningen av redovisade ägare, förändringarna i portföljallokeringarna för dessa ägare och andra mått. Siffran sträcker sig från 0 till 100, där högre siffror indikerar en högre nivå av ackumulering i förhållande till sina konkurrenter, och 50 är genomsnittet.
Uppdateringsfrekvens: Dagligen
Se Ownership Explorer, som innehåller en lista över de högst rankade företagen.
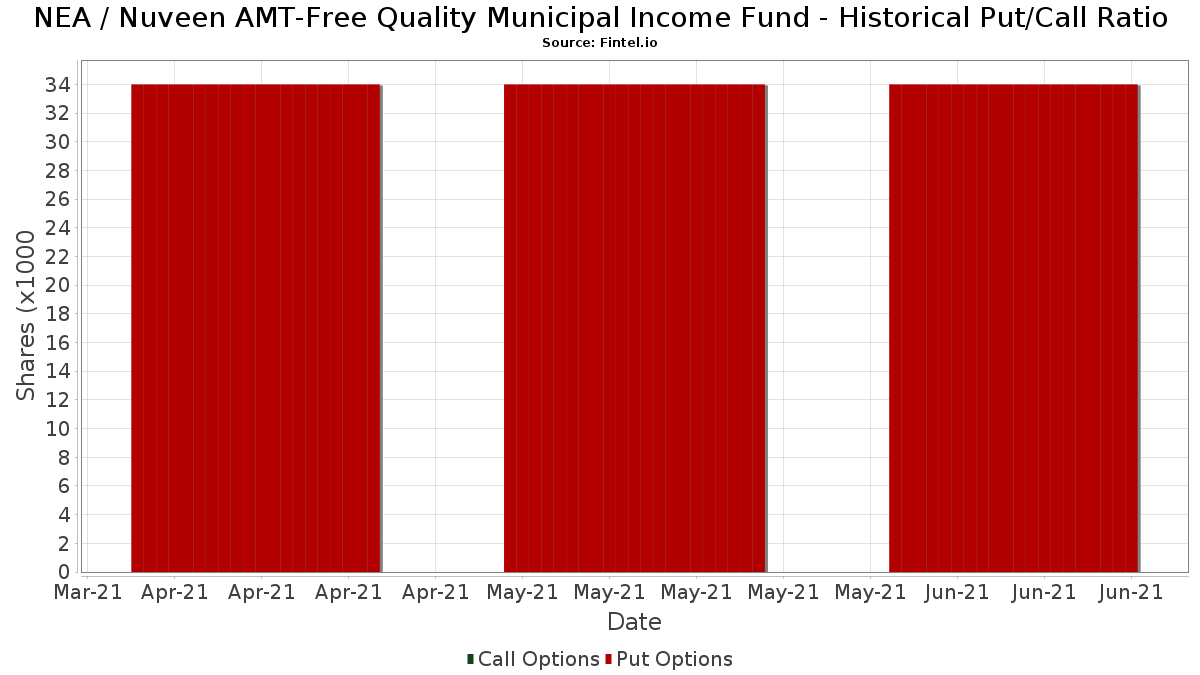
Institutionell sälj/köp-kvot
Förutom att rapportera vanliga eget kapital- och skuldemissioner måste institutioner med mer än 100MM tillgångar under förvaltning också avslöja sina innehav av sälj- och köpoptioner. Eftersom säljoptioner i allmänhet indikerar ett negativt sentiment och köpoptioner indikerar ett positivt sentiment, kan vi få en uppfattning om det övergripande institutionella sentimentet genom att plotta förhållandet mellan säljoptioner och köpoptioner. Diagrammet till höger visar det historiska förhållandet mellan sälj- och köpoptioner för detta instrument.
Genom att använda sälj/köp-kvoten som en indikator på aktieägarnas sentiment undviker man en av de största bristerna med att använda det totala institutionella ägandet, nämligen att en betydande del av de förvaltade tillgångarna investeras passivt för att följa index. Passivt förvaltade fonder köper vanligtvis inte optioner, så indikatorn för sälj/köp-kvoten ger en bättre bild av stämningen i aktivt förvaltade fonder.
13D/G-Arkiveringar
Vi presenterar 13D/G-arkiveringar separat från 13F-arkiveringar på grund av att de behandlas olika av SEC. 13D/G-arkiveringar kan lämnas in av grupper av investerare (med en ledare), medan 13F-arkiveringar inte kan det. Detta leder till situationer där en investerare kan lämna in en 13D/G-ansökan med ett värde för de totala aktierna (vilket motsvarar alla aktier som ägs av investerargruppen), men sedan lämna in en 13F-ansökan med ett annat värde för de totala aktierna (vilket motsvarar enbart deras eget ägande). Detta innebär att aktieägandet i 13D/G-arkiveringar och 13F-arkiveringar ofta inte är direkt jämförbara, så vi presenterar dem separat.
Notera: Från och med den 16 maj 2021 visar vi inte längre ägare som inte har lämnat in en 13D/G under det senaste året. Tidigare visade vi hela historiken för 13D/G-arkiveringar. I allmänhet måste enheter som är skyldiga att lämna in 13D/G-arkiveringar lämna in minst en gång per år innan de lämnar in en stängningsarkivering. Fonder avslutar dock ibland positioner utan att lämna in en avslutande arkivering (dvs. de avvecklar), så att visa hela historiken resulterade ibland i förvirring om det nuvarande ägandet. För att förhindra förvirring visar vi nu endast "nuvarande" ägare - det vill säga ägare som har lämnat in en ansökan under det senaste året.
Upgrade to unlock premium data.
| Fil Datum | Formulär | Investerare | Föregående aktier |
Senaste aktier |
Δ Aktier (Procent) |
Ägande (Procent) |
Δ Ägande (Procent) |
|
|---|---|---|---|---|---|---|---|---|
| 2024-12-13 | BANK OF AMERICA CORP /DE/ | 3,285 | 1,350 | -58.90 | 0.40 | -72.97 | ||
| 2024-10-02 | Karpus Management, Inc. | 15,639,485 | 14,832,402 | -5.16 | 4.96 | -5.16 |
13F- och NPORT-arkiveringar
Detaljer om 13F-arkiveringar är gratis. Detaljer om NP-arkiveringar kräver ett premiummedlemskap. Gröna rader indikerar nya positioner. Röda rader indikerar stängda positioner. Klicka på länk symbolen för att se hela transaktionshistoriken.
Uppgradera
för att låsa upp premiumdata och exportera till Excel ![]() .
.
| Fil Datum | Källa | Investerare | Typ | Genomsnittligt pris (beräknat) |
Aktier | Δ Aktier (%) |
Rapporterat värde (1000 USD) |
Δ Värde (%) |
Portföljallokering (%) |
|
|---|---|---|---|---|---|---|---|---|---|---|
| 2025-07-25 | 13F | Alpha Financial Partners, LLC | 53 675 | 586 | ||||||
| 2025-07-10 | 13F | Oliver Lagore Vanvalin Investment Group | 4 144 | 0,00 | 46 | 0,00 | ||||
| 2025-05-29 | NP | JNL SERIES TRUST - JNL/Westchester Capital Event Driven Fund (A) | 36 299 | 0,00 | 407 | −0,73 | ||||
| 2025-04-28 | 13F | Coastline Trust Co | 0 | −100,00 | 0 | |||||
| 2025-08-13 | 13F | Cerity Partners LLC | 39 837 | 8,14 | 435 | 5,58 | ||||
| 2025-08-14 | 13F | Alliancebernstein L.p. | 27 399 | 0,00 | 299 | −2,29 | ||||
| 2025-07-21 | 13F | Hilltop National Bank | 948 | 0,00 | 10 | 0,00 | ||||
| 2025-08-12 | 13F | Global Retirement Partners, LLC | 2 100 | 0,00 | 23 | −4,35 | ||||
| 2025-06-25 | NP | XMPT - VanEck Vectors CEF Municipal Income ETF | 1 246 062 | −1,50 | 13 557 | −6,15 | ||||
| 2025-07-25 | NP | MFLX - First Trust Municipal CEF Income Opportunity ETF This fund is a listed as child fund of First Trust Advisors Lp and if that institution has disclosed ownership in this security, then these positions will not be double counted when calculating total shares and total value | 14 622 | 0,00 | 159 | −6,51 | ||||
| 2025-07-08 | 13F | Melone Private Wealth, LLC | 345 091 | 50,45 | 3 741 | 45,64 | ||||
| 2025-07-31 | 13F | Moloney Securities Asset Management, LLC | 33 884 | 1,50 | 370 | −0,80 | ||||
| 2025-04-08 | 13F | Parallel Advisors, LLC | 0 | −100,00 | 0 | |||||
| 2025-07-17 | 13F | Venture Visionary Partners LLC | 29 876 | 0,00 | 326 | −2,40 | ||||
| 2025-08-04 | 13F | Pensionmark Financial Group, Llc | 10 950 | 0,00 | 120 | −2,46 | ||||
| 2025-04-29 | 13F | Tradewinds, LLC. | 0 | −100,00 | 0 | |||||
| 2025-08-27 | NP | RMMBX - Aspiriant Risk-Managed Municipal Bond Fund | 21 738 | 0,00 | 237 | −2,47 | ||||
| 2025-08-14 | 13F | Van Eck Associates Corp | 1 243 338 | 0,39 | 14 | 0,00 | ||||
| 2025-08-14 | 13F | Mariner, LLC | 80 772 | 5,11 | 882 | 2,56 | ||||
| 2025-08-14 | 13F | UBS Group AG | 1 807 866 | 0,09 | 19 742 | −2,41 | ||||
| 2025-07-24 | 13F | Costello Asset Management, INC | 437 | 2,10 | 5 | 0,00 | ||||
| 2025-08-08 | 13F | Fiera Capital Corp | 448 355 | −1,41 | 4 896 | −3,87 | ||||
| 2025-08-06 | 13F | Savant Capital, LLC | 161 788 | −0,15 | 1 767 | −2,65 | ||||
| 2025-08-07 | 13F | Ibex Wealth Advisors | 155 527 | −2,52 | 1 698 | −4,93 | ||||
| 2025-08-15 | 13F | Captrust Financial Advisors | 62 370 | −6,33 | 681 | −8,59 | ||||
| 2025-08-13 | 13F | Brown Advisory Inc | 12 650 | 138 | ||||||
| 2025-08-11 | 13F | Advisor Resource Council | 0 | −100,00 | 0 | |||||
| 2025-05-07 | 13F | Sheaff Brock Investment Advisors, LLC | 11 141 | 0,00 | 125 | −0,80 | ||||
| 2025-05-08 | 13F | Essential Planning, LLC. | 0 | −100,00 | 0 | |||||
| 2025-08-12 | 13F | AlphaCore Capital LLC | 34 785 | 5,02 | 382 | 2,41 | ||||
| 2025-07-31 | 13F | Richards, Merrill & Peterson, Inc. | 0 | −100,00 | 0 | |||||
| 2025-08-13 | 13F | Fisher Asset Management, LLC | 13 575 | 148 | ||||||
| 2025-08-18 | 13F/A | Nomura Holdings Inc | 10 000 | 109 | ||||||
| 2025-08-13 | 13F | StoneX Group Inc. | 275 329 | 16,82 | 3 008 | 13,94 | ||||
| 2025-08-14 | 13F | Wiley Bros.-aintree Capital, Llc | 33 643 | 14,98 | 367 | 12,92 | ||||
| 2025-08-29 | NP | BHILX - BHILL Fund Managed Account Completion Shares | 162 569 | 1 775 | ||||||
| 2025-05-12 | 13F | Sandy Spring Bank | 1 575 | 1,61 | 18 | 0,00 | ||||
| 2025-07-25 | 13F | We Are One Seven, LLC | 14 319 | −13,54 | 156 | −15,68 | ||||
| 2025-07-09 | 13F | VisionPoint Advisory Group, LLC | 17 836 | 47,02 | 195 | 43,70 | ||||
| 2025-07-31 | 13F | Cambridge Investment Research Advisors, Inc. | 218 223 | 4,97 | 2 | 0,00 | ||||
| 2025-08-14 | 13F | German American Bancorp, Inc. | 10 604 | 116 | ||||||
| 2025-08-14 | 13F | Royal Bank Of Canada | 1 201 417 | 0,69 | 13 120 | −1,83 | ||||
| 2025-08-18 | 13F | Geneos Wealth Management Inc. | 21 096 | −26,35 | 230 | −28,12 | ||||
| 2025-08-14 | 13F | Goldman Sachs Group Inc | 0 | −100,00 | 0 | |||||
| 2025-08-07 | 13F | McClarren Financial Advisors, Inc. | 0 | −100,00 | 0 | |||||
| 2025-08-14 | 13F | Hilltop Holdings Inc. | 16 331 | 0,00 | 178 | −2,20 | ||||
| 2025-08-28 | NP | RDFI - RAREVIEW DYNAMIC FIXED INCOME ETF | 94 883 | −9,45 | 1 036 | −11,68 | ||||
| 2025-08-11 | 13F | Traub Capital Management LLC | 3 100 | 34 | ||||||
| 2025-08-14 | 13F | Westchester Capital Management, LLC | 0 | −100,00 | 0 | |||||
| 2025-07-25 | NP | PMSAX - Global Multi-Strategy Fund Class A | 29 283 | 0,00 | 318 | −6,19 | ||||
| 2025-08-14 | 13F | Summit Trail Advisors, Llc | 11 779 | 129 | ||||||
| 2025-08-13 | 13F | Lido Advisors, LLC | 215 661 | −1,08 | 2 371 | −3,54 | ||||
| 2025-07-16 | 13F | ORG Wealth Partners, LLC | 1 515 | 0,00 | 17 | −5,88 | ||||
| 2025-08-11 | 13F | Cornerstone Planning Group LLC | 3 729 | 0,00 | 41 | 2,56 | ||||
| 2025-07-17 | 13F | Clean Yield Group | 10 971 | 0,00 | 120 | −2,46 | ||||
| 2025-08-12 | 13F | LPL Financial LLC | 927 680 | −8,78 | 10 130 | −11,06 | ||||
| 2025-08-14 | 13F | Coastal Bridge Advisors, LLC | 32 689 | −19,54 | 357 | −21,76 | ||||
| 2025-08-12 | 13F | Kohmann Bosshard Financial Services, LLC | 0 | −100,00 | 0 | |||||
| 2025-08-06 | 13F | Smh Capital Advisors Inc | 12 201 | 2,37 | 133 | 0,00 | ||||
| 2025-08-05 | 13F | Bank Of Montreal /can/ | 33 834 | 2,67 | 369 | 0,00 | ||||
| 2025-08-14 | 13F | Snowden Capital Advisors LLC | 12 038 | 0,00 | 132 | −2,22 | ||||
| 2025-08-28 | NP | RiverNorth Flexible Municipal Income Fund II, Inc. | 818 388 | −21,23 | 8 937 | −23,20 | ||||
| 2025-07-21 | 13F | Hudson Valley Investment Advisors Inc /adv | 23 870 | 0,00 | 261 | −2,62 | ||||
| 2025-07-14 | 13F | Gridiron Partners, LLC | 169 878 | 0,00 | 1 855 | −2,47 | ||||
| 2025-08-01 | 13F | Ferguson Shapiro LLC | 17 544 | 2,01 | 192 | −0,52 | ||||
| 2025-08-12 | 13F | Park Square Financial Group, LLC | 3 628 | 0,00 | 40 | −2,50 | ||||
| 2025-08-05 | 13F | Sigma Planning Corp | 18 794 | 0,80 | 205 | −1,44 | ||||
| 2025-07-21 | 13F | Future Financial Wealth Managment LLC | 10 000 | 0,00 | 109 | −2,68 | ||||
| 2025-08-28 | NP | Cohen & Steers Closed-end Opportunity Fund, Inc. | 261 711 | −6,77 | 2 858 | −9,10 | ||||
| 2025-08-14 | 13F | EP Wealth Advisors, Inc. | 10 102 | −3,14 | 110 | −5,17 | ||||
| 2025-08-07 | 13F | Kestra Private Wealth Services, Llc | 14 073 | 11,02 | 154 | 8,51 | ||||
| 2025-08-12 | 13F | Retirement Planning Co of New England, Inc. | 0 | −100,00 | 0 | −100,00 | ||||
| 2025-08-11 | 13F | NewEdge Wealth, LLC | 93 300 | −39,87 | 1 024 | −41,11 | ||||
| 2025-07-14 | 13F | Seed Wealth Management, Inc. | 0 | −100,00 | 0 | |||||
| 2025-07-14 | 13F | U.S. Capital Wealth Advisors, LLC | 147 369 | 7,28 | 1 609 | 4,62 | ||||
| 2025-08-14 | 13F | Benjamin Edwards Inc | 41 425 | 0,00 | 452 | −2,38 | ||||
| 2025-04-08 | 13F | First Community Trust Na | 0 | −100,00 | 0 | |||||
| 2025-05-15 | 13F | PenderFund Capital Management Ltd. | 0 | −100,00 | 0 | |||||
| 2025-05-15 | 13F | Buckingham Strategic Partners | 0 | −100,00 | 0 | |||||
| 2025-07-21 | 13F | Ameritas Advisory Services, LLC | 6 630 | 72 | ||||||
| 2025-05-14 | 13F | Apexium Financial, Lp | 0 | −100,00 | 0 | |||||
| 2025-08-14 | 13F | Capital & Planning, Llc | 125 210 | 4,05 | 1 367 | 1,48 | ||||
| 2025-08-13 | 13F | Jones Financial Companies Lllp | 8 194 | −3,75 | 89 | −6,32 | ||||
| 2025-04-30 | 13F | Paul Damon & Associates, Inc. | 0 | −100,00 | 0 | |||||
| 2025-07-18 | 13F | Founders Capital Management | 5 500 | 0,00 | 60 | −1,64 | ||||
| 2025-07-16 | 13F | Moisand Fitzgerald Tamayo, LLC | 583 | 0,00 | 6 | 0,00 | ||||
| 2025-05-15 | 13F | IHT Wealth Management, LLC | 0 | −100,00 | 0 | |||||
| 2025-04-17 | 13F | Bayshore Asset Management, Llc | 0 | −100,00 | 0 | |||||
| 2025-08-08 | 13F | Kingsview Wealth Management, LLC | 63 403 | 96,68 | 692 | 91,69 | ||||
| 2025-07-24 | 13F | Mackay Shields Llc | 4 002 639 | 0,00 | 43 709 | −2,50 | ||||
| 2025-07-30 | 13F | D.a. Davidson & Co. | 10 926 | −9,93 | 119 | −11,85 | ||||
| 2025-07-28 | 13F | Harbour Investments, Inc. | 43 657 | 38,30 | 477 | 34,84 | ||||
| 2025-07-10 | 13F | Tompkins Financial Corp | 0 | −100,00 | 0 | |||||
| 2025-07-22 | 13F | Fortitude Advisory Group L.L.C. | 25 716 | 14,73 | 281 | 17,15 | ||||
| 2025-07-31 | 13F | Oppenheimer & Co Inc | 58 262 | 2,22 | 636 | −0,31 | ||||
| 2025-08-12 | 13F | Virtu Financial LLC | 0 | −100,00 | 0 | |||||
| 2025-08-08 | 13F | Larson Financial Group LLC | 1 966 | 278,81 | 21 | 320,00 | ||||
| 2025-08-13 | 13F | bLong Financial, LLC | 0 | −100,00 | 0 | |||||
| 2025-07-25 | 13F | Allspring Global Investments Holdings, LLC | 392 638 | −59,22 | 4 288 | −60,24 | ||||
| 2025-08-28 | NP | RiverNorth Opportunistic Municipal Income Fund, Inc. | 212 228 | −3,50 | 2 318 | −5,93 | ||||
| 2025-08-13 | 13F | Baird Financial Group, Inc. | 209 829 | 27,05 | 2 291 | 23,90 | ||||
| 2025-08-11 | 13F | Dorsey & Whitney Trust CO LLC | 10 000 | 0,00 | 109 | −2,68 | ||||
| 2025-05-30 | NP | RNDLX - RiverNorth/DoubleLine Strategic Income Fund Class R | 900 000 | −42,86 | 10 080 | −43,26 | ||||
| 2025-07-25 | 13F | Atria Wealth Solutions, Inc. | 0 | −100,00 | 0 | |||||
| 2025-07-28 | 13F | IFC Advisors LLC | 140 389 | 1 533 | ||||||
| 2025-08-14 | 13F | Glen Eagle Advisors, LLC | 33 349 | 0,15 | 364 | −2,15 | ||||
| 2025-07-23 | 13F | Tyche Wealth Partners LLC | 159 016 | −3,56 | 1 736 | −5,96 | ||||
| 2025-07-17 | 13F | LifeGoal Wealth Advisors | 0 | −100,00 | 0 | |||||
| 2025-08-14 | 13F | Icon Wealth Advisors, LLC | 9 215 | 0,71 | 101 | −1,96 | ||||
| 2025-08-14 | 13F | Cura Wealth Advisors, Llc | 308 000 | 0,33 | 3 363 | −2,18 | ||||
| 2025-07-25 | 13F | Cwm, Llc | 3 503 | −16,62 | 0 | |||||
| 2025-08-05 | 13F | Seelaus Asset Management LLC | 18 800 | 23,28 | 205 | 20,59 | ||||
| 2025-05-14 | 13F | Landscape Capital Management, L.l.c. | 0 | −100,00 | 0 | |||||
| 2025-08-12 | 13F | CIBC Private Wealth Group, LLC | 13 885 | −6,81 | 152 | −1,31 | ||||
| 2025-07-14 | 13F | Gries Financial Llc | 24 852 | 0,00 | 271 | −2,52 | ||||
| 2025-08-14 | 13F | Karpus Management, Inc. | 500 732 | −91,83 | 5 468 | −92,04 | ||||
| 2025-08-14 | 13F | Comerica Bank | 36 309 | 2,67 | 396 | 0,00 | ||||
| 2025-08-05 | 13F | Huntington National Bank | 0 | |||||||
| 2025-07-23 | 13F | Element Wealth, LLC | 25 369 | 0,00 | 277 | −2,46 | ||||
| 2025-08-14 | 13F | CoreCap Advisors, LLC | 63 537 | 51,99 | 694 | 48,08 | ||||
| 2025-07-29 | 13F | Stratos Wealth Partners, LTD. | 89 701 | −1,93 | 980 | −4,39 | ||||
| 2025-07-10 | 13F | Uptown Financial Advisors LLC | 11 499 | 0,00 | 126 | −2,34 | ||||
| 2025-08-07 | 13F | PFG Advisors | 19 650 | 13,58 | 215 | 10,88 | ||||
| 2025-08-12 | 13F | MAI Capital Management | 4 703 | 0,88 | 51 | −1,92 | ||||
| 2025-08-14 | 13F | Citadel Advisors Llc | 0 | −100,00 | 0 | |||||
| 2025-08-08 | 13F | City Of London Investment Management Co Ltd | 0 | −100,00 | 0 | |||||
| 2025-08-06 | 13F | Atlantic Union Bankshares Corp | 1 550 | 17 | ||||||
| 2025-07-14 | 13F | Toth Financial Advisory Corp | 19 852 | 0,56 | 217 | −2,26 | ||||
| 2025-07-18 | 13F | Truist Financial Corp | 276 650 | 36,24 | 3 021 | 32,85 | ||||
| 2025-07-28 | 13F | Duncker Streett & Co Inc | 24 000 | 262 | ||||||
| 2025-07-14 | 13F | AdvisorNet Financial, Inc | 3 189 | 0,00 | 35 | −2,86 | ||||
| 2025-07-15 | 13F | Financial Management Professionals, Inc. | 2 202 | 1,99 | 24 | 0,00 | ||||
| 2025-08-08 | 13F | Altfest L J & Co Inc | 17 287 | 3,22 | 189 | 0,53 | ||||
| 2025-08-15 | 13F | Morgan Stanley | 9 471 741 | −6,21 | 103 431 | −8,56 | ||||
| 2025-07-24 | 13F | Us Bancorp \de\ | 28 940 | 0,00 | 316 | −2,47 | ||||
| 2025-08-13 | 13F | Plan Group Financial, LLC | 12 281 | 134 | ||||||
| 2025-04-18 | 13F | CENTRAL TRUST Co | 0 | −100,00 | 0 | |||||
| 2025-08-14 | 13F | Colony Group, LLC | 0 | −100,00 | 0 | |||||
| 2025-05-15 | 13F | Concorde Asset Management, LLC | 47 376 | 69,77 | 518 | 64,97 | ||||
| 2025-08-06 | 13F | Adviser Investments LLC | 0 | −100,00 | 0 | |||||
| 2025-08-14 | 13F | Harwood Advisory Group, LLC | 0 | −100,00 | 0 | |||||
| 2025-08-04 | 13F | Keybank National Association/oh | 18 763 | 0,00 | 205 | −2,86 | ||||
| 2025-04-23 | 13F | GHP Investment Advisors, Inc. | 0 | −100,00 | 0 | |||||
| 2025-08-11 | 13F | WPG Advisers, LLC | 1 484 | −57,54 | 16 | −58,97 | ||||
| 2025-08-06 | 13F | Moors & Cabot, Inc. | 18 229 | 0,00 | 199 | −2,45 | ||||
| 2025-07-31 | 13F | Briaud Financial Planning, Inc | 8 073 | 0,00 | 0 | |||||
| 2025-08-14 | 13F | Ameriprise Financial Inc | 433 093 | 6,65 | 4 729 | 3,98 | ||||
| 2025-08-07 | 13F | King Luther Capital Management Corp | 258 | −2,65 | ||||||
| 2025-08-11 | 13F | FSA Wealth Management LLC | 3 000 | 0,00 | 33 | −3,03 | ||||
| 2025-08-12 | 13F | Advisors Asset Management, Inc. | 468 342 | −17,89 | 5 114 | −19,94 | ||||
| 2025-07-10 | 13F | Wealth Enhancement Advisory Services, Llc | 132 672 | 43,03 | 1 461 | 40,66 | ||||
| 2025-08-06 | 13F | Prospera Financial Services Inc | 92 592 | 1,42 | 1 011 | −1,08 | ||||
| 2025-08-14 | 13F | Raymond James Financial Inc | 1 985 968 | −1,56 | 21 687 | −4,02 | ||||
| 2025-08-04 | 13F | Bay Colony Advisory Group, Inc d/b/a Bay Colony Advisors | 21 670 | 9,43 | 237 | 7,27 | ||||
| 2025-07-28 | 13F | Wealthspan Partners, Llc | 13 482 | 0,00 | 147 | −2,00 | ||||
| 2025-08-14 | 13F | Vivaldi Capital Management, LLC | 12 997 | −11,57 | 142 | −14,02 | ||||
| 2025-08-14 | 13F | Susquehanna International Group, Llp | 18 090 | −65,65 | 198 | −66,55 | ||||
| 2025-08-04 | 13F | L.m. Kohn & Company | 13 170 | 0,00 | 144 | −2,72 | ||||
| 2025-08-14 | 13F | Sit Investment Associates Inc | 868 916 | −51,36 | 9 | −55,00 | ||||
| 2025-08-07 | 13F | Evoke Wealth, Llc | 255 089 | 3,24 | 2 804 | 0,68 | ||||
| 2025-08-29 | 13F | Centaurus Financial, Inc. | 10 981 | 0,00 | 0 | |||||
| 2025-05-13 | 13F | Compass Financial Group, INC/SD | 0 | −100,00 | 0 | |||||
| 2025-07-07 | 13F | Insight Wealth Strategies, LLC | 13 286 | 2,70 | 146 | 1,39 | ||||
| 2025-07-16 | 13F | American National Bank | 0 | −100,00 | 0 | |||||
| 2025-07-11 | 13F | Congress Park Capital LLC | 1 302 500 | 12,28 | 14 223 | 9,48 | ||||
| 2025-08-06 | 13F | Wedbush Securities Inc | 11 840 | 1,03 | 0 | |||||
| 2025-07-17 | 13F | MBA Advisors LLC | 20 000 | 0,00 | 218 | −2,68 | ||||
| 2025-08-14 | 13F | Warren Averett Asset Management, LLC | 187 608 | −4,52 | 2 049 | −6,91 | ||||
| 2025-08-14 | 13F | Financial Engines Advisors L.L.C. | 32 278 | 11,95 | 352 | 8,98 | ||||
| 2025-07-24 | 13F | Eastern Bank | 481 | −83,18 | 5 | −84,37 | ||||
| 2025-08-13 | 13F | Kuhn & Co Investment Counsel | 16 882 | 0,00 | 184 | −2,65 | ||||
| 2025-09-04 | 13F/A | Advisor Group Holdings, Inc. | 292 991 | −12,16 | 3 200 | −14,37 | ||||
| 2025-08-14 | 13F | RMB Capital Management, LLC | 14 062 | 0,00 | 155 | −2,53 | ||||
| 2025-07-22 | 13F | Coastal Investment Advisors, Inc. | 46 752 | 38,41 | 511 | 34,92 | ||||
| 2025-08-12 | 13F | Coldstream Capital Management Inc | 0 | −100,00 | 0 | |||||
| 2025-07-14 | 13F | Park Avenue Securities Llc | 21 322 | 0 | ||||||
| 2025-07-23 | 13F | Capital Management Associates, Inc | 0 | −100,00 | 0 | |||||
| 2025-08-04 | 13F | Creekmur Asset Management LLC | 1 | 0,00 | 0 | |||||
| 2025-08-14 | 13F | Mml Investors Services, Llc | 25 003 | 8,03 | 0 | |||||
| 2025-07-17 | 13F | Catalytic Wealth RIA, LLC | 51 498 | −15,28 | 562 | −17,35 | ||||
| 2025-08-19 | 13F | Advisory Services Network, LLC | 20 802 | 8,89 | 223 | 4,69 | ||||
| 2025-08-01 | 13F | Petra Financial Advisors Inc | 130 344 | 0,02 | 1 423 | −2,47 | ||||
| 2025-07-22 | 13F | Merit Financial Group, LLC | 427 255 | 7,34 | 4 666 | 4,67 | ||||
| 2025-08-05 | 13F | Intellectus Partners, LLC | 152 180 | 1 673 | ||||||
| 2025-08-14 | 13F | Harmony Asset Management Llc | 34 067 | −4,61 | 372 | −6,77 | ||||
| 2025-07-23 | 13F | Charter Trust Co | 17 711 | 0,00 | 193 | −2,53 | ||||
| 2025-07-18 | 13F | Naples Global Advisors, Llc | 68 306 | −3,65 | 751 | −6,13 | ||||
| 2025-07-11 | 13F | Farther Finance Advisors, LLC | 22 457 | 814,00 | 245 | 807,41 | ||||
| 2025-07-25 | 13F | Concurrent Investment Advisors, LLC | 29 552 | 21,37 | 323 | 18,38 | ||||
| 2025-06-24 | NP | MainStay MacKay Municipal Income Opportunities Fund | 75 000 | 0,00 | 816 | −4,67 | ||||
| 2025-08-12 | 13F | Bokf, Na | 0 | −100,00 | 0 | |||||
| 2025-08-14 | 13F | Byrne Financial Freedom, Llc | 684 766 | −0,19 | 7 478 | −2,69 | ||||
| 2025-04-21 | 13F | Riverbridge Partners Llc | 0 | −100,00 | 0 | |||||
| 2025-08-12 | 13F | Riverstone Advisors, LLC | 10 088 | 110 | ||||||
| 2025-08-13 | 13F | Summit Financial, LLC | 11 839 | 130 | ||||||
| 2025-07-23 | 13F | Citizens National Bank Trust Department | 9 200 | 5,75 | 100 | 3,09 | ||||
| 2025-07-30 | 13F | FNY Investment Advisers, LLC | 4 400 | 0,00 | 0 | |||||
| 2025-05-29 | NP | HCIMX - The Intermediate Term Municipal Bond Portfolio HC Strategic Shares | 64 854 | −62,83 | 726 | −63,11 | ||||
| 2025-08-12 | 13F | PKS Advisory Services, LLC | 12 012 | −7,76 | 131 | −9,66 | ||||
| 2025-08-12 | 13F | NWF Advisory Services Inc. | 0 | −100,00 | 0 | |||||
| 2025-08-14 | 13F | Rivernorth Capital Management, Llc | 2 529 443 | −35,29 | 27 622 | −36,91 | ||||
| 2025-08-12 | 13F | Horizon Kinetics Asset Management Llc | 339 465 | −1,21 | 3 707 | −3,69 | ||||
| 2025-05-02 | 13F | Cullen/frost Bankers, Inc. | 0 | −100,00 | 0 | |||||
| 2025-08-05 | 13F | Rareview Capital LLC | 210 016 | −7,15 | 2 293 | −9,47 | ||||
| 2025-04-11 | 13F | Permanent Capital Management, LP | 12 409 | −8,70 | 140 | −9,15 | ||||
| 2025-08-08 | 13F | Capital Investment Advisory Services, LLC | 24 195 | 106,37 | 264 | 101,53 | ||||
| 2025-07-14 | 13F | Sowell Financial Services LLC | 39 726 | −11,97 | 434 | −14,26 | ||||
| 2025-08-14 | 13F | Mercer Global Advisors Inc /adv | 76 086 | 5,68 | 831 | 2,98 | ||||
| 2025-08-14 | 13F | GWM Advisors LLC | 209 722 | 23,89 | 2 290 | 20,84 | ||||
| 2025-07-17 | 13F | Hanson & Doremus Investment Management | 500 | 0,00 | 0 | |||||
| 2025-08-14 | 13F | Bramshill Investments, LLC | 3 301 660 | −19,93 | 36 054 | −21,93 | ||||
| 2025-08-11 | 13F | Kim, Llc | 243 700 | 0,00 | 2 661 | −2,49 | ||||
| 2025-07-24 | 13F | IFP Advisors, Inc | 756 | 0,00 | 8 | 0,00 | ||||
| 2025-07-25 | 13F | Sovereign Financial Group, Inc. | 15 981 | 1,68 | 175 | −1,14 | ||||
| 2025-07-17 | 13F | Janney Montgomery Scott LLC | 266 537 | 20,47 | 3 | 0,00 | ||||
| 2025-07-25 | 13F | Stephens Consulting, LLC | 0 | −100,00 | 0 | |||||
| 2025-07-07 | 13F | Wesbanco Bank Inc | 112 518 | 0,48 | 1 229 | −2,07 | ||||
| 2025-08-28 | NP | RTAI - RAREVIEW TAX ADVANTAGED INCOME ETF | 109 003 | −5,59 | 1 190 | −7,97 | ||||
| 2025-07-24 | 13F | Accredited Investor Services, Llc | 95 890 | −4,22 | 1 047 | −6,60 | ||||
| 2025-07-22 | 13F | Mascoma Wealth Management LLC | 1 630 | 0,00 | 18 | −5,56 | ||||
| 2025-08-13 | 13F | Cary Street Partners Financial Llc | 37 454 | 409 | ||||||
| 2025-07-31 | 13F | Whipplewood Advisors, LLC | 71 645 | 68,97 | 782 | 0,77 | ||||
| 2025-08-05 | 13F | Carolinas Wealth Consulting Llc | 0 | −100,00 | 0 | −100,00 | ||||
| 2025-08-14 | 13F | Rock Point Advisors, LLC | 39 930 | 0,00 | 436 | −2,46 | ||||
| 2025-08-14 | 13F | CF Capital LLC | 41 296 | −10,00 | 451 | −9,27 | ||||
| 2025-08-28 | NP | RiverNorth Managed Duration Municipal Income Fund II, Inc. | 268 619 | −22,32 | 2 933 | −24,27 | ||||
| 2025-08-07 | 13F | Hennion & Walsh Asset Management, Inc. | 1 204 426 | −2,70 | 13 152 | −5,13 | ||||
| 2025-08-07 | 13F | Apeiron RIA LLC | 14 808 | 0,00 | 162 | −2,42 | ||||
| 2025-08-14 | 13F | Bank Of America Corp /de/ | 1 593 672 | −11,58 | 17 403 | −13,79 | ||||
| 2025-07-30 | 13F | Brookstone Capital Management | 10 860 | 0,23 | 119 | −2,48 | ||||
| 2025-07-09 | 13F | Breakwater Capital Group | 142 101 | 6,48 | 1 552 | 3,82 | ||||
| 2025-08-13 | 13F | Cresset Asset Management, LLC | 0 | −100,00 | 0 | |||||
| 2025-07-08 | 13F | Nbc Securities, Inc. | 1 237 | 0,00 | 0 | |||||
| 2025-07-21 | 13F | Successful Portfolios LLC | 29 059 | 0,00 | 317 | −2,46 | ||||
| 2025-04-15 | 13F | Noble Wealth Management PBC | 27 600 | −20,23 | 309 | −20,77 | ||||
| 2025-07-30 | 13F | Bogart Wealth, LLC | 240 | 0,00 | 3 | 0,00 | ||||
| 2025-08-04 | 13F | Wealth Management Associates, Inc. | 12 416 | −8,54 | 136 | −11,18 | ||||
| 2025-08-06 | 13F | AE Wealth Management LLC | 17 304 | 0,00 | 189 | −2,59 | ||||
| 2025-08-12 | 13F | Proequities, Inc. | 0 | 0 | ||||||
| 2025-08-15 | 13F | Kestra Advisory Services, LLC | 208 557 | 20,38 | 2 277 | 17,37 | ||||
| 2025-08-12 | 13F | Steward Partners Investment Advisory, Llc | 123 554 | 18,55 | 1 349 | 15,60 | ||||
| 2025-08-01 | 13F | Envestnet Asset Management Inc | 132 458 | 2,12 | 1 446 | −0,41 | ||||
| 2025-08-14 | 13F | Jane Street Group, Llc | 67 605 | 203,49 | 738 | 196,39 | ||||
| 2025-08-14 | 13F | Integrated Wealth Concepts LLC | 14 755 | −0,88 | 161 | −3,01 | ||||
| 2025-08-13 | 13F | Invesco Ltd. | 201 115 | 6,87 | 2 196 | 4,22 | ||||
| 2025-07-22 | 13F | Chung Wu Investment Group, LLC | 6 000 | 66 | ||||||
| 2025-07-31 | 13F | Gill Capital Partners, Llc | 651 049 | 5,59 | 7 109 | 2,95 | ||||
| 2025-07-14 | 13F | Occidental Asset Management, LLC | 0 | −100,00 | 0 | |||||
| 2025-07-22 | 13F | Kercheville Advisors, LLC | 133 186 | 1,59 | 1 454 | −0,95 | ||||
| 2025-08-14 | 13F | Wealth Advisors of Tampa Bay, LLC | 0 | −100,00 | 0 | |||||
| 2025-08-07 | 13F | Montag A & Associates Inc | 2 120 | 0,00 | 23 | 0,00 | ||||
| 2025-07-14 | 13F | UMA Financial Services, Inc. | 108 | 0,00 | 1 | 0,00 | ||||
| 2025-08-12 | 13F | Main Management LLC | 1 541 | 0,00 | 0 | |||||
| 2025-07-17 | 13F | Melfa Wealth Management, Llc | 18 982 | 0,00 | 207 | −2,36 | ||||
| 2025-08-15 | 13F | Tower Research Capital LLC (TRC) | 0 | −100,00 | 0 | |||||
| 2025-08-14 | 13F | Robinson Capital Management, Llc | 235 327 | −19,95 | 2 570 | −21,96 | ||||
| 2025-08-12 | 13F | XTX Topco Ltd | 16 239 | 177 | ||||||
| 2025-08-14 | 13F | Modern Wealth Management, LLC | 125 166 | −5,30 | 1 367 | −7,70 | ||||
| 2025-04-15 | 13F | Fifth Third Bancorp | 0 | −100,00 | 0 | |||||
| 2025-07-25 | 13F | Total Clarity Wealth Management, Inc. | 11 318 | 0,00 | 124 | −3,15 | ||||
| 2025-07-17 | 13F/A | Capital Investment Advisors, LLC | 381 790 | −2,83 | 4 169 | −5,25 | ||||
| 2025-08-04 | 13F | Mayflower Financial Advisors, LLC | 32 689 | 0,00 | 357 | −2,73 | ||||
| 2025-08-13 | 13F | First Trust Advisors Lp | 26 009 | −0,79 | 284 | −3,07 | ||||
| 2025-07-30 | 13F | Whittier Trust Co Of Nevada Inc | 50 | 0,00 | 1 | |||||
| 2025-08-13 | 13F | Townsquare Capital Llc | 0 | −100,00 | 0 | |||||
| 2025-07-14 | 13F | Caitlin John, LLC | 13 450 | 147 | ||||||
| 2025-05-12 | 13F | Independent Advisor Alliance | 0 | −100,00 | 0 | |||||
| 2025-07-25 | 13F | Apollon Wealth Management, LLC | 15 804 | 0,00 | 173 | −2,82 | ||||
| 2025-08-14 | 13F | Ancora Advisors, LLC | 14 465 | −3,31 | 158 | −5,99 | ||||
| 2025-08-28 | NP | RiverNorth Flexible Municipal Income Fund, Inc. | 240 091 | −9,64 | 2 622 | −11,90 | ||||
| 2025-08-14 | 13F | Aberdeen Wealth Management LLC | 23 554 | 0,00 | 257 | −2,28 | ||||
| 2025-07-18 | 13F | Childress Capital Advisors, Llc | 108 500 | 0,00 | 1 185 | −2,55 | ||||
| 2025-08-04 | 13F | Kovack Advisors, Inc. | 0 | −100,00 | 0 | |||||
| 2025-07-10 | 13F | Redhawk Wealth Advisors, Inc. | 54 655 | −2,92 | 597 | −5,40 | ||||
| 2025-08-07 | 13F | Verus Capital Partners, Llc | 30 000 | −37,50 | 328 | −39,11 | ||||
| 2025-08-27 | NP | ROBAX - Robinson Tax Advantaged Income Fund Class A Shares | 235 327 | −19,95 | 2 570 | −21,96 | ||||
| 2025-04-25 | 13F | WASHINGTON TRUST Co | 0 | −100,00 | 0 | |||||
| 2025-05-09 | 13F | TD Waterhouse Canada Inc. | 0 | −100,00 | 0 | |||||
| 2025-07-01 | 13F | Harbor Investment Advisory, Llc | 1 500 | 0,00 | 16 | 0,00 | ||||
| 2025-08-14 | 13F | First Foundation Advisors | 0 | −100,00 | 0 | |||||
| 2025-07-29 | 13F | Mezzasalma Advisors, LLC | 19 044 | 1,84 | 208 | −0,96 | ||||
| 2025-08-06 | 13F | Commonwealth Equity Services, Llc | 781 188 | 10,20 | 9 | 14,29 | ||||
| 2025-08-05 | 13F | Bank of New York Mellon Corp | 10 878 | −18,14 | 119 | −20,27 | ||||
| 2025-08-08 | 13F | Good Life Advisors, LLC | 22 659 | 0,71 | 247 | −1,59 | ||||
| 2025-08-11 | 13F | Shufro Rose & Co Llc | 19 500 | 0,00 | 218 | 0,00 | ||||
| 2025-08-13 | 13F | Rsm Us Wealth Management Llc | 56 897 | −26,20 | 625 | −28,08 | ||||
| 2025-08-01 | 13F | Centerpoint Advisors, LLC | 0 | −100,00 | 0 | |||||
| 2025-07-16 | 13F | Maridea Wealth Management LLC | 10 508 | −1,16 | 115 | −4,20 | ||||
| 2025-08-07 | 13F | New England Private Wealth Advisors LLC | 10 000 | 0,00 | 107 | −5,36 | ||||
| 2025-07-24 | 13F | Leo Wealth, LLC | 208 401 | 32,99 | 2 276 | 29,63 | ||||
| 2025-07-15 | 13F | North Star Investment Management Corp. | 12 164 | 0,00 | 133 | −2,94 | ||||
| 2025-08-12 | 13F | Pathstone Holdings, LLC | 0 | −100,00 | 0 | |||||
| 2025-05-01 | 13F | Schechter Investment Advisors, LLC | 0 | −100,00 | 0 | |||||
| 2025-08-27 | NP | RYDEX VARIABLE TRUST - Multi-Hedge Strategies Fund Variable Annuity | 212 | −37,65 | 2 | −33,33 | ||||
| 2025-07-22 | 13F | DAVENPORT & Co LLC | 80 106 | −3,54 | 875 | −6,02 | ||||
| 2025-08-13 | 13F | GeoWealth Management, LLC | 51 498 | −15,28 | 562 | −17,35 | ||||
| 2025-08-08 | 13F | Avantax Advisory Services, Inc. | 27 965 | −3,95 | 305 | −6,44 | ||||
| 2025-08-12 | 13F | Founders Financial Alliance, LLC | 25 762 | 1,75 | 281 | −0,71 | ||||
| 2025-07-29 | 13F | FLC Capital Advisors | 70 446 | 0,00 | 769 | −2,41 | ||||
| 2025-08-14 | 13F | Wells Fargo & Company/mn | 3 351 017 | −6,97 | 36 593 | −9,30 | ||||
| 2025-07-15 | 13F | Peddock Capital Advisors, Llc | 43 634 | 0,00 | 476 | −2,46 | ||||
| 2025-08-15 | 13F | Provenance Wealth Advisors, LLC | 0 | −100,00 | 0 | −100,00 | ||||
| 2025-08-25 | NP | QWVQX - Clearwater Tax-Exempt Bond Fund | 212 362 | 0,00 | 2 319 | −2,52 | ||||
| 2025-08-05 | 13F | Uniting Wealth Partners, LLC | 70 828 | 0,90 | 773 | −1,65 | ||||
| 2025-08-14 | 13F | Sunbelt Securities, Inc. | 13 417 | −1,08 | 151 | 0,00 | ||||
| 2025-07-08 | 13F | Webster Bank, N. A. | 6 893 | 0,00 | 75 | −2,60 | ||||
| 2025-07-29 | 13F | Private Trust Co Na | 2 238 | −90,20 | 24 | −90,59 | ||||
| 2025-07-10 | 13F | Farmers & Merchants Trust Co of Chambersburg PA | 0 | −100,00 | 0 | |||||
| 2025-07-16 | 13F/A | CX Institutional | 6 765 | 0,00 | 0 | |||||
| 2025-04-09 | 13F | Milestone Asset Management, Llc | 0 | −100,00 | 0 | |||||
| 2025-07-08 | 13F/A | Salem Investment Counselors Inc | 21 088 | 232 | ||||||
| 2025-07-17 | 13F | Nelson, Van Denburg & Campbell Wealth Management Group, LLC | 105 332 | 17,33 | 1 150 | 14,43 | ||||
| 2025-07-23 | 13F | Kingswood Wealth Advisors, Llc | 10 655 | 0,00 | 116 | −2,52 | ||||
| 2025-08-11 | 13F | Annis Gardner Whiting Capital Advisors, LLC | 1 131 | 0,00 | 12 | 0,00 | ||||
| 2025-08-11 | 13F | HighTower Advisors, LLC | 1 463 113 | 1,97 | 15 977 | −0,58 | ||||
| 2025-08-13 | 13F | Northern Trust Corp | 37 785 | 2,89 | 413 | 0,24 | ||||
| 2025-07-23 | 13F | Tectonic Advisors Llc | 79 453 | −15,45 | 868 | −17,59 | ||||
| 2025-08-07 | 13F | Allworth Financial LP | 24 363 | 244,01 | 266 | 250,00 | ||||
| 2025-05-12 | 13F | Richard W. Paul & Associates, LLC | 0 | −100,00 | 0 | |||||
| 2025-07-21 | 13F | Barrett & Company, Inc. | 0 | −100,00 | 0 | |||||
| 2025-08-11 | 13F | Rothschild Investment Llc | 14 469 | −90,44 | 158 | −90,67 | ||||
| 2025-08-08 | 13F | Creative Planning | 85 632 | −9,61 | 935 | −11,88 | ||||
| 2025-05-14 | 13F | Summit Financial Wealth Advisors, LLC | 20 400 | −4,67 | 228 | −6,56 | ||||
| 2025-07-23 | 13F | Abel Hall, LLC | 50 000 | 546 | ||||||
| 2025-07-29 | 13F | Salomon & Ludwin, LLC | 1 910 | 0,00 | 21 | 0,00 | ||||
| 2025-08-11 | 13F | Nations Financial Group Inc, /ia/ /adv | 13 286 | 1,07 | 145 | −1,36 | ||||
| 2025-08-27 | NP | RYMSX - Guggenheim Multi-Hedge Strategies Fund Class P | 126 | −51,72 | 1 | −50,00 | ||||
| 2025-05-08 | 13F | Mesirow Financial Investment Management, Inc. | 0 | −100,00 | 0 | |||||
| 2025-08-14 | 13F | Acorn Wealth Advisors, LLC | 10 040 | 0,00 | 110 | −2,68 | ||||
| 2025-08-25 | NP | SNTIX - Sit Tax-Free Income Fund | 75 639 | 0,00 | 826 | −2,60 | ||||
| 2025-07-16 | 13F | Dakota Wealth Management | 76 313 | −62,93 | 834 | −63,86 | ||||
| 2025-08-14 | 13F | Broyhill Asset Management | 99 285 | −57,58 | 1 084 | −58,64 | ||||
| 2025-08-25 | 13F | Silverlake Wealth Management Llc | 69 904 | 7,88 | 763 | 5,24 | ||||
| 2025-08-14 | 13F/A | Rockefeller Capital Management L.P. | 1 045 392 | 145,72 | 11 416 | 139,61 | ||||
| 2025-07-17 | 13F | Barry Investment Advisors, LLC | 27 218 | −93,89 | 323 | −93,59 | ||||
| 2025-08-14 | 13F | Arete Wealth Advisors, LLC | 23 589 | 0,02 | 0 | |||||
| 2025-05-29 | NP | MCTOX - Modern Capital Tactical Opportunities Fund Class A Shares | 124 000 | 520,00 | 1 389 | 516,89 | ||||
| 2025-08-06 | 13F | First Horizon Advisors, Inc. | 500 | 0,00 | 5 | 0,00 | ||||
| 2025-08-13 | 13F | WCG Wealth Advisors LLC | 37 543 | 84,22 | 410 | 79,39 | ||||
| 2025-08-14 | 13F | Cohen & Steers, Inc. | 402 711 | −4,51 | 4 | 0,00 | ||||
| 2025-08-08 | 13F | Tortoise Investment Management, LLC | 0 | −100,00 | 0 | |||||
| 2025-07-22 | 13F | Investors Asset Management Of Georgia Inc /ga/ /adv | 19 142 | 0,07 | 209 | −2,34 | ||||
| 2025-08-14 | 13F | Sentinus, LLC | 52 096 | 0,00 | 569 | −2,57 | ||||
| 2025-08-13 | 13F | Northwestern Mutual Wealth Management Co | 267 635 | 1,26 | 2 923 | −1,28 | ||||
| 2025-08-07 | 13F | Legacy Advisors, LLC | 0 | −100,00 | 0 | |||||
| 2025-06-26 | NP | Blackrock Muni Intermediate Duration Fund, Inc. This fund is a listed as child fund of BlackRock, Inc. and if that institution has disclosed ownership in this security, then these positions will not be double counted when calculating total shares and total value | 200 000 | 0,00 | 2 176 | −4,73 | ||||
| 2025-08-11 | 13F | Blue Bell Private Wealth Management, Llc | 0 | −100,00 | 0 | |||||
| 2025-07-16 | 13F | Cresta Advisors, Ltd. | 256 647 | 0,00 | 2 803 | −2,51 | ||||
| 2025-08-05 | 13F | Wakefield Asset Management LLLP | 159 419 | −1,24 | 1 742 | −3,71 | ||||
| 2025-08-01 | 13F | Motco | 5 657 | 0,00 | 61 | −4,76 | ||||
| 2025-07-25 | NP | BLACKROCK MUNICIPAL SERIES TRUST - BlackRock Strategic Municipal Opportunities Fund of BlackRock Municipal Series Trust Investor A1 This fund is a listed as child fund of BlackRock, Inc. and if that institution has disclosed ownership in this security, then these positions will not be double counted when calculating total shares and total value | 1 750 000 | 0,00 | 19 005 | −6,38 | ||||
| 2025-05-08 | 13F | Tiaa Trust, National Association | 0 | −100,00 | 0 | |||||
| 2025-05-12 | 13F | Fmr Llc | 0 | −100,00 | 0 | |||||
| 2025-08-11 | 13F | Private Advisor Group, LLC | 72 852 | 51,42 | 796 | 47,77 | ||||
| 2025-08-13 | 13F | Capital Analysts, Inc. | 1 509 | 1,96 | 0 | |||||
| 2025-08-14 | 13F | Novus Advisors, Llc | 0 | −100,00 | 0 | |||||
| 2025-08-04 | 13F | Simon Quick Advisors, Llc | 17 480 | 2,40 | 191 | −0,52 | ||||
| 2025-08-11 | 13F | Wealthspire Advisors, LLC | 86 426 | −30,80 | 944 | −32,55 | ||||
| 2025-08-08 | 13F | Cetera Investment Advisers | 322 983 | 5,31 | 3 527 | 2,68 | ||||
| 2025-08-08 | 13F | Pnc Financial Services Group, Inc. | 112 350 | −42,04 | 1 227 | −43,53 | ||||
| 2025-06-24 | NP | MMHVX - MainStay MacKay High Yield Municipal Bond Fund Investor Class | 640 262 | 0,00 | 6 966 | −4,72 | ||||
| 2025-08-29 | NP | BRMSX - Bramshill Income Performance Fund Institutional Class | 725 122 | −11,23 | 7 918 | −13,46 | ||||
| 2025-08-12 | 13F | J.w. Cole Advisors, Inc. | 52 529 | 2,47 | 574 | −0,17 | ||||
| 2025-08-12 | 13F | Sfmg, Llc | 13 049 | 0,00 | 142 | −2,74 | ||||
| 2025-08-04 | 13F | Linscomb & Williams, Inc. | 127 291 | 1 390 | ||||||
| 2025-07-11 | 13F | Myecfo, Llc | 54 200 | 3,24 | 592 | 0,51 | ||||
| 2025-07-10 | 13F | Piscataqua Savings Bank | 645 | 0,00 | 7 | 0,00 | ||||
| 2025-05-08 | 13F | Menard Financial Group LLC | 0 | −100,00 | 0 | |||||
| 2025-07-17 | 13F | Eagle Bluffs Wealth Management LLC | 451 839 | 14,94 | 4 967 | 12,10 | ||||
| 2025-08-12 | 13F | Mystic Asset Management, Inc. | 31 666 | 0,00 | 346 | −2,54 | ||||
| 2025-08-14 | 13F | Kovitz Investment Group Partners, LLC | 13 753 | −93,17 | 150 | −93,35 | ||||
| 2025-07-29 | 13F | Stephens Inc /ar/ | 28 755 | 30,67 | 314 | 27,64 | ||||
| 2025-08-14 | 13F | Archetype Wealth Partners | 54 839 | −6,62 | 1 | |||||
| 2025-07-29 | 13F | Altus Wealth Group LLC | 53 685 | 0,00 | 586 | −2,50 | ||||
| 2025-07-23 | 13F | Indiana Trust & Investment Management CO | 139 000 | 0,00 | 1 518 | −2,51 | ||||
| 2025-08-15 | 13F | CI Private Wealth, LLC | 171 234 | 31,24 | 1 870 | 27,99 | ||||
| 2025-05-29 | NP | FFSAX - Touchstone Flexible Income Fund Class A | 741 | −99,93 | 8 | −99,93 | ||||
| 2025-08-12 | 13F | BlackRock, Inc. | 1 950 271 | 0,01 | 21 297 | −2,49 | ||||
| 2025-07-08 | 13F | Bard Financial Services, Inc. | 65 000 | 0,00 | 710 | −2,61 | ||||
| 2025-07-15 | 13F | Fortitude Family Office, LLC | 3 030 | 49,26 | 33 | 50,00 | ||||
| 2025-08-05 | 13F | Palogic Value Management, L.P. | 317 146 | 11,96 | 3 463 | 9,17 | ||||
| 2025-07-29 | 13F | Stratos Wealth Advisors, LLC | 462 544 | −6,37 | 5 051 | −8,71 | ||||
| 2025-08-04 | 13F | Spire Wealth Management | 120 298 | 37,63 | 1 314 | 34,25 | ||||
| 2025-07-11 | 13F | Pinnacle Bancorp, Inc. | 3 500 | 0,00 | 38 | −2,56 | ||||
| 2025-07-28 | 13F | RFG Advisory, LLC | 15 733 | 14,56 | 172 | 11,76 | ||||
| 2025-08-14 | 13F | Quantinno Capital Management LP | 10 500 | 115 | ||||||
| 2025-07-15 | 13F | SJS Investment Consulting Inc. | 4 716 | 1,99 | 52 | 0,00 | ||||
| 2025-08-13 | 13F | Guggenheim Capital Llc | 1 225 851 | 7,82 | 13 386 | 5,12 | ||||
| 2025-08-14 | 13F | Leisure Capital Management | 23 418 | 4,46 | 256 | 1,59 | ||||
| 2025-08-14 | 13F | Hrt Financial Lp | 0 | −100,00 | 0 | |||||
| 2025-08-05 | 13F | Pointe Capital Management LLC | 21 015 | 0,00 | 229 | −2,55 | ||||
| 2025-08-12 | 13F | Journey Strategic Wealth Llc | 10 937 | −16,04 | 119 | −17,93 | ||||
| 2025-08-18 | 13F | Hollencrest Capital Management | 13 135 | 0,00 | 143 | −2,72 | ||||
| 2025-08-12 | 13F | Jpmorgan Chase & Co | 1 067 | 1 381,94 | 12 | |||||
| 2025-07-24 | 13F | Jfs Wealth Advisors, Llc | 122 591 | 0,07 | 1 339 | −2,48 | ||||
| 2025-08-13 | 13F | McGowan Group Asset Management, Inc. | 1 287 198 | 10,59 | 14 056 | 7,82 | ||||
| 2025-08-14 | 13F | Stifel Financial Corp | 1 051 652 | 2,23 | 11 484 | −0,32 | ||||
| 2025-07-22 | 13F | Belpointe Asset Management LLC | 27 884 | 42,53 | 304 | 38,81 | ||||
| 2025-08-28 | NP | RiverNorth Managed Duration Municipal Income Fund, Inc. | 990 117 | −13,03 | 10 812 | −15,20 | ||||
| 2025-07-17 | 13F | Camelot Portfolios, LLC | 15 393 | 7,80 | 168 | 5,66 | ||||
| 2025-07-21 | 13F | Crews Bank & Trust | 1 015 | 0,00 | 11 | 0,00 | ||||
| 2025-07-29 | 13F | Dumont & Blake Investment Advisors Llc | 18 541 | 1,16 | 202 | −1,46 | ||||
| 2025-08-11 | 13F | Brown Brothers Harriman & Co | 49 274 | 538 | ||||||
| 2025-07-21 | 13F | Cliftonlarsonallen Wealth Advisors, Llc | 66 090 | −35,27 | 722 | −36,92 |