Grundläggande statistik
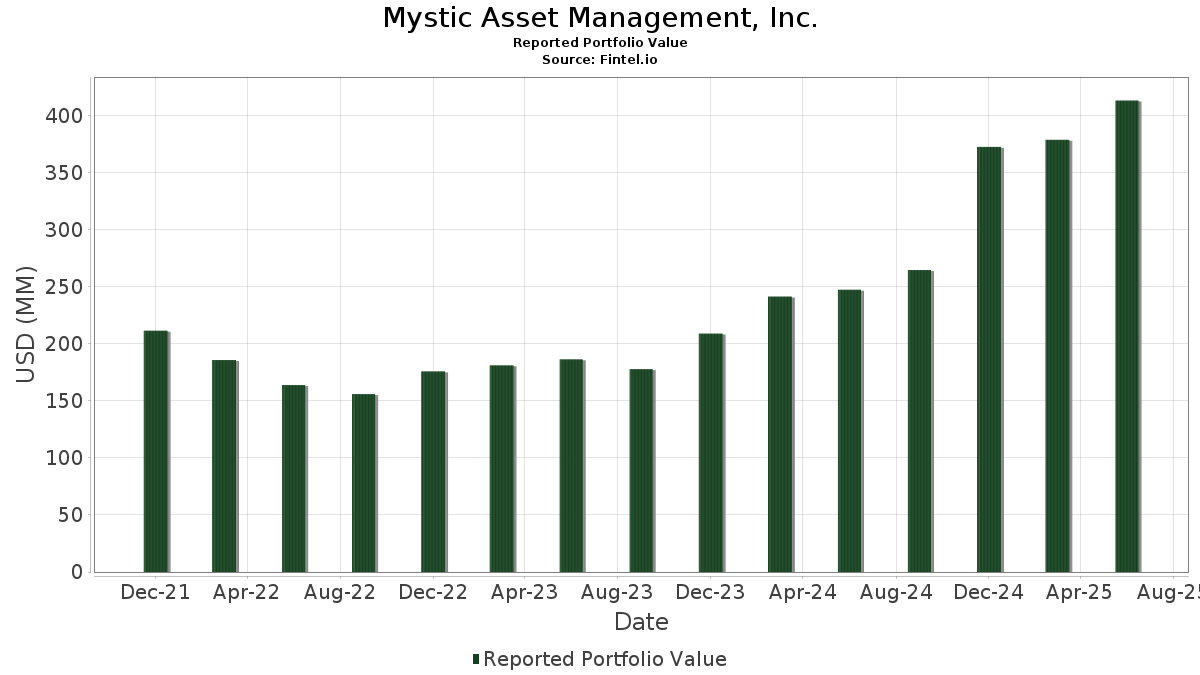
| Portföljvärde | $ 413 524 301 |
| Aktuella positioner | 222 |
Senaste innehav, resultat, förvaltat kapital (från 13F, 13D)
Mystic Asset Management, Inc. har redovisat 222 totala innehav i sina senaste SEC-arkiveringar. Det senaste portföljvärdet beräknas vara $ 413 524 301 USD. Faktiskt förvaltade tillgångar (AUM) är detta värde plus likvida medel (som inte redovisas). Mystic Asset Management, Inc.s största innehav är Microsoft Corporation (US:MSFT) , Apple Inc. (US:AAPL) , NVIDIA Corporation (US:NVDA) , JPMorgan Chase & Co. (US:JPM) , and Broadcom Inc. (US:AVGO) . Mystic Asset Management, Inc.s nya positioner inkluderar Alliant Energy Corporation (US:LNT) , Arm Holdings plc - Depositary Receipt (Common Stock) (US:ARM) , Constellation Energy Corporation (US:CEG) , .
Största ökningarna detta kvartal
Vi använder förändringen i portföljallokeringen eftersom det är det mest meningsfulla måttet. Förändringar kan bero på transaktioner eller förändringar i aktiekurser.
| Värdepapper | Aktier (MM) |
Värde (MM$) |
Portfölj % av | ΔPortfölj % av |
|---|---|---|---|---|
| 0,05 | 13,28 | 3,2114 | 1,1007 | |
| 0,05 | 25,49 | 6,1645 | 1,0797 | |
| 0,11 | 16,86 | 4,0783 | 0,8979 | |
| 0,02 | 12,04 | 2,9111 | 0,4286 | |
| 0,02 | 6,88 | 1,6628 | 0,3027 | |
| 0,05 | 13,30 | 3,2165 | 0,2430 | |
| 0,01 | 1,60 | 0,3858 | 0,1855 | |
| 0,02 | 9,57 | 2,3138 | 0,1811 | |
| 0,00 | 3,41 | 0,8246 | 0,1346 | |
| 0,01 | 3,17 | 0,7664 | 0,1190 |
Största minskningarna detta kvartal
Vi använder förändringen i portföljallokeringen eftersom det är det mest meningsfulla måttet. Förändringar kan bero på transaktioner eller förändringar i aktiepriser.
| Värdepapper | Aktier (MM) |
Värde (MM$) |
Portfölj % av | ΔPortfölj % av |
|---|---|---|---|---|
| 0,12 | 24,77 | 5,9899 | −1,3122 | |
| 0,04 | 4,64 | 1,1223 | −0,2200 | |
| 0,02 | 3,88 | 0,9372 | −0,2153 | |
| 0,03 | 4,72 | 1,1418 | −0,2127 | |
| 0,02 | 3,06 | 0,7395 | −0,2072 | |
| 0,02 | 3,30 | 0,7992 | −0,2029 | |
| 0,01 | 4,36 | 1,0535 | −0,1754 | |
| 0,02 | 1,87 | 0,4521 | −0,1477 | |
| 0,02 | 3,91 | 0,9451 | −0,1423 | |
| 0,02 | 5,89 | 1,4248 | −0,1401 |
13F- och fond arkiveringar
Denna blankett lämnades in den 2025-08-12 för rapporteringsperioden 2025-06-30. Klicka på länksymbolen för att se hela transaktionshistoriken.
Uppgradera för att låsa upp premiumdata och exportera till Excel![]() .
.
| Värdepapper | Typ | Genomsnittligt aktiepris | Aktier (MM) |
ΔAktier (%) |
ΔAktier (%) |
Värde ($MM) |
Portfölj (%) |
ΔPortfölj (%) |
|
|---|---|---|---|---|---|---|---|---|---|
| MSFT / Microsoft Corporation | 0,05 | −0,19 | 25,49 | 32,24 | 6,1645 | 1,0797 | |||
| AAPL / Apple Inc. | 0,12 | −3,12 | 24,77 | −10,52 | 5,9899 | −1,3122 | |||
| NVDA / NVIDIA Corporation | 0,11 | −4,04 | 16,86 | 39,88 | 4,0783 | 0,8979 | |||
| JPM / JPMorgan Chase & Co. | 0,05 | −0,16 | 13,30 | 18,00 | 3,2165 | 0,2430 | |||
| AVGO / Broadcom Inc. | 0,05 | 0,81 | 13,28 | 65,97 | 3,2114 | 1,1007 | |||
| META / Meta Platforms, Inc. | 0,02 | −0,12 | 12,04 | 27,91 | 2,9111 | 0,4286 | |||
| QQQ / Invesco QQQ Trust, Series 1 | 0,02 | 0,60 | 9,57 | 18,36 | 2,3138 | 0,1811 | |||
| BAC / Bank of America Corporation | 0,16 | 0,96 | 7,71 | 14,49 | 1,8651 | 0,0880 | |||
| AMZN / Amazon.com, Inc. | 0,03 | 0,37 | 7,28 | 15,73 | 1,7611 | 0,1014 | |||
| ETN / Eaton Corporation plc | 0,02 | 1,54 | 6,88 | 33,34 | 1,6628 | 0,3027 | |||
| SYK / Stryker Corporation | 0,02 | 0,00 | 6,33 | 6,28 | 1,5302 | −0,0403 | |||
| RTX / RTX Corporation | 0,04 | 0,22 | 6,28 | 10,49 | 1,5178 | 0,0193 | |||
| VO / Vanguard Index Funds - Vanguard Mid-Cap ETF | 0,02 | 0,71 | 6,04 | 8,97 | 1,4601 | −0,0015 | |||
| HD / The Home Depot, Inc. | 0,02 | −0,72 | 5,89 | −0,69 | 1,4248 | −0,1401 | |||
| IBM / International Business Machines Corporation | 0,02 | 0,28 | 5,87 | 18,89 | 1,4203 | 0,1170 | |||
| PFE / Pfizer Inc. | 0,22 | 18,35 | 5,31 | 13,22 | 1,2844 | 0,0469 | |||
| GOOGL / Alphabet Inc. | 0,03 | 0,93 | 5,06 | 15,02 | 1,2239 | 0,0632 | |||
| WM / Waste Management, Inc. | 0,02 | −0,76 | 4,79 | −1,93 | 1,1583 | −0,1298 | |||
| JNJ / Johnson & Johnson | 0,03 | −0,17 | 4,72 | −8,06 | 1,1418 | −0,2127 | |||
| XOM / Exxon Mobil Corporation | 0,04 | 0,62 | 4,64 | −8,81 | 1,1223 | −0,2200 | |||
| MCD / McDonald's Corporation | 0,01 | −0,02 | 4,36 | −6,48 | 1,0535 | −0,1754 | |||
| V / Visa Inc. | 0,01 | −0,13 | 4,12 | 1,18 | 0,9970 | −0,0779 | |||
| CAT / Caterpillar Inc. | 0,01 | 0,05 | 4,12 | 17,76 | 0,9960 | 0,0735 | |||
| VB / Vanguard Index Funds - Vanguard Small-Cap ETF | 0,02 | −0,80 | 4,04 | 6,01 | 0,9775 | −0,0283 | |||
| LOW / Lowe's Companies, Inc. | 0,02 | −0,34 | 3,91 | −5,19 | 0,9451 | −0,1423 | |||
| ABBV / AbbVie Inc. | 0,02 | 0,12 | 3,88 | −11,31 | 0,9372 | −0,2153 | |||
| SPY / SPDR S&P 500 ETF | 0,01 | −0,44 | 3,63 | 9,95 | 0,8767 | 0,0070 | |||
| GOOG / Alphabet Inc. | 0,02 | −0,92 | 3,53 | 12,50 | 0,8530 | 0,0259 | |||
| ABT / Abbott Laboratories | 0,03 | −0,56 | 3,48 | 1,97 | 0,8408 | −0,0587 | |||
| GS / The Goldman Sachs Group, Inc. | 0,00 | 0,63 | 3,41 | 30,36 | 0,8246 | 0,1346 | |||
| BA / The Boeing Company | 0,02 | 0,89 | 3,35 | 23,97 | 0,8104 | 0,0972 | |||
| CVX / Chevron Corporation | 0,02 | 1,63 | 3,30 | −13,03 | 0,7992 | −0,2029 | |||
| CI / The Cigna Group | 0,01 | 3,59 | 3,29 | 4,08 | 0,7962 | −0,0382 | |||
| GE / General Electric Company | 0,01 | 0,41 | 3,17 | 29,14 | 0,7664 | 0,1190 | |||
| PG / The Procter & Gamble Company | 0,02 | −0,34 | 3,09 | −6,85 | 0,7469 | −0,1276 | |||
| PEP / PepsiCo, Inc. | 0,02 | −3,24 | 3,06 | −14,80 | 0,7395 | −0,2072 | |||
| GD / General Dynamics Corporation | 0,01 | 0,43 | 3,05 | 7,46 | 0,7387 | −0,0112 | |||
| ZVRA / Zevra Therapeutics, Inc. | 0,35 | 2,29 | 3,05 | 20,33 | 0,7385 | 0,0690 | |||
| WMT / Walmart Inc. | 0,03 | −1,01 | 2,84 | 10,25 | 0,6870 | 0,0073 | |||
| ADP / Automatic Data Processing, Inc. | 0,01 | −0,92 | 2,84 | 0,04 | 0,6859 | −0,0622 | |||
| CSCO / Cisco Systems, Inc. | 0,04 | 0,54 | 2,81 | 13,03 | 0,6798 | 0,0238 | |||
| DRI / Darden Restaurants, Inc. | 0,01 | 0,00 | 2,79 | 4,92 | 0,6759 | −0,0268 | |||
| KMI / Kinder Morgan, Inc. | 0,09 | 0,21 | 2,75 | 3,26 | 0,6659 | −0,0375 | |||
| PM / Philip Morris International Inc. | 0,01 | 0,58 | 2,56 | 15,42 | 0,6191 | 0,0339 | |||
| C / Citigroup Inc. | 0,03 | −0,09 | 2,47 | 19,81 | 0,5985 | 0,0536 | |||
| KMB / Kimberly-Clark Corporation | 0,02 | 0,04 | 2,45 | −9,32 | 0,5934 | −0,1204 | |||
| DE / Deere & Company | 0,00 | 0,02 | 2,42 | 8,34 | 0,5842 | −0,0039 | |||
| MA / Mastercard Incorporated | 0,00 | 0,00 | 2,37 | 2,51 | 0,5724 | −0,0366 | |||
| HON / Honeywell International Inc. | 0,01 | 2,28 | 2,35 | 12,53 | 0,5690 | 0,0172 | |||
| CL / Colgate-Palmolive Company | 0,03 | −0,08 | 2,27 | −3,07 | 0,5499 | −0,0689 | |||
| WFC / Wells Fargo & Company | 0,03 | 0,77 | 2,26 | 12,48 | 0,5471 | 0,0164 | |||
| PNC / The PNC Financial Services Group, Inc. | 0,01 | −0,55 | 2,24 | 5,51 | 0,5423 | −0,0185 | |||
| LMT / Lockheed Martin Corporation | 0,00 | 0,11 | 2,20 | 3,77 | 0,5329 | −0,0272 | |||
| CVS / CVS Health Corporation | 0,03 | 1,00 | 2,17 | 2,84 | 0,5246 | −0,0319 | |||
| MS / Morgan Stanley | 0,01 | −0,16 | 2,10 | 20,54 | 0,5083 | 0,0483 | |||
| LLY / Eli Lilly and Company | 0,00 | −2,62 | 2,03 | −8,08 | 0,4898 | −0,0915 | |||
| ICE / Intercontinental Exchange, Inc. | 0,01 | −0,46 | 1,97 | 5,86 | 0,4760 | −0,0145 | |||
| EIPI / First Trust Exchange-Traded Fund VIII - FT Energy Income Partners Enhanced Income ETF | 0,10 | 0,75 | 1,91 | −2,05 | 0,4624 | −0,0527 | |||
| O / Realty Income Corporation | 0,03 | 3,32 | 1,90 | 2,59 | 0,4591 | −0,0290 | |||
| MRK / Merck & Co., Inc. | 0,02 | −6,77 | 1,87 | −17,77 | 0,4521 | −0,1477 | |||
| BABA / Alibaba Group Holding Limited - Depositary Receipt (Common Stock) | 0,02 | 0,31 | 1,86 | −13,98 | 0,4497 | −0,1205 | |||
| SO / The Southern Company | 0,02 | −0,36 | 1,85 | −0,48 | 0,4478 | −0,0431 | |||
| HIG / The Hartford Insurance Group, Inc. | 0,01 | 5,14 | 1,73 | 7,80 | 0,4178 | −0,0049 | |||
| VV / Vanguard Index Funds - Vanguard Large-Cap ETF | 0,01 | 3,11 | 1,70 | 14,46 | 0,4116 | 0,0193 | |||
| MCO / Moody's Corporation | 0,00 | 0,00 | 1,68 | 7,70 | 0,4061 | −0,0052 | |||
| SPG / Simon Property Group, Inc. | 0,01 | 1,05 | 1,62 | −2,18 | 0,3915 | −0,0451 | |||
| UNH / UnitedHealth Group Incorporated | 0,01 | 252,69 | 1,60 | 110,14 | 0,3858 | 0,1855 | |||
| NEE / NextEra Energy, Inc. | 0,02 | 0,77 | 1,59 | −1,30 | 0,3855 | −0,0406 | |||
| ZTS / Zoetis Inc. | 0,01 | −0,49 | 1,59 | −5,75 | 0,3847 | −0,0605 | |||
| AFL / Aflac Incorporated | 0,01 | −1,77 | 1,58 | −6,85 | 0,3818 | −0,0652 | |||
| IBKR / Interactive Brokers Group, Inc. | 0,03 | 300,00 | 1,56 | 33,85 | 0,3779 | 0,0699 | |||
| MPC / Marathon Petroleum Corporation | 0,01 | 0,22 | 1,55 | 14,25 | 0,3742 | 0,0170 | |||
| AXP / American Express Company | 0,00 | 0,53 | 1,51 | 19,15 | 0,3658 | 0,0310 | |||
| VIG / Vanguard Specialized Funds - Vanguard Dividend Appreciation ETF | 0,01 | 0,42 | 1,48 | 5,92 | 0,3590 | −0,0106 | |||
| SPR / Spirit AeroSystems Holdings, Inc. | 0,04 | −10,18 | 1,45 | −0,55 | 0,3498 | −0,0339 | |||
| DUK / Duke Energy Corporation | 0,01 | 0,05 | 1,43 | −3,25 | 0,3460 | −0,0439 | |||
| VNQ / Vanguard Specialized Funds - Vanguard Real Estate ETF | 0,02 | −0,14 | 1,35 | −1,75 | 0,3258 | −0,0360 | |||
| QQQE / Direxion Shares ETF Trust - Direxion NASDAQ-100 Equal Weighted Index Shares | 0,01 | 0,74 | 1,33 | 13,54 | 0,3225 | 0,0128 | |||
| VOO / Vanguard Index Funds - Vanguard S&P 500 ETF | 0,00 | 2,01 | 1,33 | 12,74 | 0,3210 | 0,0104 | |||
| CLX / The Clorox Company | 0,01 | −0,48 | 1,32 | −18,90 | 0,3199 | −0,1101 | |||
| MMM / 3M Company | 0,01 | −0,71 | 1,30 | 2,94 | 0,3136 | −0,0187 | |||
| SBUX / Starbucks Corporation | 0,01 | 0,01 | 1,29 | −6,53 | 0,3117 | −0,0522 | |||
| FI / Fiserv, Inc. | 0,01 | 2,77 | 1,28 | −19,75 | 0,3096 | −0,1113 | |||
| GEV / GE Vernova Inc. | 0,00 | 2,05 | 1,26 | 76,78 | 0,3058 | 0,1171 | |||
| DEO / Diageo plc - Depositary Receipt (Common Stock) | 0,01 | −0,97 | 1,26 | −4,69 | 0,3050 | −0,0441 | |||
| INTC / Intel Corporation | 0,06 | −0,27 | 1,25 | −1,57 | 0,3023 | −0,0329 | |||
| WYNN / Wynn Resorts, Limited | 0,01 | 5,68 | 1,17 | 18,48 | 0,2824 | 0,0226 | |||
| NVS / Novartis AG - Depositary Receipt (Common Stock) | 0,01 | 0,00 | 1,16 | 8,49 | 0,2815 | −0,0014 | |||
| KO / The Coca-Cola Company | 0,02 | −0,54 | 1,15 | −1,71 | 0,2775 | −0,0306 | |||
| BMY / Bristol-Myers Squibb Company | 0,02 | 2,70 | 1,12 | −22,03 | 0,2697 | −0,1077 | |||
| SCHW / The Charles Schwab Corporation | 0,01 | 1,45 | 1,05 | 18,18 | 0,2549 | 0,0198 | |||
| ES / Eversource Energy | 0,02 | 4,99 | 1,04 | 7,53 | 0,2523 | −0,0036 | |||
| AME / AMETEK, Inc. | 0,01 | 0,00 | 1,04 | 5,16 | 0,2516 | −0,0095 | |||
| MET / MetLife, Inc. | 0,01 | 1,07 | 1,01 | 1,20 | 0,2451 | −0,0190 | |||
| PSX / Phillips 66 | 0,01 | 1,16 | 1,00 | −2,25 | 0,2418 | −0,0281 | |||
| SMH / VanEck ETF Trust - VanEck Semiconductor ETF | 0,00 | 9,77 | 0,97 | 44,93 | 0,2349 | 0,0579 | |||
| ORCL / Oracle Corporation | 0,00 | −2,26 | 0,94 | 52,75 | 0,2285 | 0,0654 | |||
| CNI / Canadian National Railway Company | 0,01 | 0,00 | 0,94 | 6,73 | 0,2264 | −0,0049 | |||
| DLR / Digital Realty Trust, Inc. | 0,01 | 2,41 | 0,90 | 24,58 | 0,2171 | 0,0270 | |||
| VRTX / Vertex Pharmaceuticals Incorporated | 0,00 | 0,00 | 0,89 | −8,15 | 0,2153 | −0,0405 | |||
| GLW / Corning Incorporated | 0,02 | 6,28 | 0,89 | 22,12 | 0,2151 | 0,0229 | |||
| ED / Consolidated Edison, Inc. | 0,01 | 0,30 | 0,89 | −9,03 | 0,2144 | −0,0426 | |||
| IJJ / iShares Trust - iShares S&P Mid-Cap 400 Value ETF | 0,01 | 0,00 | 0,87 | 3,22 | 0,2092 | −0,0119 | |||
| NVO / Novo Nordisk A/S - Depositary Receipt (Common Stock) | 0,01 | −5,04 | 0,86 | −5,62 | 0,2074 | −0,0323 | |||
| SUPN / Supernus Pharmaceuticals, Inc. | 0,03 | −8,21 | 0,81 | −11,67 | 0,1959 | −0,0460 | |||
| COP / ConocoPhillips | 0,01 | 5,19 | 0,80 | −10,07 | 0,1944 | −0,0415 | |||
| CSX / CSX Corporation | 0,02 | 0,00 | 0,80 | 10,94 | 0,1938 | 0,0031 | |||
| LYV / Live Nation Entertainment, Inc. | 0,01 | 0,78 | 0,78 | 16,84 | 0,1897 | 0,0125 | |||
| SYY / Sysco Corporation | 0,01 | −1,95 | 0,76 | −1,04 | 0,1847 | −0,0189 | |||
| IGM / iShares Trust - iShares Expanded Tech Sector ETF | 0,01 | 1,04 | 0,76 | 25,12 | 0,1844 | 0,0237 | |||
| MDLZ / Mondelez International, Inc. | 0,01 | 0,45 | 0,76 | −0,13 | 0,1834 | −0,0170 | |||
| ROK / Rockwell Automation, Inc. | 0,00 | 2,24 | 0,76 | 31,42 | 0,1831 | 0,0312 | |||
| TGT / Target Corporation | 0,01 | 8,18 | 0,73 | 2,24 | 0,1770 | −0,0118 | |||
| XPO / XPO, Inc. | 0,01 | −25,97 | 0,72 | −13,16 | 0,1741 | −0,0444 | |||
| NGG / National Grid plc - Depositary Receipt (Common Stock) | 0,01 | 0,08 | 0,72 | 13,45 | 0,1736 | 0,0068 | |||
| XLC / The Select Sector SPDR Trust - The Communication Services Select Sector SPDR Fund | 0,01 | 0,76 | 0,72 | 13,47 | 0,1732 | 0,0066 | |||
| IJS / iShares Trust - iShares S&P Small-Cap 600 Value ETF | 0,01 | 0,00 | 0,66 | 2,17 | 0,1596 | −0,0110 | |||
| GIS / General Mills, Inc. | 0,01 | 4,17 | 0,66 | −9,74 | 0,1593 | −0,0332 | |||
| FCX / Freeport-McMoRan Inc. | 0,02 | 7,52 | 0,66 | 23,26 | 0,1589 | 0,0181 | |||
| IWM / iShares Trust - iShares Russell 2000 ETF | 0,00 | 0,00 | 0,65 | 8,21 | 0,1562 | −0,0013 | |||
| RBLX / Roblox Corporation | 0,01 | −28,97 | 0,64 | 28,03 | 0,1559 | 0,0233 | |||
| TXN / Texas Instruments Incorporated | 0,00 | 0,00 | 0,63 | 15,69 | 0,1533 | 0,0086 | |||
| LVS / Las Vegas Sands Corp. | 0,01 | 2,35 | 0,63 | 15,36 | 0,1528 | 0,0082 | |||
| VFH / Vanguard World Fund - Vanguard Financials ETF | 0,00 | −0,51 | 0,62 | 5,99 | 0,1499 | −0,0043 | |||
| MDYG / SPDR Series Trust - SPDR S&P 400 Mid Cap Growth ETF | 0,01 | −1,39 | 0,62 | 7,69 | 0,1492 | −0,0018 | |||
| UPS / United Parcel Service, Inc. | 0,01 | 5,30 | 0,61 | −3,48 | 0,1480 | −0,0191 | |||
| OKE / ONEOK, Inc. | 0,01 | 15,27 | 0,61 | −5,13 | 0,1475 | −0,0222 | |||
| YETI / YETI Holdings, Inc. | 0,02 | −0,39 | 0,61 | −5,17 | 0,1464 | −0,0219 | |||
| TD / The Toronto-Dominion Bank | 0,01 | 0,00 | 0,58 | 22,55 | 0,1394 | 0,0153 | |||
| UNP / Union Pacific Corporation | 0,00 | 4,24 | 0,57 | 1,44 | 0,1368 | −0,0102 | |||
| GXO / GXO Logistics, Inc. | 0,01 | −4,98 | 0,54 | 18,56 | 0,1314 | 0,0103 | |||
| VHT / Vanguard World Fund - Vanguard Health Care ETF | 0,00 | 1,87 | 0,54 | −4,42 | 0,1308 | −0,0185 | |||
| APD / Air Products and Chemicals, Inc. | 0,00 | −2,56 | 0,54 | −6,77 | 0,1300 | −0,0222 | |||
| WASH / Washington Trust Bancorp, Inc. | 0,02 | 0,67 | 0,53 | −7,83 | 0,1283 | −0,0234 | |||
| QQQM / Invesco Exchange-Traded Fund Trust II - Invesco NASDAQ 100 ETF | 0,00 | 23,31 | 0,52 | 44,94 | 0,1249 | 0,0310 | |||
| MTB / M&T Bank Corporation | 0,00 | 6,28 | 0,52 | 15,47 | 0,1246 | 0,0068 | |||
| SNOW / Snowflake Inc. | 0,00 | 2,75 | 0,50 | 57,37 | 0,1215 | 0,0372 | |||
| ACN / Accenture plc | 0,00 | −1,33 | 0,49 | −5,42 | 0,1184 | −0,0182 | |||
| AVB / AvalonBay Communities, Inc. | 0,00 | 0,00 | 0,49 | −5,08 | 0,1176 | −0,0177 | |||
| REGL / ProShares Trust - ProShares S&P Midcap 400 Dividend Aristocrats ETF | 0,01 | −1,33 | 0,48 | −0,21 | 0,1172 | −0,0110 | |||
| LNT / Alliant Energy Corporation | 0,01 | 0,48 | 0,1155 | 0,1155 | |||||
| T / AT&T Inc. | 0,02 | 0,01 | 0,47 | 2,39 | 0,1140 | −0,0075 | |||
| EMR / Emerson Electric Co. | 0,00 | −1,41 | 0,47 | 19,85 | 0,1126 | 0,0101 | |||
| QQQJ / Invesco Exchange-Traded Fund Trust II - Invesco NASDAQ Next Gen 100 ETF | 0,01 | 0,00 | 0,46 | 10,12 | 0,1107 | 0,0012 | |||
| CARR / Carrier Global Corporation | 0,01 | −1,61 | 0,45 | 13,74 | 0,1081 | 0,0043 | |||
| EQR / Equity Residential | 0,01 | 0,00 | 0,44 | −5,53 | 0,1074 | −0,0169 | |||
| XLRE / The Select Sector SPDR Trust - The Real Estate Select Sector SPDR Fund | 0,01 | 8,95 | 0,44 | 7,86 | 0,1063 | −0,0012 | |||
| BR / Broadridge Financial Solutions, Inc. | 0,00 | 0,00 | 0,43 | 0,23 | 0,1046 | −0,0092 | |||
| DIS / The Walt Disney Company | 0,00 | 0,00 | 0,43 | 25,44 | 0,1040 | 0,0137 | |||
| SPSM / SPDR Series Trust - SPDR Portfolio S&P 600 Small Cap ETF | 0,01 | 1,02 | 0,42 | 5,53 | 0,1018 | −0,0034 | |||
| NSC / Norfolk Southern Corporation | 0,00 | 22,39 | 0,42 | 32,18 | 0,1015 | 0,0178 | |||
| PHM / PulteGroup, Inc. | 0,00 | 0,00 | 0,42 | 2,46 | 0,1007 | −0,0064 | |||
| IJH / iShares Trust - iShares Core S&P Mid-Cap ETF | 0,01 | −1,12 | 0,41 | 5,10 | 0,0997 | −0,0038 | |||
| MQT / BlackRock MuniYield Quality Fund II, Inc. | 0,04 | 0,00 | 0,40 | −3,81 | 0,0979 | −0,0129 | |||
| DD / DuPont de Nemours, Inc. | 0,01 | −19,46 | 0,40 | −26,01 | 0,0978 | −0,0464 | |||
| FCPT / Four Corners Property Trust, Inc. | 0,02 | −1,31 | 0,40 | −7,34 | 0,0978 | −0,0175 | |||
| BXP / Boston Properties, Inc. | 0,01 | −2,14 | 0,40 | −1,73 | 0,0964 | −0,0106 | |||
| TSLA / Tesla, Inc. | 0,00 | −1,95 | 0,40 | 20,24 | 0,0964 | 0,0089 | |||
| OTIS / Otis Worldwide Corporation | 0,00 | −3,61 | 0,40 | −7,46 | 0,0960 | −0,0172 | |||
| HWM / Howmet Aerospace Inc. | 0,00 | 5,00 | 0,39 | 50,58 | 0,0945 | 0,0261 | |||
| ALB / Albemarle Corporation | 0,01 | 21,30 | 0,39 | 5,69 | 0,0944 | −0,0032 | |||
| D / Dominion Energy, Inc. | 0,01 | 10,32 | 0,39 | 11,14 | 0,0943 | 0,0018 | |||
| MBLY / Mobileye Global Inc. | 0,02 | 7,19 | 0,39 | 33,79 | 0,0940 | 0,0174 | |||
| VGT / Vanguard World Fund - Vanguard Information Technology ETF | 0,00 | 0,00 | 0,37 | 22,30 | 0,0903 | 0,0098 | |||
| CFG / Citizens Financial Group, Inc. | 0,01 | 6,85 | 0,37 | 16,61 | 0,0884 | 0,0058 | |||
| SPMD / SPDR Series Trust - SPDR Portfolio S&P 400 Mid Cap ETF | 0,01 | 8,24 | 0,36 | 14,79 | 0,0865 | 0,0045 | |||
| AMGN / Amgen Inc. | 0,00 | 0,00 | 0,36 | −10,30 | 0,0864 | −0,0188 | |||
| VYM / Vanguard Whitehall Funds - Vanguard High Dividend Yield ETF | 0,00 | 8,78 | 0,36 | 12,30 | 0,0863 | 0,0026 | |||
| RSP / Invesco Exchange-Traded Fund Trust - Invesco S&P 500 Equal Weight ETF | 0,00 | 17,48 | 0,36 | 23,26 | 0,0860 | 0,0099 | |||
| SLB / Schlumberger Limited | 0,01 | 4,81 | 0,35 | −15,25 | 0,0847 | −0,0243 | |||
| NEA / Nuveen AMT-Free Quality Municipal Income Fund | 0,03 | 0,00 | 0,35 | −2,54 | 0,0836 | −0,0099 | |||
| ETR / Entergy Corporation | 0,00 | 0,00 | 0,35 | −2,82 | 0,0836 | −0,0102 | |||
| VIS / Vanguard World Fund - Vanguard Industrials ETF | 0,00 | 6,17 | 0,34 | 20,07 | 0,0827 | 0,0076 | |||
| NKE / NIKE, Inc. | 0,00 | −36,53 | 0,34 | −29,02 | 0,0824 | −0,0441 | |||
| PRU / Prudential Financial, Inc. | 0,00 | −6,65 | 0,34 | −10,32 | 0,0821 | −0,0176 | |||
| VUG / Vanguard Index Funds - Vanguard Growth ETF | 0,00 | 0,00 | 0,33 | 18,51 | 0,0806 | 0,0062 | |||
| MSI / Motorola Solutions, Inc. | 0,00 | −8,30 | 0,33 | −12,03 | 0,0797 | −0,0190 | |||
| CMI / Cummins Inc. | 0,00 | 0,00 | 0,33 | 4,47 | 0,0792 | −0,0035 | |||
| DVY / iShares Trust - iShares Select Dividend ETF | 0,00 | −0,61 | 0,33 | −1,51 | 0,0791 | −0,0087 | |||
| TSM / Taiwan Semiconductor Manufacturing Company Limited - Depositary Receipt (Common Stock) | 0,00 | 0,00 | 0,32 | 36,86 | 0,0782 | 0,0157 | |||
| PEG / Public Service Enterprise Group Incorporated | 0,00 | −2,60 | 0,32 | −0,32 | 0,0762 | −0,0072 | |||
| BK / The Bank of New York Mellon Corporation | 0,00 | 0,00 | 0,31 | 8,36 | 0,0754 | −0,0003 | |||
| WY / Weyerhaeuser Company | 0,01 | 0,00 | 0,31 | −12,18 | 0,0750 | −0,0182 | |||
| CBOE / Cboe Global Markets, Inc. | 0,00 | 0,00 | 0,31 | 3,34 | 0,0747 | −0,0044 | |||
| MPB / Mid Penn Bancorp, Inc. | 0,01 | 0,00 | 0,31 | 8,90 | 0,0741 | −0,0002 | |||
| ARM / Arm Holdings plc - Depositary Receipt (Common Stock) | 0,00 | 0,30 | 0,0737 | 0,0737 | |||||
| CMCSA / Comcast Corporation | 0,01 | 3,32 | 0,30 | 0,00 | 0,0718 | −0,0066 | |||
| TRV / The Travelers Companies, Inc. | 0,00 | −3,49 | 0,30 | −2,64 | 0,0716 | −0,0084 | |||
| HOLX / Hologic, Inc. | 0,00 | 0,00 | 0,29 | 5,78 | 0,0709 | −0,0024 | |||
| MGK / Vanguard World Fund - Vanguard Mega Cap Growth ETF | 0,00 | 0,00 | 0,29 | 18,22 | 0,0708 | 0,0057 | |||
| FE / FirstEnergy Corp. | 0,01 | 0,00 | 0,29 | −0,34 | 0,0707 | −0,0067 | |||
| WELL / Welltower Inc. | 0,00 | 6,57 | 0,29 | 7,04 | 0,0699 | −0,0014 | |||
| DIA / SPDR Dow Jones Industrial Average ETF Trust | 0,00 | 3,16 | 0,29 | 8,30 | 0,0695 | −0,0005 | |||
| IIPR / Innovative Industrial Properties, Inc. | 0,01 | 21,74 | 0,29 | 23,91 | 0,0692 | 0,0085 | |||
| KEYS / Keysight Technologies, Inc. | 0,00 | 0,00 | 0,29 | 9,62 | 0,0689 | 0,0002 | |||
| WPC / W. P. Carey Inc. | 0,00 | 0,00 | 0,28 | −1,06 | 0,0680 | −0,0070 | |||
| VWO / Vanguard International Equity Index Funds - Vanguard FTSE Emerging Markets ETF | 0,01 | 3,65 | 0,28 | 12,90 | 0,0679 | 0,0025 | |||
| NDAQ / Nasdaq, Inc. | 0,00 | 0,00 | 0,28 | 17,80 | 0,0673 | 0,0050 | |||
| BX / Blackstone Inc. | 0,00 | 5,27 | 0,28 | 13,01 | 0,0673 | 0,0021 | |||
| VZ / Verizon Communications Inc. | 0,01 | −0,78 | 0,27 | −5,52 | 0,0665 | −0,0101 | |||
| MDT / Medtronic plc | 0,00 | −0,99 | 0,27 | −3,90 | 0,0656 | −0,0089 | |||
| AMT / American Tower Corporation | 0,00 | 0,00 | 0,27 | 1,52 | 0,0646 | −0,0048 | |||
| STT / State Street Corporation | 0,00 | −7,41 | 0,27 | 9,96 | 0,0643 | 0,0005 | |||
| AWK / American Water Works Company, Inc. | 0,00 | 0,00 | 0,25 | −5,58 | 0,0616 | −0,0097 | |||
| HAL / Halliburton Company | 0,01 | 2,52 | 0,25 | −17,92 | 0,0611 | −0,0198 | |||
| HRL / Hormel Foods Corporation | 0,01 | 1,96 | 0,24 | −0,42 | 0,0571 | −0,0054 | |||
| COST / Costco Wholesale Corporation | 0,00 | 0,00 | 0,24 | 4,44 | 0,0570 | −0,0024 | |||
| AAT / American Assets Trust, Inc. | 0,01 | 9,91 | 0,23 | 7,98 | 0,0556 | −0,0007 | |||
| IRM / Iron Mountain Incorporated | 0,00 | 0,23 | 0,0553 | 0,0553 | |||||
| XEL / Xcel Energy Inc. | 0,00 | 0,00 | 0,23 | −3,80 | 0,0552 | −0,0074 | |||
| IAU / iShares Gold Trust | 0,00 | 0,00 | 0,23 | 5,61 | 0,0548 | −0,0017 | |||
| ADBE / Adobe Inc. | 0,00 | −10,69 | 0,23 | −9,96 | 0,0547 | −0,0115 | |||
| PYPL / PayPal Holdings, Inc. | 0,00 | −3,19 | 0,23 | 10,29 | 0,0545 | 0,0006 | |||
| ZBH / Zimmer Biomet Holdings, Inc. | 0,00 | −3,25 | 0,23 | −21,87 | 0,0545 | −0,0217 | |||
| TJX / The TJX Companies, Inc. | 0,00 | −5,27 | 0,22 | −4,33 | 0,0537 | −0,0073 | |||
| CEG / Constellation Energy Corporation | 0,00 | 0,22 | 0,0536 | 0,0536 | |||||
| BIO / Bio-Rad Laboratories, Inc. | 0,00 | 0,00 | 0,22 | −0,91 | 0,0525 | −0,0053 | |||
| HPQ / HP Inc. | 0,01 | −9,25 | 0,22 | −19,70 | 0,0523 | −0,0188 | |||
| MDY / SPDR S&P MidCap 400 ETF Trust | 0,00 | 0,21 | 0,0499 | 0,0499 | |||||
| NMCO / Nuveen Municipal Credit Opportunities Fund | 0,02 | 0,00 | 0,20 | 0,00 | 0,0493 | −0,0043 | |||
| NBB / Nuveen Taxable Municipal Income Fund | 0,01 | 0,00 | 0,17 | −1,16 | 0,0411 | −0,0043 | |||
| LPSN / LivePerson, Inc. | 0,05 | 0,00 | 0,05 | 27,50 | 0,0124 | 0,0017 | |||
| STX / Seagate Technology Holdings plc | 0,00 | −100,00 | 0,00 | 0,0000 | |||||
| GEHC / GE HealthCare Technologies Inc. | 0,00 | −100,00 | 0,00 | 0,0000 | |||||
| ELS / Equity LifeStyle Properties, Inc. | 0,00 | −100,00 | 0,00 | 0,0000 | |||||
| COHR / Coherent Corp. | 0,00 | −100,00 | 0,00 | 0,0000 | |||||
| GM / General Motors Company | 0,00 | −100,00 | 0,00 | 0,0000 | |||||
| A / Agilent Technologies, Inc. | 0,00 | −100,00 | 0,00 | 0,0000 | |||||
| DOW / Dow Inc. | 0,00 | −100,00 | 0,00 | 0,0000 |