Grundläggande statistik
| Institutionella ägare | 260 total, 260 long only, 0 short only, 0 long/short - change of 6,53% MRQ |
| Genomsnittlig portföljallokering | 0.4203 % - change of −4,60% MRQ |
| Institutionella aktier (lång) | 55 235 193 (ex 13D/G) - change of 3,27MM shares 6,30% MRQ |
| Institutionellt värde (lång) | $ 1 192 914 USD ($1000) |
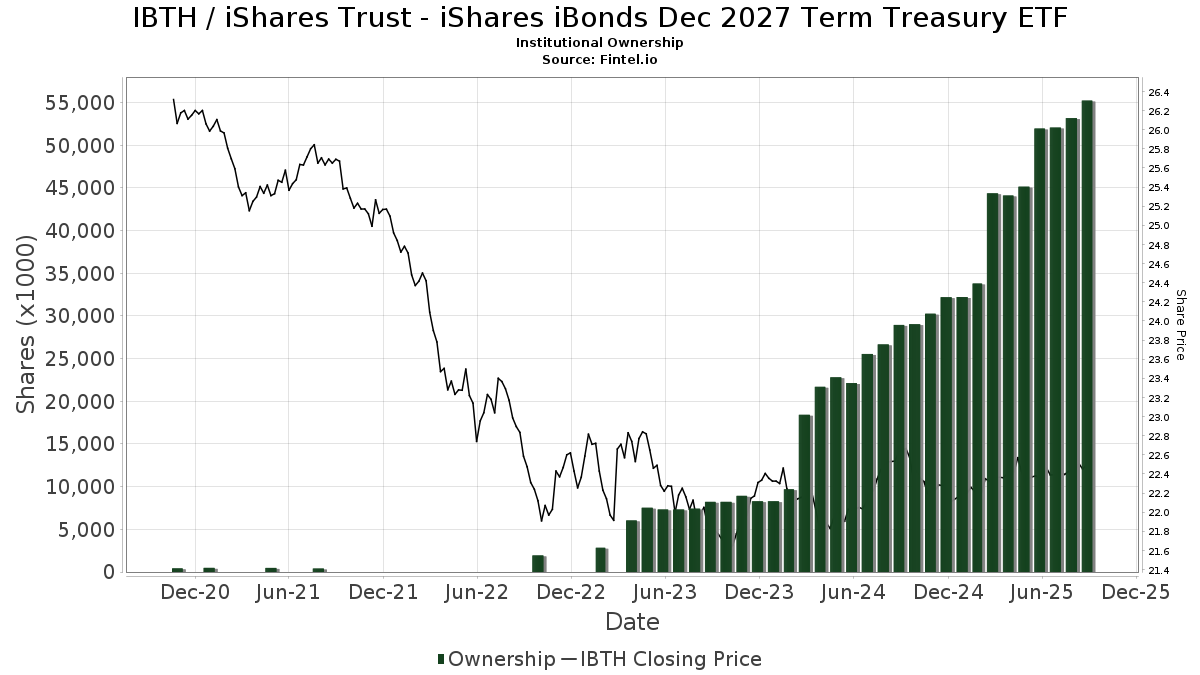
Institutionellt ägande och aktieägare
iShares Trust - iShares iBonds Dec 2027 Term Treasury ETF (US:IBTH) har 260 Institutionella ägare och aktieägare som har lämnat in 13D/G- eller 13F-formulär till Securities Exchange Commission (SEC). Dessa institut innehar totalt 55,235,193 aktier. Största aktieägare inkluderar Hm Payson & Co, Bank Of America Corp /de/, Morgan Stanley, GLOBALT Investments LLC / GA, Wells Fargo & Company/mn, TRUE Private Wealth Advisors, Envestnet Asset Management Inc, Colony Group, LLC, GWM Advisors LLC, and LPL Financial LLC .
iShares Trust - iShares iBonds Dec 2027 Term Treasury ETF (NasdaqGM:IBTH) Institutionell ägarstruktur visar institutioners och fonders nuvarande positioner i företaget, samt de senaste förändringarna i positionernas storlek. Större aktieägare kan vara enskilda investerare, fonder, hedgefonder eller institutioner. Bilaga 13D visar att investeraren äger (eller ägde) mer än 5% av företaget och avser (eller avsåg) att aktivt eftersträva en förändring av affärsstrategin. Schedule 13G indikerar en passiv investering på över 5%.
The share price as of September 10, 2025 is 22,50 / share. Previously, on September 11, 2024, the share price was 22,64 / share. This represents a decline of 0,62% over that period.
Fondsentimentets poäng
Fondsentimentet poängen(fka Ägarackumulation-poäng) visar vilka aktier som är mest köpta av fonder. Det är resultatet av en sofistikerad kvantitativ flerfaktormodell som identifierar företag med de högsta nivåerna av institutionell ackumulering. Poängsättningsmodellen använder en kombination av den totala ökningen av redovisade ägare, förändringarna i portföljallokeringarna för dessa ägare och andra mått. Siffran sträcker sig från 0 till 100, där högre siffror indikerar en högre nivå av ackumulering i förhållande till sina konkurrenter, och 50 är genomsnittet.
Uppdateringsfrekvens: Dagligen
Se Ownership Explorer, som innehåller en lista över de högst rankade företagen.
Institutionell sälj/köp-kvot
Förutom att rapportera vanliga eget kapital- och skuldemissioner måste institutioner med mer än 100MM tillgångar under förvaltning också avslöja sina innehav av sälj- och köpoptioner. Eftersom säljoptioner i allmänhet indikerar ett negativt sentiment och köpoptioner indikerar ett positivt sentiment, kan vi få en uppfattning om det övergripande institutionella sentimentet genom att plotta förhållandet mellan säljoptioner och köpoptioner. Diagrammet till höger visar det historiska förhållandet mellan sälj- och köpoptioner för detta instrument.
Genom att använda sälj/köp-kvoten som en indikator på aktieägarnas sentiment undviker man en av de största bristerna med att använda det totala institutionella ägandet, nämligen att en betydande del av de förvaltade tillgångarna investeras passivt för att följa index. Passivt förvaltade fonder köper vanligtvis inte optioner, så indikatorn för sälj/köp-kvoten ger en bättre bild av stämningen i aktivt förvaltade fonder.
13F- och NPORT-arkiveringar
Detaljer om 13F-arkiveringar är gratis. Detaljer om NP-arkiveringar kräver ett premiummedlemskap. Gröna rader indikerar nya positioner. Röda rader indikerar stängda positioner. Klicka på länk symbolen för att se hela transaktionshistoriken.
Uppgradera
för att låsa upp premiumdata och exportera till Excel ![]() .
.
| Fil Datum | Källa | Investerare | Typ | Genomsnittligt pris (beräknat) |
Aktier | Δ Aktier (%) |
Rapporterat värde (1000 USD) |
Δ Värde (%) |
Portföljallokering (%) |
|
|---|---|---|---|---|---|---|---|---|---|---|
| 2025-07-11 | 13F | Compass Ion Advisors, LLC | 43 434 | 24,16 | 977 | 24,49 | ||||
| 2025-08-14 | 13F | Mml Investors Services, Llc | 51 169 | 181,52 | 1 | |||||
| 2025-08-14 | 13F | Money Concepts Capital Corp | 9 290 | 209 | ||||||
| 2025-07-17 | 13F | Robbins Farley Llc | 1 397 | −3,25 | 31 | −3,12 | ||||
| 2025-07-29 | 13F | Stratos Wealth Partners, LTD. | 958 118 | −7,84 | 21 548 | −7,55 | ||||
| 2025-08-12 | 13F | Tableaux Llc | 0 | −100,00 | 0 | |||||
| 2025-08-14 | 13F | Wells Fargo & Company/mn | 2 023 190 | 2,52 | 45 502 | 2,84 | ||||
| 2025-08-11 | 13F | United Capital Financial Advisers, Llc | 495 885 | 69,67 | 11 152 | 70,21 | ||||
| 2025-07-09 | 13F | Lbmc Investment Advisors, Llc | 9 930 | 223 | ||||||
| 2025-05-07 | 13F | Spectrum Wealth Counsel, LLC | 5 137 | 0,00 | 115 | 0,88 | ||||
| 2025-07-08 | 13F | Parallel Advisors, LLC | 121 750 | 12,61 | 2 738 | 13,00 | ||||
| 2025-07-18 | 13F | Truist Financial Corp | 173 082 | −6,95 | 3 893 | −6,67 | ||||
| 2025-07-30 | 13F/A | KPP Advisory Services LLC | 13 800 | 0,00 | 310 | 0,32 | ||||
| 2025-07-30 | 13F | Granite Harbor Advisors, Inc. | 37 893 | 2,00 | 852 | 2,40 | ||||
| 2025-08-04 | 13F | 4J Wealth Management LLC | 38 183 | −9,43 | 859 | −9,21 | ||||
| 2025-08-14 | 13F | Susquehanna International Group, Llp | 0 | −100,00 | 0 | |||||
| 2025-07-16 | 13F | Old Port Advisors | 306 158 | 4,12 | 6 885 | 4,44 | ||||
| 2025-08-11 | 13F | HHM Wealth Advisors, LLC | 601 | 0,00 | 14 | 0,00 | ||||
| 2025-07-30 | 13F | Strategic Blueprint, LLC | 225 012 | 28,73 | 5 061 | 29,11 | ||||
| 2025-08-06 | 13F | Commonwealth Equity Services, Llc | 603 607 | −0,37 | 14 | 0,00 | ||||
| 2025-08-04 | 13F | Balentine LLC | 1 124 | 0,00 | 25 | 0,00 | ||||
| 2025-08-11 | 13F | Principal Securities, Inc. | 12 034 | −9,07 | 271 | −7,85 | ||||
| 2025-04-29 | 13F | Hm Payson & Co | 5 459 782 | 10,73 | 122 408 | 11,84 | ||||
| 2025-07-23 | 13F | Spectrum Asset Management, Inc. (NB/CA) | 27 636 | 27,58 | 622 | 28,04 | ||||
| 2025-08-15 | 13F | Captrust Financial Advisors | 177 282 | 8,39 | 3 987 | 8,73 | ||||
| 2025-07-17 | 13F | Stockman Wealth Management, Inc. | 185 876 | 5,99 | 4 180 | 6,33 | ||||
| 2025-07-07 | 13F | Greenfield Savings Bank | 12 232 | −3,78 | 275 | −3,51 | ||||
| 2025-08-07 | 13F | Hughes Financial Services, LLC | 96 333 | 3,02 | 2 160 | 3,25 | ||||
| 2025-07-23 | 13F | Country Club Bank /gfn | 18 236 | −4,83 | 410 | −4,66 | ||||
| 2025-08-15 | 13F | Howland Capital Management Llc | 114 338 | 17,93 | 2 571 | 18,32 | ||||
| 2025-08-13 | 13F | SCS Capital Management LLC | 103 274 | 0,19 | 2 323 | 0,48 | ||||
| 2025-07-25 | 13F | 1858 Wealth Management, Llc | 0 | −100,00 | 0 | |||||
| 2025-07-15 | 13F | BCS Wealth Management | 0 | −100,00 | 0 | |||||
| 2025-08-14 | 13F | Essential Planning, LLC. | 31 797 | 0,43 | 715 | 0,85 | ||||
| 2025-07-14 | 13F | UMA Financial Services, Inc. | 6 892 | 0,00 | 155 | 0,65 | ||||
| 2025-07-16 | 13F | Signaturefd, Llc | 150 338 | 51,58 | 3 381 | 52,09 | ||||
| 2025-08-01 | 13F | Bank of Jackson Hole Trust | 3 282 | 0,00 | 74 | 0,00 | ||||
| 2025-07-09 | 13F | Chesley Taft & Associates LLC | 19 000 | 21,79 | 427 | 22,35 | ||||
| 2025-08-14 | 13F | Goldman Sachs Group Inc | 20 271 | 20,74 | 456 | 21,01 | ||||
| 2025-08-14 | 13F | GWM Advisors LLC | 1 210 609 | −6,69 | 27 227 | −6,40 | ||||
| 2025-08-01 | 13F | Liberty Wealth Management Llc | 13 806 | 311 | ||||||
| 2025-08-11 | 13F | TRUE Private Wealth Advisors | 1 979 633 | 41,80 | 44 522 | 42,24 | ||||
| 2025-04-11 | 13F | Safeguard Financial, LLC | 25 199 | −2,56 | 565 | −1,74 | ||||
| 2025-08-14 | 13F | Hara Capital LLC | 7 876 | 0,00 | 177 | 0,57 | ||||
| 2025-07-07 | 13F | Trust Co | 10 164 | −9,85 | 229 | −9,52 | ||||
| 2025-07-23 | 13F | Valmark Advisers, Inc. | 94 912 | 12,63 | 2 135 | 12,97 | ||||
| 2025-08-14 | 13F | CIBC World Markets Inc. | 31 390 | 0,00 | 706 | 0,28 | ||||
| 2025-08-14 | 13F | CoreCap Advisors, LLC | 118 | 3 | ||||||
| 2025-08-14 | 13F | Synovus Financial Corp | 116 825 | −7,13 | 2 628 | −6,84 | ||||
| 2025-08-08 | 13F | Woodley Farra Manion Portfolio Management Inc | 20 956 | 15,69 | 471 | 16,01 | ||||
| 2025-05-15 | 13F | Wealth Management Strategies, Inc. | 392 313 | 11,71 | 8 796 | 11 322,08 | ||||
| 2025-07-30 | 13F | Bogart Wealth, LLC | 3 308 | 0,06 | 74 | 0,00 | ||||
| 2025-08-13 | 13F | Hamel Associates, Inc. | 10 469 | 235 | ||||||
| 2025-08-11 | 13F | Atlantic Private Wealth, LLC | 150 645 | 161,38 | 3 388 | 162,23 | ||||
| 2025-08-14 | 13F | UBS Group AG | 1 098 351 | 1,52 | 24 702 | 1,83 | ||||
| 2025-08-14 | 13F | Black Maple Capital Management LP | 12 500 | 281 | ||||||
| 2025-07-14 | 13F | Park Avenue Securities Llc | 89 591 | 2,00 | 2 | 100,00 | ||||
| 2025-08-14 | 13F | Wick Capital Partners, LLC | 144 309 | 353,16 | 657 | −7,85 | ||||
| 2025-08-13 | 13F | Flow Traders U.s. Llc | 10 845 | −92,50 | 0 | −100,00 | ||||
| 2025-08-14 | 13F | Benjamin Edwards Inc | 26 116 | 19,38 | 587 | 19,80 | ||||
| 2025-08-12 | 13F | OneAscent Financial Services LLC | 489 138 | 138,74 | 11 | 150,00 | ||||
| 2025-08-28 | NP | NDOW - Anydrus Advantage ETF | 133 060 | 56,40 | 2 993 | 56,90 | ||||
| 2025-06-02 | 13F | SkyView Investment Advisors, LLC | 0 | −100,00 | 0 | |||||
| 2025-08-12 | 13F | BlackRock, Inc. | 188 755 | 19,90 | 4 245 | 20,29 | ||||
| 2025-07-14 | 13F | Mechanics Bank Trust Department | 107 500 | −1,15 | 2 418 | −0,86 | ||||
| 2025-08-13 | 13F | RFP Financial Group LLC | 29 350 | 11,40 | 660 | 11,86 | ||||
| 2025-08-11 | 13F | Summit Wealth Partners, LLC | 33 695 | 15,30 | 758 | 15,57 | ||||
| 2025-08-12 | 13F | Eldridge Investment Advisors, Inc. | 17 915 | 5,03 | 402 | 4,97 | ||||
| 2025-08-15 | 13F | Scissortail Wealth Management, LLC | 57 500 | 0,46 | 1 293 | 0,78 | ||||
| 2025-08-06 | 13F | AE Wealth Management LLC | 655 | 0,00 | 15 | 0,00 | ||||
| 2025-08-13 | 13F | Beacon Pointe Advisors, LLC | 27 596 | 7,40 | 621 | 7,64 | ||||
| 2025-08-07 | 13F | Allworth Financial LP | 153 422 | 39,93 | 3 450 | 40,19 | ||||
| 2025-08-11 | 13F | Annis Gardner Whiting Capital Advisors, LLC | 1 778 | 106,26 | 40 | 105,26 | ||||
| 2025-07-11 | 13F | Financial Advisory Corp | 782 545 | 0,73 | 17 599 | 1,04 | ||||
| 2025-08-12 | 13F | Reliant Wealth Planning | 59 077 | 10,87 | 1 329 | 11,22 | ||||
| 2025-07-31 | 13F | Keeler THomas Management LLC | 47 388 | 34,16 | 1 066 | 34,64 | ||||
| 2025-07-16 | 13F | Kerntke Otto McGlone Wealth Management Group | 58 481 | 64,09 | 1 315 | 64,58 | ||||
| 2025-08-01 | 13F | Envestnet Asset Management Inc | 1 456 004 | 23,90 | 32 746 | 24,29 | ||||
| 2025-08-14 | 13F | Colony Group, LLC | 1 223 237 | 428,19 | 27 511 | 429,85 | ||||
| 2025-08-13 | 13F | Northwestern Mutual Wealth Management Co | 623 275 | −0,36 | 14 017 | −0,05 | ||||
| 2025-08-14 | 13F | Jane Street Group, Llc | 0 | −100,00 | 0 | |||||
| 2025-08-14 | 13F | Raymond James Financial Inc | 1 114 208 | 13,49 | 25 059 | 13,84 | ||||
| 2025-08-14 | 13F | Mercer Global Advisors Inc /adv | 644 028 | 32,31 | 14 484 | 32,73 | ||||
| 2025-07-24 | 13F | Leo Wealth, LLC | 97 110 | −0,65 | 2 184 | −0,32 | ||||
| 2025-08-13 | 13F | Lido Advisors, LLC | 0 | −100,00 | 0 | |||||
| 2025-08-18 | 13F/A | Kestra Investment Management, LLC | 17 328 | −43,91 | 390 | −43,79 | ||||
| 2025-08-13 | 13F | Capital Analysts, Inc. | 2 057 | 0,00 | 0 | |||||
| 2025-08-14 | 13F | Integrated Wealth Concepts LLC | 1 007 320 | 10,70 | 22 655 | 11,04 | ||||
| 2025-05-14 | 13F | Orion Portfolio Solutions, LLC | 42 069 | 0,00 | 936 | 0,00 | ||||
| 2025-05-08 | 13F | Shufro Rose & Co Llc | 0 | −100,00 | 0 | |||||
| 2025-07-18 | 13F | Foundry Financial Group, Inc. | 59 461 | −9,63 | 1 337 | −9,36 | ||||
| 2025-08-12 | 13F | Titleist Asset Management, Llc | 364 074 | 7,14 | 8 188 | 7,48 | ||||
| 2025-08-04 | 13F | Atria Investments Llc | 104 496 | 3,38 | 2 350 | 3,71 | ||||
| 2025-09-04 | 13F/A | Advisor Group Holdings, Inc. | 564 728 | 0,83 | 12 705 | 1,14 | ||||
| 2025-07-01 | 13F | Harbor Investment Advisory, Llc | 3 555 | 99,94 | 80 | 102,56 | ||||
| 2025-08-05 | 13F | Fullcircle Wealth Llc | 37 683 | −4,53 | 845 | −4,84 | ||||
| 2025-08-12 | 13F | MAI Capital Management | 109 052 | −1,04 | 2 453 | −0,73 | ||||
| 2025-06-23 | NP | LDRT - iShares iBonds 1-5 Year Treasury Ladder ETF | 175 421 | 200,00 | 3 959 | 204,07 | ||||
| 2025-08-05 | 13F | Hills Bank & Trust Co | 11 136 | 3,68 | 250 | 4,17 | ||||
| 2025-07-15 | 13F | Focused Wealth Management, Inc | 20 718 | 4,96 | 466 | 5,20 | ||||
| 2025-08-13 | 13F | Cerity Partners LLC | 20 853 | −0,43 | 469 | −0,21 | ||||
| 2025-07-07 | 13F | Horizons Wealth Management | 42 259 | 5,00 | 950 | 5,32 | ||||
| 2025-08-14 | 13F | Stifel Financial Corp | 237 998 | 5,93 | 5 353 | 6,25 | ||||
| 2025-08-13 | 13F | Boston Family Office Llc | 221 879 | 14,24 | 5 | 0,00 | ||||
| 2025-08-26 | 13F/A | Thrivent Financial For Lutherans | 13 777 | −70,08 | 0 | −100,00 | ||||
| 2025-07-17 | 13F | Chatham Capital Group, Inc. | 483 379 | −0,20 | 10 871 | 0,11 | ||||
| 2025-08-04 | 13F | Savvy Advisors, Inc. | 17 689 | 12,78 | 398 | 13,11 | ||||
| 2025-08-12 | 13F | Steward Partners Investment Advisory, Llc | 346 068 | −9,41 | 7 783 | −9,12 | ||||
| 2025-08-12 | 13F | Boreal Capital Management LLC | 0 | 405 | ||||||
| 2025-08-15 | 13F | Morgan Stanley | 3 458 097 | −5,85 | 77 773 | −5,55 | ||||
| 2025-07-30 | 13F/A | Old Point Trust & Financial Services N A | 12 610 | 19,53 | 284 | 19,92 | ||||
| 2025-08-19 | 13F | Asset Dedication, LLC | 53 683 | 5,27 | 1 207 | 5,60 | ||||
| 2025-07-23 | 13F | Prime Capital Investment Advisors, LLC | 10 311 | 232 | ||||||
| 2025-08-14 | 13F | Vista Private Wealth Partners. LLC | 743 351 | 8,61 | 16 718 | 8,94 | ||||
| 2025-07-22 | 13F | MBL Wealth, LLC | 252 122 | −8,91 | 5 670 | −8,62 | ||||
| 2025-07-16 | 13F | MKT Advisors LLC | 560 719 | 3,34 | 12 560 | 3,16 | ||||
| 2025-07-25 | 13F | Heartland Bank & Trust Co | 19 101 | 8,19 | 430 | 8,61 | ||||
| 2025-08-08 | 13F | Cetera Investment Advisers | 177 646 | −4,03 | 3 995 | −3,73 | ||||
| 2025-08-12 | 13F | LPL Financial LLC | 1 196 483 | 55,61 | 26 909 | 56,10 | ||||
| 2025-04-28 | 13F | Novem Group | 0 | −100,00 | 0 | |||||
| 2025-07-21 | 13F | Mattern Capital Management, Llc | 12 030 | 0,00 | 271 | 0,37 | ||||
| 2025-07-22 | 13F | Merit Financial Group, LLC | 22 789 | 513 | ||||||
| 2025-08-13 | 13F | Baird Financial Group, Inc. | 178 831 | 50,54 | 4 022 | 51,00 | ||||
| 2025-08-08 | 13F | Creative Planning | 44 303 | 0,00 | 996 | 0,30 | ||||
| 2025-07-25 | 13F | Hemington Wealth Management | 1 249 | 0,00 | 0 | |||||
| 2025-07-23 | 13F | BankPlus Trust Department | 1 057 | 0,00 | 24 | 0,00 | ||||
| 2025-08-11 | 13F | HighTower Advisors, LLC | 88 270 | 5,64 | 1 985 | 5,98 | ||||
| 2025-07-14 | 13F | Conrad Siegel Investment Advisors, Inc. | 16 275 | −54,99 | 366 | −54,81 | ||||
| 2025-07-25 | 13F | Apollon Wealth Management, LLC | 38 040 | 0,86 | 856 | 1,18 | ||||
| 2025-08-01 | 13F | Koss-Olinger Consulting, LLC | 23 218 | 0,90 | 522 | 1,16 | ||||
| 2025-08-05 | 13F | Gould Asset Management Llc /ca/ | 93 285 | 3,49 | 2 098 | 3,81 | ||||
| 2025-07-24 | 13F | Us Bancorp \de\ | 800 | 0,00 | 18 | 0,00 | ||||
| 2025-08-05 | 13F | Bank Of Montreal /can/ | 3 437 | −79,69 | 77 | −79,68 | ||||
| 2025-08-18 | 13F/A | National Bank Of Canada /fi/ | 13 472 | 4,14 | 303 | 4,14 | ||||
| 2025-04-17 | 13F | Montecito Bank & Trust | 50 104 | 4,16 | 1 123 | 5,25 | ||||
| 2025-07-23 | 13F | Element Wealth, LLC | 39 326 | 10,37 | 884 | 10,78 | ||||
| 2025-08-05 | 13F | C2P Capital Advisory Group, LLC d.b.a. Prosperity Capital Advisors | 0 | −100,00 | 0 | |||||
| 2025-07-17 | 13F | Janney Montgomery Scott LLC | 289 147 | 22,90 | 7 | 20,00 | ||||
| 2025-08-12 | 13F | Franklin Resources Inc | 456 | 10 | ||||||
| 2025-08-11 | 13F | Wealthspire Advisors, LLC | 96 821 | 4,16 | 2 178 | 4,46 | ||||
| 2025-08-04 | 13F | Mesirow Financial Investment Management, Inc. | 29 022 | 0,00 | 653 | 0,31 | ||||
| 2025-07-31 | 13F | Cambridge Investment Research Advisors, Inc. | 105 012 | 5,10 | 2 | 0,00 | ||||
| 2025-08-12 | 13F | Jacobi Capital Management LLC | 17 007 | 6,54 | 382 | 7,00 | ||||
| 2025-07-24 | 13F | Eastern Bank | 1 150 | 0,00 | 26 | 0,00 | ||||
| 2025-07-24 | 13F/A | TFR Capital, LLC. | 88 052 | 23,48 | 1 980 | 23,90 | ||||
| 2025-08-08 | 13F | WASHINGTON TRUST Co | 12 294 | 0,00 | 276 | 0,36 | ||||
| 2025-08-06 | 13F | SOUTH STATE Corp | 55 | 1 | ||||||
| 2025-08-01 | 13F | Logan Capital Management Inc | 279 | 0,00 | 6 | 0,00 | ||||
| 2025-09-09 | 13F | Cambridge Financial Group, LLC | 24 035 | 2,76 | 541 | 3,05 | ||||
| 2025-07-08 | 13F | Apella Capital, LLC | 175 439 | 80,65 | 3 925 | 80,41 | ||||
| 2025-08-14 | 13F | Financial Engines Advisors L.L.C. | 327 520 | −12,61 | 7 366 | −12,34 | ||||
| 2025-08-12 | 13F | Laurel Wealth Advisors LLC | 19 117 | 2 149,06 | 1 | −100,00 | ||||
| 2025-08-14 | 13F | Citadel Advisors Llc | 144 005 | −36,08 | 3 239 | −35,89 | ||||
| 2025-08-01 | 13F | Brinker Capital Investments, LLC | 0 | −100,00 | 0 | −100,00 | ||||
| 2025-07-11 | 13F | Farther Finance Advisors, LLC | 0 | −100,00 | 0 | |||||
| 2025-07-30 | 13F | Journey Advisory Group, LLC | 782 504 | 1,51 | 17 599 | 1,82 | ||||
| 2025-08-04 | 13F | Jim Saulnier & Associates, Llc | 87 976 | 27,69 | 1 979 | 28,11 | ||||
| 2025-08-06 | 13F | Modera Wealth Management, LLC | 38 982 | 38,45 | 877 | 38,83 | ||||
| 2025-08-12 | 13F | Nemes Rush Group LLC | 61 | 1,67 | 1 | 0,00 | ||||
| 2025-08-14 | 13F | Eight 31 Financial Llc | 272 652 | 1,74 | 6 132 | 2,05 | ||||
| 2025-07-24 | 13F | Moseley Investment Management Inc | 9 439 | 212 | ||||||
| 2025-07-24 | 13F | Stonebridge Financial Group, LLC | 20 631 | 0,16 | 464 | 0,65 | ||||
| 2025-07-15 | 13F | Highland Financial Advisors, LLC | 11 306 | 0,00 | 254 | 0,40 | ||||
| 2025-08-08 | 13F | Thoroughbred Financial Services, Llc | 67 374 | −18,28 | 2 | 0,00 | ||||
| 2025-08-11 | 13F | Aptus Capital Advisors, LLC | 2 820 | 1 900,00 | 63 | 2 000,00 | ||||
| 2025-04-22 | 13F | Mendota Financial Group, LLC | 0 | −100,00 | 0 | |||||
| 2025-07-08 | 13F | Gradient Investments LLC | 52 487 | 0,11 | 1 180 | 0,43 | ||||
| 2025-04-01 | 13F | Cornerstone Planning, LLC | 128 718 | 2 857 | ||||||
| 2025-08-18 | 13F | Hollencrest Capital Management | 570 | 13 | ||||||
| 2025-08-14 | 13F | Visionary Wealth Advisors | 11 538 | 259 | ||||||
| 2025-07-11 | 13F | First PREMIER Bank | 745 | −4,49 | 0 | |||||
| 2025-07-11 | 13F | Pinnacle Bancorp, Inc. | 27 197 | 0,00 | 612 | 0,33 | ||||
| 2025-08-08 | 13F | Gts Securities Llc | 0 | −100,00 | 0 | |||||
| 2025-07-17 | 13F | Oakworth Capital, Inc. | 699 | 0,00 | 16 | 0,00 | ||||
| 2025-08-11 | 13F | FSA Wealth Management LLC | 92 | 2 | ||||||
| 2025-07-29 | 13F | Stratos Wealth Advisors, LLC | 40 206 | 904 | ||||||
| 2025-08-14 | 13F | Mariner, LLC | 61 134 | 436,73 | 1 375 | 438,82 | ||||
| 2025-08-07 | 13F | Beese Fulmer Investment Management, Inc. | 9 064 | 204 | ||||||
| 2025-07-18 | 13F | Precision Wealth Strategies, LLC | 10 176 | 229 | ||||||
| 2025-07-08 | 13F | Lowe Wealth Advisors, LLC | 1 300 | 0,00 | 29 | 0,00 | ||||
| 2025-08-12 | 13F | Associated Banc-corp | 84 305 | 20,92 | 1 896 | 21,31 | ||||
| 2025-07-22 | 13F | Simplicity Wealth,LLC | 48 772 | 115,40 | 1 097 | 116,17 | ||||
| 2025-08-11 | 13F | Strategic Wealth Partners, Ltd. | 36 | 1 | ||||||
| 2025-07-22 | 13F | Berger Financial Group, Inc | 9 466 | 0,00 | 213 | 0,00 | ||||
| 2025-07-22 | 13F | Mascoma Wealth Management LLC | 11 484 | 0,00 | 258 | 0,39 | ||||
| 2025-08-14 | 13F | Comerica Bank | 11 226 | −0,12 | 252 | 0,40 | ||||
| 2025-08-08 | 13F | Summitry Llc | 0 | −100,00 | 0 | |||||
| 2025-08-11 | 13F | Actinver Wealth Management, Inc. | 15 702 | 8,61 | 353 | 8,95 | ||||
| 2025-08-14 | 13F | Connecticut Wealth Management, LLC | 12 845 | 289 | ||||||
| 2025-08-12 | 13F | Proequities, Inc. | 0 | 0 | ||||||
| 2025-08-14 | 13F | Ameriprise Financial Inc | 161 425 | 4,73 | 3 630 | 5,07 | ||||
| 2025-07-17 | 13F/A | Capital Investment Advisors, LLC | 748 226 | 2,25 | 16 828 | 2,57 | ||||
| 2025-08-13 | 13F | MONECO Advisors, LLC | 12 942 | 0,00 | 291 | 0,34 | ||||
| 2025-08-07 | 13F | Fagan Associates, Inc. | 301 984 | −2,34 | 6 792 | −2,03 | ||||
| 2025-08-14 | 13F | Fmr Llc | 0 | −100,00 | 0 | |||||
| 2025-07-31 | 13F | Resonant Capital Advisors, LLC | 11 483 | 0,00 | 258 | 0,39 | ||||
| 2025-07-24 | 13F | Ronald Blue Trust, Inc. | 879 | 58,95 | 20 | 58,33 | ||||
| 2025-07-31 | 13F | GLOBALT Investments LLC / GA | 2 883 167 | −2,14 | 64 842 | −1,84 | ||||
| 2025-08-07 | 13F | Kestra Private Wealth Services, Llc | 24 976 | 35,19 | 562 | 35,51 | ||||
| 2025-07-28 | 13F | Harbour Investments, Inc. | 18 056 | 31,14 | 406 | 31,82 | ||||
| 2025-07-25 | 13F | Cwm, Llc | 65 529 | 11,04 | 1 | 0,00 | ||||
| 2025-07-11 | 13F | Trinity Wealth Management, LLC | 14 866 | 0,00 | 334 | 0,30 | ||||
| 2025-07-18 | 13F | Northstar Group, Inc. | 268 398 | 47,25 | 6 036 | 47,72 | ||||
| 2025-08-05 | 13F | Cherry Tree Wealth Management, LLC | 5 638 | 10,53 | 127 | 10,53 | ||||
| 2025-08-13 | 13F | Jones Financial Companies Lllp | 0 | −100,00 | 0 | |||||
| 2025-08-04 | 13F | Creative Financial Designs Inc /adv | 488 | −20,52 | 11 | −23,08 | ||||
| 2025-08-07 | 13F | CENTRAL TRUST Co | 324 827 | 5,17 | 7 305 | 5,50 | ||||
| 2025-08-14 | 13F | STAR Financial Bank | 93 867 | 10,76 | 2 111 | 11,11 | ||||
| 2025-07-08 | 13F | Legacy Private Trust Co. | 485 458 | 0,27 | 10 918 | 0,57 | ||||
| 2025-08-15 | 13F | CI Private Wealth, LLC | 9 074 | −44,15 | 204 | −43,96 | ||||
| 2025-04-22 | 13F | Synergy Financial Management, LLC | 0 | −100,00 | 0 | |||||
| 2025-08-11 | 13F | TD Waterhouse Canada Inc. | 0 | −100,00 | 0 | |||||
| 2025-07-24 | 13F | IFP Advisors, Inc | 145 937 | 2,20 | 3 282 | 2,53 | ||||
| 2025-07-31 | 13F | Blake Schutter Theil Wealth Advisors, LLC | 24 021 | 0,00 | 540 | 0,37 | ||||
| 2025-07-21 | 13F | Cliftonlarsonallen Wealth Advisors, Llc | 446 695 | 19,67 | 10 046 | 20,05 | ||||
| 2025-07-29 | 13F | International Assets Investment Management, Llc | 9 145 | 0,00 | 206 | 0,00 | ||||
| 2025-08-11 | 13F | CFS Investment Advisory Services, LLC | 17 514 | −1,64 | 0 | |||||
| 2025-08-12 | 13F | Global Retirement Partners, LLC | 13 095 | 1,29 | 294 | 2,80 | ||||
| 2025-07-22 | 13F | Belpointe Asset Management LLC | 21 422 | 482 | ||||||
| 2025-08-07 | 13F | Parkside Financial Bank & Trust | 691 | 16 | ||||||
| 2025-07-23 | 13F | High Note Wealth, LLC | 400 | 9 | ||||||
| 2025-08-01 | 13F | Schmidt P J Investment Management Inc | 10 531 | 237 | ||||||
| 2025-08-13 | 13F | Cary Street Partners Financial Llc | 34 096 | −3,87 | 767 | −3,65 | ||||
| 2025-07-28 | 13F | Duncker Streett & Co Inc | 26 588 | 0,00 | 598 | 0,17 | ||||
| 2025-08-14 | 13F | Snowden Capital Advisors LLC | 333 908 | 0,15 | 7 510 | 0,45 | ||||
| 2025-08-13 | 13F | Portland Global Advisors LLC | 114 149 | 7,03 | 2 567 | 7,36 | ||||
| 2025-08-11 | 13F | Private Advisor Group, LLC | 17 844 | −1,68 | 401 | −1,23 | ||||
| 2025-08-15 | 13F | Equitable Holdings, Inc. | 31 628 | 3,57 | 711 | 3,95 | ||||
| 2025-07-25 | 13F | NorthRock Partners, LLC | 0 | −100,00 | 0 | |||||
| 2025-07-30 | 13F | Phillips Financial Management, Llc | 8 965 | −33,82 | 202 | −33,66 | ||||
| 2025-07-21 | 13F | Barrett & Company, Inc. | 33 613 | 0,00 | 756 | 0,27 | ||||
| 2025-07-29 | 13F | Straight Path Wealth Management | 22 776 | 6,10 | 512 | 6,44 | ||||
| 2025-07-29 | 13F | Private Trust Co Na | 3 366 | 0,00 | 76 | 0,00 | ||||
| 2025-07-23 | 13F | Evexia Wealth Llc | 23 820 | −59,53 | 534 | −59,56 | ||||
| 2025-08-08 | 13F | TD Capital Management LLC | 2 075 | 1,02 | 47 | 0,00 | ||||
| 2025-08-14 | 13F | Royal Bank Of Canada | 535 727 | −13,94 | 12 049 | −13,66 | ||||
| 2025-07-22 | 13F | Autumn Glory Partners, LLC | 12 369 | −2,21 | 278 | −1,77 | ||||
| 2025-07-14 | 13F | Kfg Wealth Management, Llc | 14 353 | 8,78 | 323 | 9,15 | ||||
| 2025-08-08 | 13F | Pnc Financial Services Group, Inc. | 26 439 | 0,00 | 595 | 0,34 | ||||
| 2025-08-14 | 13F | Kovitz Investment Group Partners, LLC | 694 099 | 7,54 | 15 610 | 7,87 | ||||
| 2025-07-10 | 13F | Wealth Enhancement Advisory Services, Llc | 595 846 | −0,19 | 13 329 | −0,41 | ||||
| 2025-07-09 | 13F | Krilogy Financial LLC | 460 867 | 0,96 | 10 365 | 1,27 | ||||
| 2025-08-12 | 13F | CIBC Private Wealth Group, LLC | 700 | 0,00 | 16 | 0,00 | ||||
| 2025-07-29 | 13F | Carmel Capital Partners, LLC | 81 500 | 1 833 | ||||||
| 2025-07-16 | 13F | Rebalance, Llc | 171 673 | 141,32 | 3 861 | 142,16 | ||||
| 2025-07-21 | 13F | Crews Bank & Trust | 17 960 | 6,75 | 404 | 6,90 | ||||
| 2025-07-31 | 13F | Leavell Investment Management, Inc. | 140 820 | 21,91 | 3 167 | 22,33 | ||||
| 2025-08-11 | 13F | Midwest Professional Planners, LTD. | 132 541 | 50,01 | 2 981 | 50,51 | ||||
| 2025-08-06 | 13F | Cannon Financial Strategists, Inc. | 62 973 | 0,97 | 1 416 | 1,29 | ||||
| 2025-08-07 | 13F | Montag A & Associates Inc | 12 865 | 0,00 | 289 | 0,35 | ||||
| 2025-08-14 | 13F | Bank Of America Corp /de/ | 3 467 375 | 29,01 | 77 981 | 29,41 | ||||
| 2025-07-29 | 13F | Accretive Wealth Partners, LLC | 144 978 | 6,93 | 3 261 | 7,27 | ||||
| 2025-07-15 | 13F | Retireful, LLC | 133 060 | 2 993 | ||||||
| 2025-07-30 | 13F | Brookstone Capital Management | 9 220 | 207 | ||||||
| 2025-07-24 | 13F | Riverchase Wealth Management, Llc | 31 929 | 6,94 | 718 | 7,32 | ||||
| 2025-07-30 | 13F | Avidian Wealth Solutions, LLC | 10 970 | 247 | ||||||
| 2025-08-05 | 13F | Sigma Planning Corp | 44 256 | 1,35 | 995 | 1,74 | ||||
| 2025-07-01 | 13F | Confluence Investment Management Llc | 467 115 | −0,71 | 10 505 | −0,40 | ||||
| 2025-07-30 | 13F | DecisionMap Wealth Management, LLC | 11 563 | 260 | ||||||
| 2025-08-08 | 13F | Mv Capital Management, Inc. | 604 366 | 2,51 | 13 592 | 2,84 | ||||
| 2025-07-24 | 13F | Lokken Investment Group LLC | 9 335 | 210 | ||||||
| 2025-07-25 | 13F | Stephens Consulting, LLC | 334 | 0,00 | 8 | 0,00 | ||||
| 2025-08-07 | 13F | Rossmore Private Capital | 9 014 | 0,00 | 203 | 0,00 | ||||
| 2025-08-12 | 13F | Jpmorgan Chase & Co | 15 264 | 343 | ||||||
| 2025-07-11 | 13F | Lantz Financial LLC | 117 662 | 17,41 | 2 646 | 17,81 | ||||
| 2025-07-21 | 13F | Asset Advisors Investment Management, LLC | 468 057 | 44,51 | 10 527 | 44,97 | ||||
| 2025-07-30 | 13F | D.a. Davidson & Co. | 153 300 | 25,19 | 3 448 | 25,57 | ||||
| 2025-07-30 | 13F | Probity Advisors, Inc. | 234 722 | −14,82 | 5 279 | −14,55 | ||||
| 2025-08-15 | 13F | Kestra Advisory Services, LLC | 33 383 | −5,05 | 751 | −4,82 | ||||
| 2025-08-12 | 13F | PSI Advisors, LLC | 0 | −100,00 | 0 | |||||
| 2025-07-24 | 13F | Costello Asset Management, INC | 9 552 | −29,83 | 215 | −29,84 | ||||
| 2025-08-14 | 13F | Hrt Financial Lp | 0 | −100,00 | 0 | |||||
| 2025-08-01 | 13F | Signature Wealth Management Group | 23 461 | −1,68 | 528 | −1,50 | ||||
| 2025-08-12 | 13F | Coldstream Capital Management Inc | 32 645 | 0,00 | 734 | 0,41 | ||||
| 2025-08-14 | 13F | Obsidian Personal Planning Solutions LLC | 361 985 | 15,22 | 8 141 | 14,82 | ||||
| 2025-08-01 | 13F | Transcend Wealth Collective, Llc | 40 318 | 0,00 | 907 | 0,33 | ||||
| 2025-07-18 | 13F | Consolidated Portfolio Review Corp | 42 547 | 8,34 | 957 | 8,64 | ||||
| 2025-08-01 | 13F | Austin Private Wealth, LLC | 54 445 | 16,45 | 1 224 | 16,79 | ||||
| 2025-04-25 | 13F | Altus Wealth Group LLC | 0 | −100,00 | 0 | −100,00 | ||||
| 2025-08-14 | 13F | AllSquare Wealth Management LLC | 31 726 | 0,00 | 714 | 0,28 | ||||
| 2025-05-12 | 13F | Kohmann Bosshard Financial Services, LLC | 0 | −100,00 | 0 | |||||
| 2025-08-14 | 13F | Modern Wealth Management, LLC | 15 514 | 349 | ||||||
| 2025-08-04 | 13F | Assetmark, Inc | 631 | 14 | ||||||
| 2025-08-11 | 13F | Independent Advisor Alliance | 12 538 | 15,71 | 282 | 16,12 | ||||
| 2025-07-11 | 13F | Shelton Wealth Management, Llc | 336 748 | 4,72 | 7 573 | 5,05 | ||||
| 2025-07-31 | 13F | Oppenheimer & Co Inc | 45 344 | 0,20 | 1 020 | 0,49 |