Grundläggande statistik
| Institutionella ägare | 167 total, 167 long only, 0 short only, 0 long/short - change of −2,34% MRQ |
| Genomsnittlig portföljallokering | 0.4834 % - change of −1,44% MRQ |
| Institutionella aktier (lång) | 27 849 495 (ex 13D/G) - change of −1,61MM shares −5,47% MRQ |
| Institutionellt värde (lång) | $ 878 132 USD ($1000) |
Institutionellt ägande och aktieägare
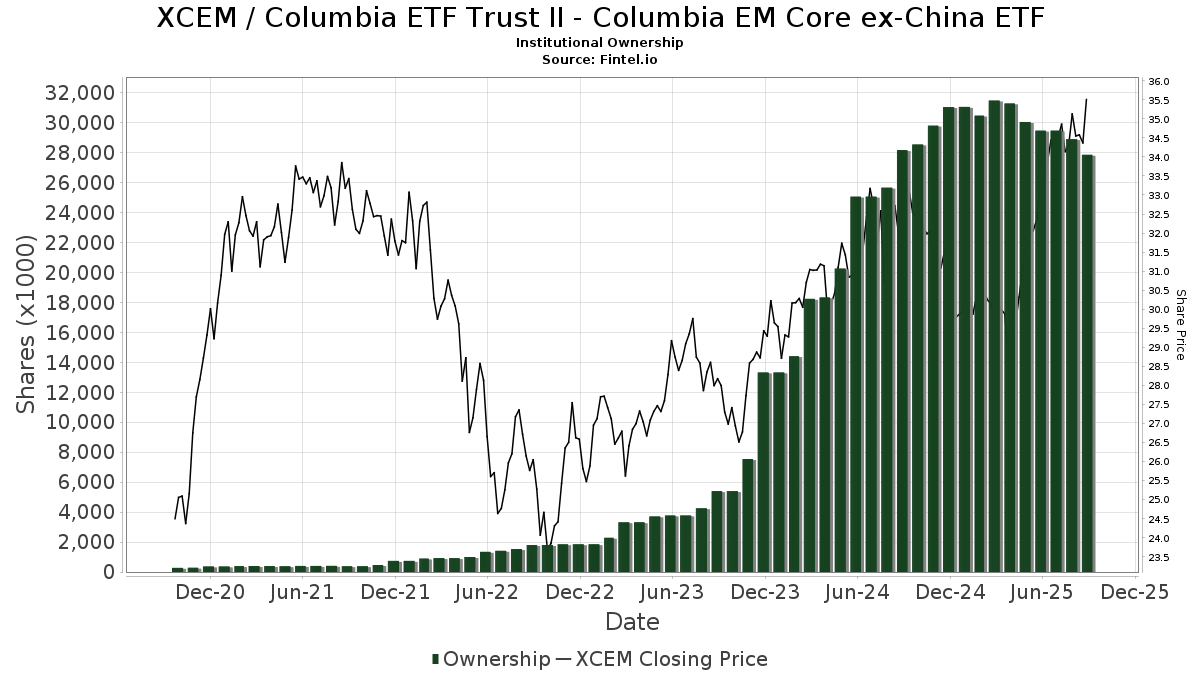
Columbia ETF Trust II - Columbia EM Core ex-China ETF (US:XCEM) har 167 Institutionella ägare och aktieägare som har lämnat in 13D/G- eller 13F-formulär till Securities Exchange Commission (SEC). Dessa institut innehar totalt 27,849,495 aktier. Största aktieägare inkluderar Morgan Stanley, Bank Of America Corp /de/, Northwestern Mutual Wealth Management Co, Penserra Capital Management LLC, LPL Financial LLC, TBFG - The Brinsmere Fund - Growth ETF, Marotta Asset Management, Raymond James Financial Inc, Flaharty Asset Management, LLC, and O'Brien Wealth Partners LLC .
Columbia ETF Trust II - Columbia EM Core ex-China ETF (ARCA:XCEM) Institutionell ägarstruktur visar institutioners och fonders nuvarande positioner i företaget, samt de senaste förändringarna i positionernas storlek. Större aktieägare kan vara enskilda investerare, fonder, hedgefonder eller institutioner. Bilaga 13D visar att investeraren äger (eller ägde) mer än 5% av företaget och avser (eller avsåg) att aktivt eftersträva en förändring av affärsstrategin. Schedule 13G indikerar en passiv investering på över 5%.
The share price as of September 10, 2025 is 35,51 / share. Previously, on September 10, 2024, the share price was 31,68 / share. This represents an increase of 12,09% over that period.
Fondsentimentets poäng
Fondsentimentet poängen(fka Ägarackumulation-poäng) visar vilka aktier som är mest köpta av fonder. Det är resultatet av en sofistikerad kvantitativ flerfaktormodell som identifierar företag med de högsta nivåerna av institutionell ackumulering. Poängsättningsmodellen använder en kombination av den totala ökningen av redovisade ägare, förändringarna i portföljallokeringarna för dessa ägare och andra mått. Siffran sträcker sig från 0 till 100, där högre siffror indikerar en högre nivå av ackumulering i förhållande till sina konkurrenter, och 50 är genomsnittet.
Uppdateringsfrekvens: Dagligen
Se Ownership Explorer, som innehåller en lista över de högst rankade företagen.
Institutionell sälj/köp-kvot
Förutom att rapportera vanliga eget kapital- och skuldemissioner måste institutioner med mer än 100MM tillgångar under förvaltning också avslöja sina innehav av sälj- och köpoptioner. Eftersom säljoptioner i allmänhet indikerar ett negativt sentiment och köpoptioner indikerar ett positivt sentiment, kan vi få en uppfattning om det övergripande institutionella sentimentet genom att plotta förhållandet mellan säljoptioner och köpoptioner. Diagrammet till höger visar det historiska förhållandet mellan sälj- och köpoptioner för detta instrument.
Genom att använda sälj/köp-kvoten som en indikator på aktieägarnas sentiment undviker man en av de största bristerna med att använda det totala institutionella ägandet, nämligen att en betydande del av de förvaltade tillgångarna investeras passivt för att följa index. Passivt förvaltade fonder köper vanligtvis inte optioner, så indikatorn för sälj/köp-kvoten ger en bättre bild av stämningen i aktivt förvaltade fonder.
13F- och NPORT-arkiveringar
Detaljer om 13F-arkiveringar är gratis. Detaljer om NP-arkiveringar kräver ett premiummedlemskap. Gröna rader indikerar nya positioner. Röda rader indikerar stängda positioner. Klicka på länk symbolen för att se hela transaktionshistoriken.
Uppgradera
för att låsa upp premiumdata och exportera till Excel ![]() .
.
| Fil Datum | Källa | Investerare | Typ | Genomsnittligt pris (beräknat) |
Aktier | Δ Aktier (%) |
Rapporterat värde (1000 USD) |
Δ Värde (%) |
Portföljallokering (%) |
|
|---|---|---|---|---|---|---|---|---|---|---|
| 2025-07-11 | 13F | Pinnacle Bancorp, Inc. | 1 816 | 0,00 | 62 | 16,98 | ||||
| 2025-08-14 | 13F | Royal Bank Of Canada | 6 636 | −85,46 | 227 | −83,16 | ||||
| 2025-08-13 | 13F | Northwestern Mutual Wealth Management Co | 1 604 767 | 192,92 | 54 851 | 239,00 | ||||
| 2025-08-14 | 13F | Jane Street Group, Llc | 229 428 | −52,61 | 7 842 | −45,16 | ||||
| 2025-04-25 | 13F | Avidian Wealth Solutions, LLC | 0 | −100,00 | 0 | |||||
| 2025-08-06 | 13F | O'Dell Group, LLC | 243 700 | −1,14 | 8 330 | 14,41 | ||||
| 2025-08-14 | 13F | Mml Investors Services, Llc | 7 418 | −19,99 | 0 | |||||
| 2025-07-25 | 13F | Retirement Planning Group, Llc / Ny | 12 893 | 2,14 | 441 | 18,28 | ||||
| 2025-07-08 | 13F | Richard P Slaughter Associates Inc | 190 789 | 5,06 | 6 521 | 21,59 | ||||
| 2025-08-08 | 13F | Avantax Advisory Services, Inc. | 12 908 | 13,02 | 441 | 30,86 | ||||
| 2025-07-30 | 13F | D.a. Davidson & Co. | 132 466 | −13,19 | 4 528 | 0,47 | ||||
| 2025-08-14 | 13F | Comerica Bank | 2 913 | −32,48 | 100 | −22,05 | ||||
| 2025-08-14 | 13F | Old Mission Capital Llc | 9 993 | −98,20 | 342 | −97,92 | ||||
| 2025-08-05 | 13F | Sigma Planning Corp | 30 484 | 28,80 | 1 042 | 48,93 | ||||
| 2025-07-22 | 13F | Belpointe Asset Management LLC | 45 048 | 1 540 | ||||||
| 2025-07-10 | 13F | Focus Financial Network, Inc. | 90 278 | 3,41 | 3 086 | 19,67 | ||||
| 2025-08-14 | 13F | Tennessee Valley Asset Management Partners | 0 | −100,00 | 0 | |||||
| 2025-08-14 | 13F/A | Rockefeller Capital Management L.P. | 66 318 | 22,31 | 2 267 | 41,54 | ||||
| 2025-08-06 | 13F | Commonwealth Equity Services, Llc | 571 374 | −10,39 | 20 | 5,56 | ||||
| 2025-08-14 | 13F | Graney & King, LLC | 1 087 | 0,00 | 37 | 15,63 | ||||
| 2025-08-05 | 13F | GPS Wealth Strategies Group, LLC | 20 294 | 22,50 | 694 | 41,72 | ||||
| 2025-08-12 | 13F | Main Management LLC | 125 | 0,00 | 0 | |||||
| 2025-04-30 | 13F | Ridgeline Wealth Planning, LLC | 0 | −100,00 | 0 | |||||
| 2025-08-13 | 13F | Vertex Planning Partners, LLC | 99 846 | −0,20 | 3 413 | 15,50 | ||||
| 2025-08-11 | 13F | Private Advisor Group, LLC | 149 448 | −9,14 | 5 108 | 5,17 | ||||
| 2025-08-19 | 13F | Advisory Services Network, LLC | 20 006 | −11,74 | 682 | 1,94 | ||||
| 2025-08-06 | 13F | Golden State Wealth Management, LLC | 816 | 0,00 | 28 | 12,50 | ||||
| 2025-07-17 | 13F | Halbert Hargrove Global Advisors, Llc | 5 136 | 176 | ||||||
| 2025-07-17 | 13F | KWB Wealth | 204 916 | −24,85 | 6 052 | −25,02 | ||||
| 2025-07-30 | 13F | Bogart Wealth, LLC | 900 | 0,00 | 31 | 15,38 | ||||
| 2025-07-24 | 13F | MA Private Wealth | 575 267 | −18,53 | 19 663 | −5,72 | ||||
| 2025-08-19 | 13F | National Asset Management, Inc. | 0 | −100,00 | 0 | |||||
| 2025-09-04 | 13F/A | Advisor Group Holdings, Inc. | 175 053 | −0,16 | 5 983 | 15,55 | ||||
| 2025-07-31 | 13F | CAP Partners, LLC | 0 | −100,00 | 0 | |||||
| 2025-08-11 | 13F | Advisor Resource Council | 0 | −100,00 | 0 | |||||
| 2025-08-01 | 13F | Koss-Olinger Consulting, LLC | 14 091 | −2,62 | 482 | 12,65 | ||||
| 2025-08-12 | 13F | SRS Capital Advisors, Inc. | 1 072 | −87,94 | 37 | −86,26 | ||||
| 2025-08-07 | 13F | McClarren Financial Advisors, Inc. | 0 | −100,00 | 0 | |||||
| 2025-07-23 | 13F | Watershed Private Wealth Llc | 80 351 | −48,94 | 2 746 | −40,91 | ||||
| 2025-07-29 | 13F | Private Trust Co Na | 610 | 46,99 | 21 | 66,67 | ||||
| 2025-08-14 | 13F | First Foundation Advisors | 246 547 | −21,43 | 8 427 | −9,09 | ||||
| 2025-08-11 | 13F | United Advisor Group, LLC | 55 478 | 19,14 | 1 896 | 37,89 | ||||
| 2025-08-13 | 13F | EverSource Wealth Advisors, LLC | 3 783 | 129 | ||||||
| 2025-08-26 | 13F/A | Thrivent Financial For Lutherans | 18 510 | 21,33 | 1 | |||||
| 2025-08-14 | 13F | Ameriprise Financial Inc | 291 840 | 468,84 | 9 975 | 557,98 | ||||
| 2025-08-14 | 13F | Syon Capital Llc | 451 576 | 8,92 | 15 435 | 26,04 | ||||
| 2025-08-12 | 13F | Planning Alternatives Ltd /adv | 324 394 | −0,54 | 11 088 | 15,09 | ||||
| 2025-07-29 | 13F | Activest Wealth Management | 0 | 0 | ||||||
| 2025-07-22 | 13F | Merit Financial Group, LLC | 36 694 | −15,21 | 1 254 | −1,88 | ||||
| 2025-07-24 | 13F | Eastern Bank | 53 748 | −12,03 | 1 837 | 1,83 | ||||
| 2025-07-25 | 13F | Northwest Capital Management Inc | 51 145 | −46,34 | 1 748 | −37,90 | ||||
| 2025-08-14 | 13F | Fmr Llc | 18 049 | −10,06 | 617 | 4,05 | ||||
| 2025-08-12 | 13F | Proequities, Inc. | 0 | 0 | ||||||
| 2025-08-08 | 13F | RAM Investment Partners, LLC | 0 | −100,00 | 0 | |||||
| 2025-08-25 | NP | IETFX - Morningstar Income and Growth ETF Asset Allocation Portfolio Class II | 14 930 | −10,30 | 510 | 3,87 | ||||
| 2025-08-25 | NP | BETFX - Morningstar Balanced ETF Asset Allocation Portfolio Class I | 75 025 | −28,97 | 2 564 | −17,79 | ||||
| 2025-04-24 | 13F | Wingate Wealth Advisors, Inc. | 0 | −100,00 | 0 | |||||
| 2025-08-18 | 13F | Arq Wealth Advisors, Llc | 132 419 | 0,00 | 3 911 | 0,00 | ||||
| 2025-07-25 | 13F | Gw Henssler & Associates Ltd | 14 800 | 0,00 | 506 | 15,56 | ||||
| 2025-08-14 | 13F | Susquehanna International Group, Llp | 25 467 | −91,49 | 870 | −90,15 | ||||
| 2025-07-21 | 13F | Fortis Capital Advisors, LLC | 45 048 | 1 540 | ||||||
| 2025-08-13 | 13F | Twin Peaks Wealth Advisors, LLC | 1 623 | 57 | ||||||
| 2025-08-12 | 13F | AlphaCore Capital LLC | 174 300 | 1,92 | 5 958 | 17,94 | ||||
| 2025-07-14 | 13F | Armstrong Advisory Group, Inc | 2 542 | 87 | ||||||
| 2025-08-11 | 13F | Aptus Capital Advisors, LLC | 165 093 | 3,04 | 5 643 | 19,23 | ||||
| 2025-07-16 | 13F | Pacific Sage Partners, LLC | 9 093 | 23,09 | 311 | 42,20 | ||||
| 2025-08-11 | 13F | Principal Securities, Inc. | 8 715 | 22,09 | 298 | 40,76 | ||||
| 2025-08-08 | 13F | New England Capital Financial Advisors LLC | 105 190 | 0,68 | 3 595 | 16,53 | ||||
| 2025-08-14 | 13F | GWM Advisors LLC | 43 625 | 7,13 | 1 491 | 24,04 | ||||
| 2025-08-14 | 13F | CoreCap Advisors, LLC | 34 365 | −2,55 | 1 174 | 12,78 | ||||
| 2025-07-31 | 13F | Leavell Investment Management, Inc. | 168 346 | 47,99 | 5 754 | 71,30 | ||||
| 2025-07-24 | 13F | McKinley Carter Wealth Services, Inc. | 233 358 | 112,56 | 7 976 | 146,02 | ||||
| 2025-07-15 | 13F | Highland Financial Advisors, LLC | 154 485 | −4,08 | 5 280 | 11,02 | ||||
| 2025-05-15 | 13F | Hrt Financial Lp | 0 | −100,00 | 0 | |||||
| 2025-07-15 | 13F | McAdam, LLC | 8 588 | −30,87 | 294 | −19,95 | ||||
| 2025-08-12 | 13F | Change Path, LLC | 21 147 | −2,76 | 723 | 12,46 | ||||
| 2025-07-09 | 13F | Krilogy Financial LLC | 123 229 | 2,12 | 4 212 | 18,15 | ||||
| 2025-08-05 | 13F | Mission Wealth Management, Lp | 7 431 | −4,08 | 254 | 10,96 | ||||
| 2025-08-01 | 13F | Envestnet Asset Management Inc | 95 127 | 172,95 | 3 251 | 215,94 | ||||
| 2025-08-05 | 13F | Telos Capital Management, Inc. | 21 058 | −6,54 | 720 | 8,12 | ||||
| 2025-08-06 | 13F | Nicholas Hoffman & Company, LLC. | 25 685 | 53,60 | 878 | 77,89 | ||||
| 2025-08-06 | 13F | Prospera Financial Services Inc | 80 028 | 3,04 | 2 735 | 19,28 | ||||
| 2025-08-13 | 13F | Legacy Capital Wealth Partners, LLC | 0 | −100,00 | 0 | |||||
| 2025-05-14 | 13F | Flow Traders U.s. Llc | 0 | −100,00 | 0 | |||||
| 2025-08-05 | 13F | Scarborough Advisors, LLC | 39 424 | 11,10 | 1 348 | 28,53 | ||||
| 2025-08-11 | 13F | Alps Advisors Inc | 410 990 | −32,74 | 14 048 | −22,16 | ||||
| 2025-04-30 | 13F | Valeo Financial Advisors, LLC | 0 | −100,00 | 0 | |||||
| 2025-05-12 | 13F | Quantinno Capital Management LP | 0 | −100,00 | 0 | |||||
| 2025-07-09 | 13F | O'Brien Wealth Partners LLC | 747 975 | 49,53 | 25 566 | 73,04 | ||||
| 2025-07-14 | 13F | U.S. Capital Wealth Advisors, LLC | 71 429 | −33,57 | 2 441 | −23,12 | ||||
| 2025-08-05 | 13F | Snider Financial Group | 15 564 | 8,92 | 532 | 25,83 | ||||
| 2025-08-14 | 13F | Diversify Advisory Services, LLC | 37 554 | 4,49 | 1 315 | 21,09 | ||||
| 2025-04-30 | 13F | Stonebrook Private Inc. | 0 | −100,00 | 0 | |||||
| 2025-08-14 | 13F | Principia Wealth Advisory, LLC | 84 | 0,00 | 3 | 0,00 | ||||
| 2025-07-09 | 13F | WealthCare Investment Partners, LLC | 66 231 | −26,63 | 2 301 | −12,18 | ||||
| 2025-08-14 | 13F | Bank Of America Corp /de/ | 2 817 275 | 1,62 | 96 294 | 17,61 | ||||
| 2025-08-04 | 13F | Amplius Wealth Advisors, LLC | 13 467 | −41,93 | 460 | −32,75 | ||||
| 2025-07-22 | 13F | Miracle Mile Advisors, LLC | 24 589 | −20,39 | 840 | −7,89 | ||||
| 2025-08-08 | 13F | Cetera Investment Advisers | 123 498 | 0,49 | 4 221 | 16,31 | ||||
| 2025-07-24 | 13F | IFP Advisors, Inc | 103 | 0,00 | 4 | 0,00 | ||||
| 2025-07-21 | 13F | Ameritas Advisory Services, LLC | 1 320 | 45 | ||||||
| 2025-08-14 | 13F | Redwood Financial Network Corp | 19 738 | 3,44 | 675 | 19,72 | ||||
| 2025-07-14 | 13F | Abound Wealth Management | 509 | 0,00 | 17 | 13,33 | ||||
| 2025-07-21 | 13F | DHJJ Financial Advisors, Ltd. | 34 | 0,00 | 1 | 0,00 | ||||
| 2025-08-05 | 13F | Sebold Capital Management, Inc. | 99 601 | −4,27 | 3 404 | 10,77 | ||||
| 2025-07-25 | 13F | ONE Advisory Partners, LLC | 10 842 | −92,43 | 378 | −91,08 | ||||
| 2025-07-31 | 13F | SoundView Advisors Inc. | 47 542 | 0,91 | 2 | 0,00 | ||||
| 2025-07-08 | 13F | Prism Advisors, Inc. | 553 088 | −30,31 | 18 905 | −19,35 | ||||
| 2025-07-17 | 13F | Janney Montgomery Scott LLC | 76 118 | −3,68 | 3 | 0,00 | ||||
| 2025-08-13 | 13F | Alerus Financial Na | 1 337 | 46 | ||||||
| 2025-08-12 | 13F | Gladstone Institutional Advisory LLC | 126 097 | 17,66 | 4 310 | 36,18 | ||||
| 2025-08-08 | 13F | Flaharty Asset Management, LLC | 789 437 | 1,22 | 26 983 | 17,13 | ||||
| 2025-07-22 | 13F | Wealthcare Advisory Partners LLC | 191 962 | 2,93 | 6 561 | 19,12 | ||||
| 2025-08-12 | 13F | CIBC Private Wealth Group, LLC | 19 277 | −0,65 | 659 | 27,27 | ||||
| 2025-08-14 | 13F | Atomi Financial Group, Inc. | 8 801 | 301 | ||||||
| 2025-08-25 | NP | GETFX - Morningstar Growth ETF Asset Allocation Portfolio Class I | 164 755 | −37,85 | 5 631 | −28,07 | ||||
| 2025-07-11 | 13F | Farther Finance Advisors, LLC | 22 425 | −79,85 | 766 | −76,89 | ||||
| 2025-07-28 | 13F | Kiker Wealth Management, LLC | 0 | −100,00 | 0 | |||||
| 2025-08-11 | 13F | Citigroup Inc | 4 753 | 162 | ||||||
| 2025-08-12 | 13F | Quadcap Wealth Management, LLC | 58 138 | 4,15 | 1 987 | 20,57 | ||||
| 2025-05-05 | 13F | Jackson Creek Investment Advisors LLC | 0 | −100,00 | 0 | |||||
| 2025-07-14 | 13F | LaFleur & Godfrey LLC | 12 867 | −0,73 | 440 | 14,92 | ||||
| 2025-07-23 | 13F | Heck Capital Advisors, LLC | 0 | −100,00 | 0 | |||||
| 2025-04-28 | 13F | Redmont Wealth Advisors Llc | 18 896 | 0,00 | 558 | −0,18 | ||||
| 2025-07-14 | 13F | Buttonwood Financial Group, LLC | 0 | −100,00 | 0 | |||||
| 2025-07-28 | 13F | RFG Advisory, LLC | 15 685 | 536 | ||||||
| 2025-08-05 | 13F | Westside Investment Management, Inc. | 4 724 | 1,40 | 161 | 17,52 | ||||
| 2025-08-14 | 13F | Goldman Sachs Group Inc | 0 | −100,00 | 0 | |||||
| 2025-08-14 | 13F | Guardian Wealth Advisors, Llc / Nc | 165 093 | 3,04 | 5 643 | 19,23 | ||||
| 2025-07-18 | 13F | BSW Wealth Partners | 8 278 | 5,29 | 283 | 21,55 | ||||
| 2025-08-25 | NP | AGTFX - Morningstar Aggressive Growth ETF Asset Allocation Portfolio Class I | 156 280 | −30,13 | 5 342 | −19,15 | ||||
| 2025-08-11 | 13F | Greykasell Wealth Strategies, Inc. | 0 | −100,00 | 0 | |||||
| 2025-07-25 | 13F | Cwm, Llc | 54 532 | −42,79 | 2 | −50,00 | ||||
| 2025-07-31 | 13F | Cambridge Investment Research Advisors, Inc. | 9 904 | 1,90 | 0 | |||||
| 2025-07-09 | 13F | Brand Asset Management Group, Inc. | 21 904 | 0,00 | 749 | 15,79 | ||||
| 2025-08-06 | 13F | Stone House Investment Management, LLC | 660 | −91,01 | 23 | −89,81 | ||||
| 2025-08-14 | 13F | Oxford Financial Group Ltd | 17 175 | 0,00 | 587 | 15,78 | ||||
| 2025-07-08 | 13F | First National Corp /ma/ /adv | 98 857 | 3,02 | 3 379 | 19,20 | ||||
| 2025-08-12 | 13F | Jpmorgan Chase & Co | 27 362 | −89,12 | 935 | −87,42 | ||||
| 2025-07-08 | 13F | Ehrlich Financial Group | 8 150 | −92,08 | 279 | −90,85 | ||||
| 2025-07-10 | 13F | Fortress Wealth Management, Inc. | 8 142 | −52,70 | 278 | −45,28 | ||||
| 2025-08-04 | 13F | Savvy Advisors, Inc. | 236 697 | −2,04 | 8 090 | 13,37 | ||||
| 2025-08-07 | 13F | Legacy Financial Advisors, Inc. | 34 455 | 127,98 | 1 178 | 163,90 | ||||
| 2025-08-15 | 13F | Kestra Advisory Services, LLC | 54 742 | 39,95 | 1 871 | 61,99 | ||||
| 2025-08-14 | 13F | McIlrath & Eck, LLC | 18 168 | 525,62 | 621 | 629,41 | ||||
| 2025-08-14 | 13F | Raymond James Financial Inc | 856 800 | −1,78 | 29 285 | 13,66 | ||||
| 2025-07-30 | 13F | Exencial Wealth Advisors, Llc | 79 226 | −2,64 | 2 708 | 12,65 | ||||
| 2025-07-16 | 13F | MKT Advisors LLC | 0 | −100,00 | 0 | |||||
| 2025-08-14 | 13F | Qube Research & Technologies Ltd | 7 942 | 10,97 | 271 | 28,44 | ||||
| 2025-08-26 | NP | TBFC - The Brinsmere Fund - Conservative ETF | 375 720 | 6,74 | 12 842 | 23,53 | ||||
| 2025-08-11 | 13F | Tidemark, LLC | 108 | −54,62 | 4 | −57,14 | ||||
| 2025-08-07 | 13F | CENTRAL TRUST Co | 306 581 | 1,31 | 10 479 | 17,24 | ||||
| 2025-07-07 | 13F | Centurion Wealth Management LLC | 0 | −100,00 | 0 | |||||
| 2025-07-17 | 13F | Beacon Capital Management, LLC | 0 | −100,00 | 0 | |||||
| 2025-08-07 | 13F | Hennion & Walsh Asset Management, Inc. | 649 375 | 1,18 | 22 196 | 17,09 | ||||
| 2025-07-17 | 13F | Coastline Trust Co | 31 276 | −3,59 | 1 069 | 11,59 | ||||
| 2025-08-12 | 13F | LPL Financial LLC | 989 110 | −20,44 | 33 808 | −7,93 | ||||
| 2025-08-12 | 13F | Atlas Capital Advisors Llc | 3 639 | 0,00 | 124 | 15,89 | ||||
| 2025-07-09 | 13F | Breakwater Capital Group | 183 340 | −11,39 | 6 267 | 2,55 | ||||
| 2025-08-14 | 13F | UBS Group AG | 481 609 | −5,36 | 16 461 | 9,53 | ||||
| 2025-08-05 | 13F | Sheridan Capital Management, LLC | 0 | −100,00 | 0 | |||||
| 2025-08-14 | 13F | Citadel Advisors Llc | 6 670 | −50,38 | 228 | −42,82 | ||||
| 2025-07-23 | 13F | Nelson Capital Management, LLC | 145 076 | 4 959 | ||||||
| 2025-08-14 | 13F | Colony Group, LLC | 186 594 | 5,28 | 6 378 | 21,84 | ||||
| 2025-08-06 | 13F | Penserra Capital Management LLC | 1 319 497 | 52,29 | 45 | 80,00 | ||||
| 2025-07-30 | 13F | Bleakley Financial Group, LLC | 162 735 | 7,90 | 5 562 | 24,88 | ||||
| 2025-04-14 | 13F | Strategic Wealth Designers | 0 | −100,00 | 0 | −100,00 | ||||
| 2025-08-08 | 13F | Gts Securities Llc | 16 185 | 553 | ||||||
| 2025-07-18 | 13F | Pure Financial Advisors, Inc. | 11 058 | −5,95 | 378 | 8,65 | ||||
| 2025-08-07 | 13F | WESCAP Management Group, Inc. | 7 947 | 272 | ||||||
| 2025-08-13 | 13F | Brown Advisory Inc | 17 514 | 0,00 | 599 | 15,67 | ||||
| 2025-08-13 | 13F | Cerity Partners LLC | 449 478 | −4,83 | 15 363 | 10,14 | ||||
| 2025-08-07 | 13F | Allworth Financial LP | 1 264 | 0,00 | 43 | 16,22 | ||||
| 2025-05-13 | 13F | Skopos Labs, Inc. | 0 | −100,00 | 0 | |||||
| 2025-08-14 | 13F | Wells Fargo & Company/mn | 55 107 | 23,70 | 1 884 | 43,19 | ||||
| 2025-08-11 | 13F | HighTower Advisors, LLC | 197 700 | −3,71 | 6 757 | 11,43 | ||||
| 2025-07-02 | 13F | Marotta Asset Management | 876 654 | 0,98 | 29 964 | 5,66 | ||||
| 2025-07-28 | 13F | Cypress Wealth Services, LLC | 33 109 | −81,21 | 1 132 | −78,26 | ||||
| 2025-08-11 | 13F | Managed Asset Portfolios, Llc | 19 303 | 14,03 | 660 | 32,06 | ||||
| 2025-07-17 | 13F | Nelson, Van Denburg & Campbell Wealth Management Group, LLC | 6 414 | 219 | ||||||
| 2025-08-14 | 13F | Partners Capital Investment Group, Llp | 406 326 | −27,39 | 13 888 | −15,97 | ||||
| 2025-04-22 | 13F | Petra Financial Advisors Inc | 0 | −100,00 | 0 | |||||
| 2025-07-28 | 13F | Harbour Investments, Inc. | 999 | 7,19 | 34 | 25,93 | ||||
| 2025-07-23 | 13F | Financial Life Advisors | 127 507 | 2,78 | 4 358 | 18,94 | ||||
| 2025-08-08 | 13F | Smithfield Trust Co | 6 475 | 16,14 | 0 | |||||
| 2025-07-31 | 13F | Mason & Associates Inc | 90 514 | 2,87 | 3 094 | 19,05 | ||||
| 2025-08-14 | 13F | Stifel Financial Corp | 177 693 | 32,79 | 6 074 | 53,67 | ||||
| 2025-08-26 | NP | TBFG - The Brinsmere Fund - Growth ETF | 943 777 | 83,45 | 32 258 | 112,31 | ||||
| 2025-07-10 | 13F | CWC Advisors, LLC. | 28 898 | 8,05 | 988 | 25,10 | ||||
| 2025-08-08 | 13F | Creative Planning | 89 987 | −0,35 | 3 076 | 15,30 | ||||
| 2025-08-08 | 13F | Larson Financial Group LLC | 6 111 | −11,73 | 209 | 1,96 | ||||
| 2025-07-25 | 13F | Total Clarity Wealth Management, Inc. | 116 885 | 586,87 | 3 995 | 694,23 | ||||
| 2025-08-14 | 13F | Mariner, LLC | 17 264 | −88,21 | 590 | −86,36 | ||||
| 2025-08-15 | 13F | Morgan Stanley | 2 841 783 | −19,53 | 97 132 | −6,87 | ||||
| 2025-08-12 | 13F | MAI Capital Management | 1 751 | −19,31 | 60 | −7,81 | ||||
| 2025-08-13 | 13F | Cresset Asset Management, LLC | 22 393 | 0,00 | 765 | 15,73 | ||||
| 2025-07-29 | 13F | Smithbridge Asset Management Inc/de | 6 845 | −5,36 | 234 | 9,39 |