Grundläggande statistik
| Institutionella ägare | 280 total, 280 long only, 0 short only, 0 long/short - change of 3,31% MRQ |
| Genomsnittlig portföljallokering | 0.6509 % - change of 0,11% MRQ |
| Institutionella aktier (lång) | 52 828 953 (ex 13D/G) - change of 3,61MM shares 7,33% MRQ |
| Institutionellt värde (lång) | $ 2 507 516 USD ($1000) |
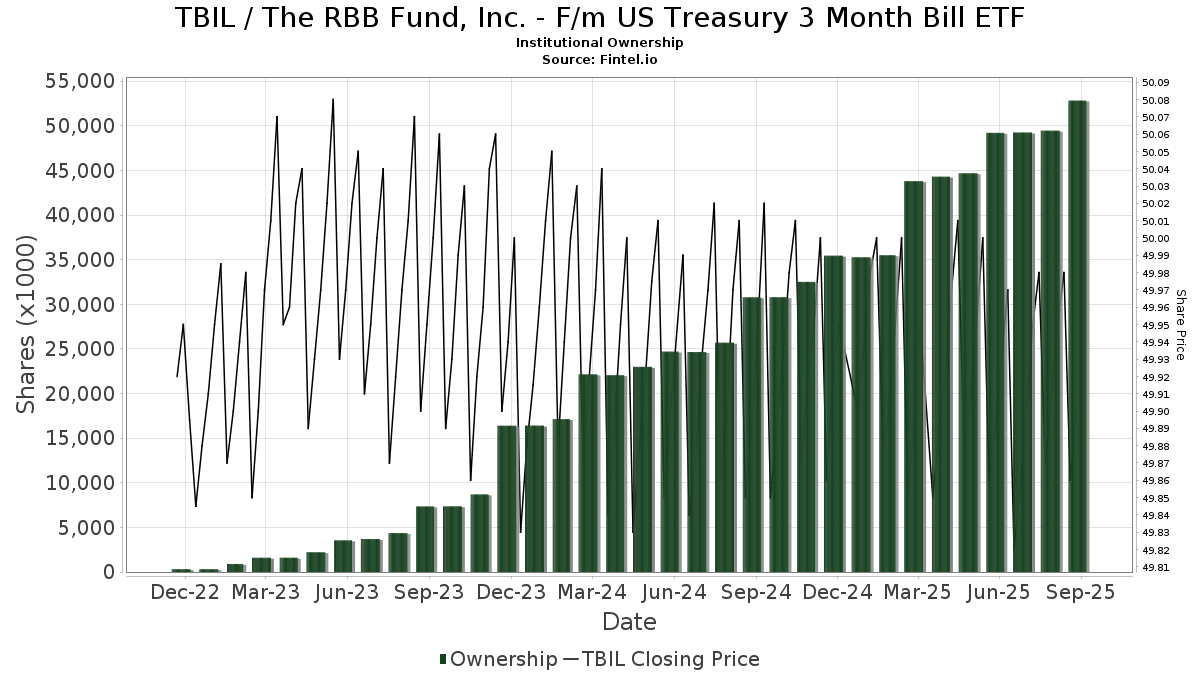
Institutionellt ägande och aktieägare
The RBB Fund, Inc. - F/m US Treasury 3 Month Bill ETF (US:TBIL) har 280 Institutionella ägare och aktieägare som har lämnat in 13D/G- eller 13F-formulär till Securities Exchange Commission (SEC). Dessa institut innehar totalt 52,828,953 aktier. Största aktieägare inkluderar LPL Financial LLC, Morgan Stanley, Oxbow Advisors, LLC, Raymond James Financial Inc, Stifel Financial Corp, Wealth Enhancement Advisory Services, Llc, Wells Fargo & Company/mn, Total Investment Management Inc, Moloney Securities Asset Management, LLC, and F/M Investments LLC .
The RBB Fund, Inc. - F/m US Treasury 3 Month Bill ETF (NasdaqGM:TBIL) Institutionell ägarstruktur visar institutioners och fonders nuvarande positioner i företaget, samt de senaste förändringarna i positionernas storlek. Större aktieägare kan vara enskilda investerare, fonder, hedgefonder eller institutioner. Bilaga 13D visar att investeraren äger (eller ägde) mer än 5% av företaget och avser (eller avsåg) att aktivt eftersträva en förändring av affärsstrategin. Schedule 13G indikerar en passiv investering på över 5%.
The share price as of September 11, 2025 is 49,91 / share. Previously, on September 12, 2024, the share price was 49,91 / share. This represents an increase of 0,00% over that period.
Fondsentimentets poäng
Fondsentimentet poängen(fka Ägarackumulation-poäng) visar vilka aktier som är mest köpta av fonder. Det är resultatet av en sofistikerad kvantitativ flerfaktormodell som identifierar företag med de högsta nivåerna av institutionell ackumulering. Poängsättningsmodellen använder en kombination av den totala ökningen av redovisade ägare, förändringarna i portföljallokeringarna för dessa ägare och andra mått. Siffran sträcker sig från 0 till 100, där högre siffror indikerar en högre nivå av ackumulering i förhållande till sina konkurrenter, och 50 är genomsnittet.
Uppdateringsfrekvens: Dagligen
Se Ownership Explorer, som innehåller en lista över de högst rankade företagen.
Institutionell sälj/köp-kvot
Förutom att rapportera vanliga eget kapital- och skuldemissioner måste institutioner med mer än 100MM tillgångar under förvaltning också avslöja sina innehav av sälj- och köpoptioner. Eftersom säljoptioner i allmänhet indikerar ett negativt sentiment och köpoptioner indikerar ett positivt sentiment, kan vi få en uppfattning om det övergripande institutionella sentimentet genom att plotta förhållandet mellan säljoptioner och köpoptioner. Diagrammet till höger visar det historiska förhållandet mellan sälj- och köpoptioner för detta instrument.
Genom att använda sälj/köp-kvoten som en indikator på aktieägarnas sentiment undviker man en av de största bristerna med att använda det totala institutionella ägandet, nämligen att en betydande del av de förvaltade tillgångarna investeras passivt för att följa index. Passivt förvaltade fonder köper vanligtvis inte optioner, så indikatorn för sälj/köp-kvoten ger en bättre bild av stämningen i aktivt förvaltade fonder.
13F- och NPORT-arkiveringar
Detaljer om 13F-arkiveringar är gratis. Detaljer om NP-arkiveringar kräver ett premiummedlemskap. Gröna rader indikerar nya positioner. Röda rader indikerar stängda positioner. Klicka på länk symbolen för att se hela transaktionshistoriken.
Uppgradera
för att låsa upp premiumdata och exportera till Excel ![]() .
.
| Fil Datum | Källa | Investerare | Typ | Genomsnittligt pris (beräknat) |
Aktier | Δ Aktier (%) |
Rapporterat värde (1000 USD) |
Δ Värde (%) |
Portföljallokering (%) |
|
|---|---|---|---|---|---|---|---|---|---|---|
| 2025-08-29 | NP | RAA - SMI 3Fourteen Real Asset Allocation ETF SMI 3Fourteen REAL Asset Allocation ETF | 192 814 | 148,39 | 9 640 | 148,30 | ||||
| 2025-07-31 | 13F | Moloney Securities Asset Management, LLC | 1 022 473 | 4,30 | 51 119 | 4,26 | ||||
| 2025-08-12 | 13F | Tableaux Llc | 0 | −100,00 | 0 | |||||
| 2025-08-14 | 13F | Wiley Bros.-aintree Capital, Llc | 0 | −100,00 | 0 | |||||
| 2025-08-07 | 13F | Cypress Capital, LLC | 86 275 | −20,54 | 4 313 | −20,56 | ||||
| 2025-07-29 | NP | OHSHX - Oakhurst Short Duration High Yield Credit Fund Institutional Shares | 44 015 | 2 201 | ||||||
| 2025-08-12 | 13F | J.w. Cole Advisors, Inc. | 46 798 | 136,86 | 2 340 | 136,74 | ||||
| 2025-07-29 | 13F | Manchester Financial Inc | 128 424 | −3,17 | 6 421 | −3,20 | ||||
| 2025-08-13 | 13F | Scotia Capital Inc. | 202 151 | 10 107 | ||||||
| 2025-08-12 | 13F | Wayfinding Financial, LLC | 0 | −100,00 | 0 | |||||
| 2025-08-06 | 13F | Centerpoint Advisory Group | 6 815 | 0,00 | 341 | 0,00 | ||||
| 2025-07-08 | 13F | Parallel Advisors, LLC | 74 773 | 25,86 | 3 738 | 25,82 | ||||
| 2025-07-29 | 13F | Stephens Inc /ar/ | 5 540 | 277 | ||||||
| 2025-08-06 | 13F | Legacy Investment Solutions, LLC | 2 846 | 219,78 | 142 | 222,73 | ||||
| 2025-07-25 | 13F | Astoria Portfolio Advisors LLC. | 5 962 | 298 | ||||||
| 2025-08-12 | 13F | LPL Financial LLC | 9 994 024 | 0,71 | 499 651 | 0,68 | ||||
| 2025-07-16 | 13F | Perigon Wealth Management, LLC | 7 403 | −25,13 | 370 | −25,10 | ||||
| 2025-07-28 | 13F | Acorn Financial Advisory Services Inc /adv | 18 564 | −37,28 | 928 | −37,30 | ||||
| 2025-07-31 | 13F | Strait & Sound Wealth Management LLC | 232 396 | −4,05 | 11 619 | −4,09 | ||||
| 2025-08-11 | 13F | Advisor Resource Council | 0 | −100,00 | 0 | |||||
| 2025-08-11 | 13F | Synergy Investment Management, LLC | 0 | −100,00 | 0 | |||||
| 2025-08-13 | 13F | Baird Financial Group, Inc. | 88 014 | 4 400 | ||||||
| 2025-08-14 | 13F | Old Mission Capital Llc | 11 299 | 565 | ||||||
| 2025-08-13 | 13F | Northwestern Mutual Wealth Management Co | 124 228 | 2,02 | 6 211 | 1,99 | ||||
| 2025-07-17 | 13F | Alpine Bank Wealth Management | 189 728 | 188,93 | 9 485 | 188,91 | ||||
| 2025-08-11 | 13F | Aptus Capital Advisors, LLC | 8 900 | −2,20 | 445 | −2,42 | ||||
| 2025-07-11 | 13F | Harbour Capital Advisors, LLC | 11 195 | 37,36 | 558 | 37,19 | ||||
| 2025-08-05 | 13F | Tsfg, Llc | 438 | 0,00 | 0 | |||||
| 2025-08-14 | 13F | Jane Street Group, Llc | 38 193 | 171,95 | 1 909 | 171,94 | ||||
| 2025-07-22 | 13F | Belpointe Asset Management LLC | 8 887 | −34,61 | 444 | −34,61 | ||||
| 2025-08-12 | 13F | Financial Advocates Investment Management | 33 032 | 25,38 | 1 651 | 25,36 | ||||
| 2025-08-18 | 13F | Geneos Wealth Management Inc. | 1 102 | 0,00 | 55 | 0,00 | ||||
| 2025-08-05 | 13F | Obermeyer Wood Investment Counsel, Lllp | 968 882 | 4,21 | 48 439 | 4,18 | ||||
| 2025-05-15 | 13F | Bank Of America Corp /de/ | 0 | −100,00 | 0 | |||||
| 2025-07-24 | 13F | Strong Tower Advisory Services | 206 975 | 564,70 | 10 348 | 566,69 | ||||
| 2025-05-09 | 13F | Empower Advisory Group, LLC | 0 | −100,00 | 0 | −100,00 | ||||
| 2025-07-25 | 13F | Concurrent Investment Advisors, LLC | 70 214 | 11,93 | 3 510 | 11,89 | ||||
| 2025-07-11 | 13F | Farther Finance Advisors, LLC | 69 086 | 16,42 | 3 454 | 16,77 | ||||
| 2025-07-25 | 13F | Sequoia Financial Advisors, LLC | 0 | −100,00 | 0 | −100,00 | ||||
| 2025-08-13 | 13F/A | StoneX Group Inc. | 6 644 | 331 | ||||||
| 2025-08-06 | 13F | Wedbush Securities Inc | 6 915 | 0 | ||||||
| 2025-07-14 | 13F | Gries Financial Llc | 274 207 | −6,24 | 13 709 | −6,27 | ||||
| 2025-08-11 | 13F | CFS Investment Advisory Services, LLC | 5 000 | 0 | ||||||
| 2025-07-21 | 13F | Mirae Asset Global Investments Co., Ltd. | 94 300 | 4 715 | ||||||
| 2025-08-11 | 13F | Private Advisor Group, LLC | 692 063 | 7,29 | 34 600 | 7,26 | ||||
| 2025-08-14 | 13F | Mpwm Advisory Solutions, Llc | 7 166 | −32,98 | 358 | −32,96 | ||||
| 2025-08-08 | 13F | Capital Investment Counsel, Inc | 35 825 | 10,23 | 1 791 | 10,22 | ||||
| 2025-08-12 | 13F | Gitterman Wealth Management, LLC | 16 376 | −5,25 | 819 | −5,32 | ||||
| 2025-07-17 | 13F | KG&L Capital Management,LLC | 54 228 | 26,14 | 2 711 | 26,15 | ||||
| 2025-04-28 | 13F | Summit Trail Advisors, Llc | 0 | −100,00 | 0 | −100,00 | ||||
| 2025-08-14 | 13F | Guardian Wealth Advisors, Llc / Nc | 17 013 | −50,84 | 851 | −50,87 | ||||
| 2025-07-14 | 13F | Occidental Asset Management, LLC | 5 000 | 0,00 | 250 | −0,40 | ||||
| 2025-08-14 | 13F | Royal Bank Of Canada | 960 | −88,19 | 48 | −88,24 | ||||
| 2025-08-05 | 13F | C2P Capital Advisory Group, LLC d.b.a. Prosperity Capital Advisors | 0 | −100,00 | 0 | |||||
| 2025-08-01 | 13F | Gwn Securities Inc. | 19 780 | −0,18 | 990 | −0,20 | ||||
| 2025-08-14 | 13F | Camarda Financial Advisors, LLC | 5 498 | 33,19 | 275 | 33,01 | ||||
| 2025-08-15 | 13F | Global View Capital Management LLC | 96 142 | 5,64 | 4 807 | 5,60 | ||||
| 2025-07-29 | 13F | International Assets Investment Management, Llc | 55 774 | −9,45 | 2 788 | −9,48 | ||||
| 2025-08-04 | 13F | Arkadios Wealth Advisors | 4 729 | 236 | ||||||
| 2025-07-29 | 13F | Kraft, Davis & Associates, LLC | 31 707 | 1 584 | ||||||
| 2025-08-12 | 13F | MAI Capital Management | 1 560 | 108,00 | 78 | 108,11 | ||||
| 2025-08-04 | 13F | Pensionmark Financial Group, Llc | 22 141 | 159,11 | 1 107 | 159,02 | ||||
| 2025-07-31 | 13F | Leavell Investment Management, Inc. | 10 355 | 4,41 | 518 | 4,44 | ||||
| 2025-08-14 | 13F | UBS Group AG | 703 865 | 31,96 | 35 190 | 31,92 | ||||
| 2025-07-23 | 13F | Tcfg Wealth Management, Llc | 15 881 | −36,99 | 794 | −37,06 | ||||
| 2025-07-09 | 13F | VisionPoint Advisory Group, LLC | 51 461 | 0,34 | 2 573 | 0,31 | ||||
| 2025-08-01 | 13F | Brookwood Investment Group LLC | 7 050 | −7,84 | 352 | −7,85 | ||||
| 2025-07-30 | 13F | Avidian Wealth Solutions, LLC | 156 894 | 5,16 | 7 844 | 5,13 | ||||
| 2025-08-14 | 13F | Stifel Financial Corp | 1 601 660 | −9,27 | 80 075 | −9,30 | ||||
| 2025-08-18 | 13F/A | National Bank Of Canada /fi/ | 19 699 | 65,14 | 985 | 65,10 | ||||
| 2025-08-26 | 13F | Claris Financial LLC | 45 070 | 42,09 | 2 253 | 42,50 | ||||
| 2025-08-13 | 13F | Renaissance Technologies Llc | 0 | −100,00 | 0 | |||||
| 2025-08-11 | 13F | HighTower Advisors, LLC | 268 750 | 291,13 | 13 436 | 291,04 | ||||
| 2025-08-07 | 13F | Nwam Llc | 0 | −100,00 | 0 | |||||
| 2025-08-14 | 13F | CoreCap Advisors, LLC | 1 250 | −14,50 | 62 | −15,07 | ||||
| 2025-04-21 | 13F | Beacon Capital Management, LLC | 0 | −100,00 | 0 | |||||
| 2025-07-17 | 13F | Venture Visionary Partners LLC | 5 402 | 0,00 | 270 | 0,00 | ||||
| 2025-08-12 | 13F | Jpmorgan Chase & Co | 151 383 | 49 050,32 | 7 568 | 50 353,33 | ||||
| 2025-07-24 | 13F | Us Bancorp \de\ | 7 329 | 0,00 | 366 | 0,00 | ||||
| 2025-08-15 | 13F | Keel Point, LLC | 8 012 | 0,00 | 401 | 0,00 | ||||
| 2025-08-13 | 13F | Proactive Wealth Strategies LLC | 128 401 | 1,38 | 6 | 0,00 | ||||
| 2025-08-06 | 13F | SOUTH STATE Corp | 0 | −100,00 | 0 | |||||
| 2025-07-25 | 13F | Prostatis Group LLC | 23 744 | 19,11 | 1 187 | 19,18 | ||||
| 2025-08-14 | 13F | Williams Jones Wealth Management, LLC. | 5 750 | 287 | ||||||
| 2025-05-16 | 13F | Jones Financial Companies Lllp | 0 | −100,00 | 0 | |||||
| 2025-08-14 | 13F | Millennium Management Llc | 32 122 | 1 606 | ||||||
| 2025-07-14 | 13F | Crew Capital Management, Ltd. | 47 963 | −12,23 | 2 398 | −12,26 | ||||
| 2025-07-16 | 13F/A | CX Institutional | 53 475 | 4,66 | 3 | 0,00 | ||||
| 2025-07-14 | 13F | Armstrong Advisory Group, Inc | 901 | 45 | ||||||
| 2025-08-14 | 13F | Mml Investors Services, Llc | 1 003 941 | 18,06 | 50 | 19,05 | ||||
| 2025-08-04 | 13F | Creative Financial Designs Inc /adv | 2 248 | 15,88 | 112 | 16,67 | ||||
| 2025-08-13 | 13F | Lido Advisors, LLC | 270 981 | −7,10 | 13 548 | −7,12 | ||||
| 2025-07-30 | 13F | Strategic Blueprint, LLC | 4 392 | −9,29 | 220 | −9,50 | ||||
| 2025-08-15 | 13F | Equitable Holdings, Inc. | 255 061 | 24,04 | 12 752 | 24,00 | ||||
| 2025-08-08 | 13F | Good Life Advisors, LLC | 15 378 | −4,95 | 769 | −5,07 | ||||
| 2025-08-06 | 13F | Walkner Condon Financial Advisors LLC | 0 | −100,00 | 0 | |||||
| 2025-05-02 | 13F | Kingsview Wealth Management, LLC | 0 | −100,00 | 0 | |||||
| 2025-07-25 | 13F | Cwm, Llc | 1 560 | −17,85 | 0 | |||||
| 2025-08-13 | 13F | Cerity Partners LLC | 7 181 | 0,00 | 359 | 0,00 | ||||
| 2025-08-08 | 13F | Cetera Investment Advisers | 393 444 | −1,15 | 19 670 | −1,18 | ||||
| 2025-08-14 | 13F | PenderFund Capital Management Ltd. | 6 000 | 300 | ||||||
| 2025-08-05 | 13F | American Institute for Advanced Investment Management, LLP | 4 600 | 0,00 | 230 | −0,43 | ||||
| 2025-05-28 | NP | RSEE - Rareview Systematic Equity ETF | 53 821 | −75,78 | 2 692 | −75,71 | ||||
| 2025-08-15 | 13F | Kestra Advisory Services, LLC | 363 963 | 26,35 | 18 196 | 26,32 | ||||
| 2025-07-14 | 13F | AdvisorNet Financial, Inc | 104 610 | 72,69 | 5 230 | 72,63 | ||||
| 2025-08-06 | 13F | Valtinson Bruner Financial Planning LLC | 16 063 | 1,69 | 803 | 1,77 | ||||
| 2025-08-06 | 13F | Golden State Wealth Management, LLC | 9 794 | −7,23 | 490 | −7,21 | ||||
| 2025-08-07 | 13F | Resources Investment Advisors, LLC. | 44 891 | 0,61 | 2 244 | 0,58 | ||||
| 2025-08-04 | 13F | IFG Advisory, LLC | 84 294 | −17,98 | 4 214 | −18,00 | ||||
| 2025-07-15 | 13F | Accurate Wealth Management, LLC | 11 041 | −4,58 | 550 | −4,68 | ||||
| 2025-08-12 | 13F | Proequities, Inc. | 0 | 0 | ||||||
| 2025-07-23 | 13F | WESPAC Advisors, LLC | 5 300 | 0,00 | 265 | −0,38 | ||||
| 2025-07-22 | 13F | Wealthcare Advisory Partners LLC | 324 665 | −16,61 | 16 232 | −16,64 | ||||
| 2025-07-25 | 13F | Genesee Capital Advisors, LLC | 4 226 | −2,72 | 211 | −2,76 | ||||
| 2025-04-30 | 13F | Allworth Financial LP | 0 | −100,00 | 0 | |||||
| 2025-08-05 | 13F | Integrity Financial Corp /WA | 8 418 | 0,00 | 421 | 0,00 | ||||
| 2025-08-05 | 13F | Sigma Planning Corp | 65 522 | 41,26 | 3 276 | 41,22 | ||||
| 2025-08-14 | 13F | Pinnacle Family Advisors, LLC | 0 | −100,00 | 0 | |||||
| 2025-08-06 | 13F | Stone House Investment Management, LLC | 0 | −100,00 | 0 | |||||
| 2025-07-14 | 13F | Opal Wealth Advisors, LLC | 4 280 | 214 | ||||||
| 2025-07-31 | 13F | Longview Financial Advisors, Inc. | 61 375 | −19,62 | 3 068 | −19,64 | ||||
| 2025-09-04 | 13F/A | Advisor Group Holdings, Inc. | 41 888 | −60,59 | 2 094 | −60,60 | ||||
| 2025-07-14 | 13F | Wealth Advisory Solutions, LLC | 18 238 | 106,80 | 912 | 106,58 | ||||
| 2025-07-17 | 13F | Argus Investors' Counsel, Inc. | 4 263 | −37,15 | 213 | −37,17 | ||||
| 2025-08-14 | 13F | Widmann Financial Services, Inc. | 10 680 | 5,95 | 534 | 5,75 | ||||
| 2025-07-29 | 13F | Oxbow Advisors, LLC | 2 060 435 | −20,08 | 103 011 | −20,11 | ||||
| 2025-08-14 | 13F | IHT Wealth Management, LLC | 25 672 | 12,80 | 1 283 | 12,74 | ||||
| 2025-08-14 | 13F | Great Valley Advisor Group, Inc. | 52 456 | 151,52 | 2 623 | 151,39 | ||||
| 2025-08-13 | 13F | Fi3 FINANCIAL ADVISORS, LLC | 0 | −100,00 | 0 | |||||
| 2025-07-15 | 13F | Signet Financial Management, Llc | 24 481 | −38,97 | 1 224 | −39,03 | ||||
| 2025-08-11 | 13F | Principal Securities, Inc. | 16 833 | 11,87 | 842 | 12,13 | ||||
| 2025-08-11 | 13F | NewEdge Wealth, LLC | 17 139 | −18,39 | 855 | −18,67 | ||||
| 2025-08-15 | 13F | Captrust Financial Advisors | 187 924 | 4 270,33 | 9 395 | 4 269,77 | ||||
| 2025-08-04 | 13F | Integrity Alliance, Llc. | 0 | −100,00 | 0 | |||||
| 2025-08-14 | 13F | Hilton Capital Management, LLC | 136 385 | 150,16 | 6 819 | 150,11 | ||||
| 2025-07-17 | 13F | Janney Montgomery Scott LLC | 16 093 | −1,49 | 1 | |||||
| 2025-07-28 | 13F | Mutual Advisors, LLC | 16 862 | −5,80 | 843 | −5,82 | ||||
| 2025-08-15 | 13F | Semmax Financial Advisors Inc. | 110 452 | −11,97 | 5 510 | −11,98 | ||||
| 2025-08-14 | 13F | Money Concepts Capital Corp | 171 804 | −21,26 | 8 589 | −21,29 | ||||
| 2025-05-08 | 13F | Strategic Advocates LLC | 0 | −100,00 | 0 | |||||
| 2025-04-11 | 13F | Signal Advisors Wealth, LLC | 0 | −100,00 | 0 | |||||
| 2025-07-08 | 13F | Nbc Securities, Inc. | 500 | 0 | ||||||
| 2025-07-30 | 13F | Eqis Capital Management, Inc. | 17 281 | −0,42 | 864 | −0,46 | ||||
| 2025-08-07 | 13F | CENTRAL TRUST Co | 504 477 | 5,42 | 25 221 | 5,39 | ||||
| 2025-08-28 | NP | SAMT - STRATEGAS MACRO THEMATIC OPPORTUNITIES ETF | 87 751 | 4 387 | ||||||
| 2025-07-22 | 13F | Inlight Wealth Management, LLC | 0 | −100,00 | 0 | |||||
| 2025-08-07 | 13F | Ibex Wealth Advisors | 260 015 | 13,13 | 12 999 | 13,09 | ||||
| 2025-07-16 | 13F | Strategic Investment Solutions, Inc. /IL | 21 494 | −3,77 | 1 071 | −4,12 | ||||
| 2025-07-09 | 13F | Massmutual Trust Co Fsb/adv | 60 | 3 | ||||||
| 2025-08-11 | 13F | TD Waterhouse Canada Inc. | 1 200 | 60 | ||||||
| 2025-08-12 | 13F | Gladstone Institutional Advisory LLC | 11 535 | −74,66 | 577 | −74,69 | ||||
| 2025-07-22 | 13F | MBL Wealth, LLC | 18 462 | −12,20 | 923 | −12,18 | ||||
| 2025-07-31 | 13F | Glass Jacobson Investment Advisors llc | 35 316 | −0,55 | 1 766 | −0,28 | ||||
| 2025-08-14 | 13F | Colony Group, LLC | 4 352 | −34,46 | 218 | −34,64 | ||||
| 2025-08-04 | 13F | Coign Capital Advisors LLC | 157 411 | −11,36 | 7 870 | −11,39 | ||||
| 2025-08-13 | 13F | Twin Peaks Wealth Advisors, LLC | 140 | 7 | ||||||
| 2025-08-08 | 13F | Fortis Group Advisors, LLC | 79 032 | −24,17 | 3 950 | −24,21 | ||||
| 2025-05-14 | 13F | Huntington National Bank | 12 | −82,54 | ||||||
| 2025-08-13 | 13F | Vermillion & White Wealth Management Group, LLC | 3 961 | 198 | ||||||
| 2025-07-31 | 13F | Pinnacle Wealth Management Group, Inc. | 156 066 | 4,38 | 7 803 | 4,36 | ||||
| 2025-08-07 | 13F | Summit X, LLC | 5 000 | 250 | ||||||
| 2025-08-06 | 13F | Legacy Wealth Managment, LLC/ID | 2 846 | 0,00 | 142 | 0,00 | ||||
| 2025-08-13 | 13F | Cresset Asset Management, LLC | 30 217 | 0,09 | 1 511 | 0,07 | ||||
| 2025-07-22 | 13F | Global Assets Advisory, LLC | 24 341 | −53,56 | 1 213 | −53,62 | ||||
| 2025-04-22 | 13F | VanWeelden Wealth Management, LLC | 278 928 | −35,05 | 13 949 | −34,85 | ||||
| 2025-08-12 | 13F | Jaffetilchin Investment Partners, LLC | 82 310 | −2,50 | 4 115 | −2,51 | ||||
| 2025-08-04 | 13F | Kovack Advisors, Inc. | 4 265 | 213 | ||||||
| 2025-08-14 | 13F | Wells Fargo & Company/mn | 1 098 489 | 3 844,87 | 54 919 | 3 845,26 | ||||
| 2025-07-28 | 13F | Copia Wealth Management | 124 184 | 0,26 | 6 209 | 0,23 | ||||
| 2025-07-24 | 13F | Wealthstar Advisors, Llc | 133 289 | 13,68 | 6 664 | 13,64 | ||||
| 2025-04-21 | 13F | Ronald Blue Trust, Inc. | 0 | −100,00 | 0 | −100,00 | ||||
| 2025-07-24 | 13F | Lindenwold Advisors | 4 149 | 0,00 | 207 | 0,00 | ||||
| 2025-08-18 | 13F | N.E.W. Advisory Services LLC | 204 | −19,05 | 10 | −16,67 | ||||
| 2025-04-21 | 13F | ORG Partners LLC | 0 | −100,00 | 0 | |||||
| 2025-08-15 | 13F | First Heartland Consultants, Inc. | 98 035 | −2,57 | 4 901 | −2,58 | ||||
| 2025-08-13 | 13F | Denver Wealth Management, Inc. | 162 135 | 3,30 | 8 106 | 3,26 | ||||
| 2025-08-27 | 13F/A | Brinker Capital Investments, LLC | 31 915 | 164,15 | 1 596 | 164,07 | ||||
| 2025-08-08 | 13F | Altfest L J & Co Inc | 34 140 | −10,56 | 1 707 | −10,59 | ||||
| 2025-04-30 | 13F | Values First Advisors, Inc. | 0 | −100,00 | 0 | |||||
| 2025-07-25 | 13F | Apollon Wealth Management, LLC | 12 437 | −27,99 | 622 | −28,04 | ||||
| 2025-07-16 | 13F | Signaturefd, Llc | 118 | −76,40 | 6 | −80,00 | ||||
| 2025-08-05 | 13F | Prosperity Wealth Management, Inc. | 9 000 | 106,90 | 450 | 106,91 | ||||
| 2025-08-25 | 13F/A | Neuberger Berman Group LLC | 132 300 | −22,80 | 6 614 | −22,82 | ||||
| 2025-08-13 | 13F | RIA Advisory Group LLC | 175 044 | 7,64 | 8 751 | 7,61 | ||||
| 2025-08-12 | 13F | Zacks Investment Management | 4 705 | 13,43 | 235 | 13,53 | ||||
| 2025-04-22 | 13F | Synergy Financial Management, LLC | 0 | −100,00 | 0 | |||||
| 2025-05-15 | 13F | Foguth Wealth Management, LLC. | 0 | −100,00 | 0 | |||||
| 2025-08-14 | 13F | CIBC World Markets Inc. | 13 435 | 93,92 | 672 | 93,93 | ||||
| 2025-05-15 | 13F/A | Orion Portfolio Solutions, LLC | 12 082 | 154,04 | 604 | 154,85 | ||||
| 2025-07-22 | 13F | DAVENPORT & Co LLC | 72 662 | 4,86 | 3 633 | 4,85 | ||||
| 2025-05-02 | 13F | Montis Financial, LLC | 0 | −100,00 | 0 | |||||
| 2025-05-15 | 13F | Creative Planning | 0 | −100,00 | 0 | |||||
| 2025-08-12 | 13F | Founders Financial Alliance, LLC | 61 128 | 9,87 | 3 056 | 9,85 | ||||
| 2025-07-29 | 13F | Vista Finance, Llc | 7 465 | −70,80 | 373 | −70,81 | ||||
| 2025-08-14 | 13F | Goldman Sachs Group Inc | 0 | −100,00 | 0 | |||||
| 2025-08-01 | 13F | GoalVest Advisory LLC | 6 661 | 408,09 | 333 | 412,31 | ||||
| 2025-08-04 | 13F | Spire Wealth Management | 95 | 5 | ||||||
| 2025-08-12 | 13F | Northeast Planning Associates, Inc. / Nh / | 9 945 | −68,94 | 497 | −68,96 | ||||
| 2025-08-04 | 13F | Bay Colony Advisory Group, Inc d/b/a Bay Colony Advisors | 103 080 | 11,15 | 5 153 | 11,18 | ||||
| 2025-08-12 | 13F | Insigneo Advisory Services, Llc | 4 011 | −20,37 | 201 | −20,32 | ||||
| 2025-08-01 | 13F | Ashton Thomas Private Wealth, LLC | 112 175 | 3,49 | 5 608 | 3,47 | ||||
| 2025-04-29 | NP | LFSC - F/m Emerald Life Sciences Innovation ETF | 17 962 | 26,27 | 898 | 26,30 | ||||
| 2025-07-31 | 13F | Cambridge Investment Research Advisors, Inc. | 496 336 | −2,90 | 25 | −4,00 | ||||
| 2025-08-15 | 13F | Morgan Stanley | 8 588 384 | 27,22 | 429 376 | 27,18 | ||||
| 2025-07-30 | 13F | D.a. Davidson & Co. | 5 848 | −62,78 | 292 | −62,80 | ||||
| 2025-08-19 | 13F | National Asset Management, Inc. | 57 098 | −28,72 | 2 855 | −28,52 | ||||
| 2025-08-05 | 13F | Westside Investment Management, Inc. | 4 750 | −16,67 | 237 | −16,84 | ||||
| 2025-08-14 | 13F/A | Rockefeller Capital Management L.P. | 21 272 | 51,99 | 1 064 | 52,07 | ||||
| 2025-05-12 | 13F | Independent Advisor Alliance | 0 | −100,00 | 0 | |||||
| 2025-07-29 | 13F | Stratos Wealth Partners, LTD. | 261 675 | −42,51 | 13 082 | −42,52 | ||||
| 2025-08-08 | 13F/A | Ignite Planners, LLC | 36 396 | 21,65 | 1 817 | 21,86 | ||||
| 2025-08-12 | 13F | Change Path, LLC | 13 985 | −0,75 | 699 | −0,71 | ||||
| 2025-07-24 | 13F | WMG Financial Advisors, LLC | 111 057 | −2,87 | 5 552 | −2,90 | ||||
| 2025-08-13 | 13F | Everstar Asset Management, LLC | 9 473 | 76,57 | 474 | 76,49 | ||||
| 2025-08-19 | 13F | Newbridge Financial Services Group, Inc. | 200 | 0,00 | 10 | −10,00 | ||||
| 2025-07-18 | 13F | Trilogy Capital Inc. | 15 421 | 771 | ||||||
| 2025-07-07 | 13F | TruWealth Advisors, LLC | 22 518 | −3,27 | 1 126 | −3,35 | ||||
| 2025-08-12 | 13F | Calton & Associates, Inc. | 14 063 | 0,45 | 703 | 0,43 | ||||
| 2025-08-08 | 13F | Intrua Financial, LLC | 4 045 | 1,05 | 202 | 1,00 | ||||
| 2025-08-12 | 13F | Global Retirement Partners, LLC | 26 197 | 3 685,69 | 1 310 | 3 750,00 | ||||
| 2025-07-10 | 13F | Wealth Enhancement Advisory Services, Llc | 1 422 449 | 31,61 | 70 909 | 31,19 | ||||
| 2025-08-13 | 13F | VestGen Advisors, LLC | 4 025 | −4,24 | 201 | −4,29 | ||||
| 2025-05-05 | 13F | Lindbrook Capital, Llc | 0 | −100,00 | 0 | |||||
| 2025-08-14 | 13F | Ausdal Financial Partners, Inc. | 6 000 | 300 | ||||||
| 2025-05-14 | 13F | Orion Capital Management LLC | 0 | −100,00 | 0 | |||||
| 2025-07-21 | 13F | Ameritas Advisory Services, LLC | 40 809 | −75,02 | 2 040 | −75,02 | ||||
| 2025-08-08 | 13F | Gts Securities Llc | 61 609 | 3 080 | ||||||
| 2025-04-15 | 13F | GPS Wealth Strategies Group, LLC | 0 | −100,00 | 0 | |||||
| 2025-07-29 | 13F | Latitude Advisors, LLC | 6 034 | 1,02 | 302 | 1,01 | ||||
| 2025-07-31 | 13F | Oppenheimer & Co Inc | 10 614 | 7,64 | 531 | 7,51 | ||||
| 2025-08-13 | 13F | Trustmark National Bank Trust Department | 12 903 | 0,00 | 645 | 0,00 | ||||
| 2025-05-09 | 13F | Northern Oak Wealth Management Inc | 0 | −100,00 | 0 | |||||
| 2025-08-13 | 13F | Quadrature Capital Ltd | 4 964 | 248 | ||||||
| 2025-08-19 | 13F | Wealth Group, Ltd. | 0 | −100,00 | 0 | |||||
| 2025-08-14 | 13F | Synovus Financial Corp | 136 026 | 41,26 | 6 801 | 41,23 | ||||
| 2025-07-09 | 13F | Dynamic Advisor Solutions LLC | 11 100 | 0,00 | 555 | −0,18 | ||||
| 2025-07-16 | 13F | Spinnaker Investment Group, LLC | 0 | −100,00 | 0 | |||||
| 2025-04-21 | 13F | Nelson, Van Denburg & Campbell Wealth Management Group, LLC | 0 | −100,00 | 0 | |||||
| 2025-08-12 | 13F | PSI Advisors, LLC | 0 | −100,00 | 0 | |||||
| 2025-05-16 | 13F | Coppell Advisory Solutions LLC | 0 | −100,00 | 0 | |||||
| 2025-08-07 | 13F | Encompass More Asset Management | 17 049 | 65,40 | 852 | 65,44 | ||||
| 2025-08-12 | 13F | Cornerstone Wealth Management, LLC | 9 798 | 78,05 | 490 | 77,82 | ||||
| 2025-05-09 | 13F | Delta Asset Management Llc/tn | 0 | −100,00 | 0 | |||||
| 2025-05-14 | 13F | Ameriprise Financial Inc | 0 | −100,00 | 0 | |||||
| 2025-07-30 | 13F | Forum Financial Management, LP | 103 059 | 0,19 | 5 152 | 0,16 | ||||
| 2025-08-11 | 13F | Retirement Capital Strategies | 217 068 | 982,74 | 10 852 | 983,03 | ||||
| 2025-07-30 | 13F/A | Divergent Planning, LLC | 137 848 | 81,37 | 6 868 | 81,28 | ||||
| 2025-07-29 | 13F | Koshinski Asset Management, Inc. | 62 867 | 51,94 | 3 143 | 51,91 | ||||
| 2025-05-14 | 13F | Andina Capital Management, LLC | 0 | −100,00 | 0 | |||||
| 2025-08-15 | 13F | Ewing Morris & Co. Investment Partners Ltd. | 0 | −100,00 | 0 | |||||
| 2025-07-15 | 13F | Clarus Group, Inc. | 29 076 | −8,14 | 1 454 | −8,21 | ||||
| 2025-08-14 | 13F | Integrity Wealth Advisors, Inc. | 0 | −100,00 | 0 | |||||
| 2025-04-28 | 13F | Pinnacle Financial Partners Inc | 51 602 | −0,62 | 2 581 | −0,31 | ||||
| 2025-04-16 | 13F/A | Western Wealth Management, LLC | 0 | −100,00 | 0 | |||||
| 2025-07-25 | 13F | Sovereign Financial Group, Inc. | 111 571 | 32,36 | 5 578 | 32,31 | ||||
| 2025-07-14 | 13F | S.A. Mason LLC | 2 300 | 115 | ||||||
| 2025-07-15 | 13F | SJS Investment Consulting Inc. | 0 | −100,00 | 0 | |||||
| 2025-07-31 | 13F | B & T Capital Management DBA Alpha Capital Management | 116 669 | −10,35 | 5 833 | −10,39 | ||||
| 2025-08-07 | 13F | Kestra Private Wealth Services, Llc | 231 062 | 17,21 | 11 552 | 17,17 | ||||
| 2025-07-23 | 13F | Vontobel Holding Ltd. | 0 | −100,00 | 0 | |||||
| 2025-07-30 | 13F | BlueChip Wealth Advisors LLC | 21 985 | 0,00 | 1 099 | 0,00 | ||||
| 2025-08-12 | 13F | Marshall & Sterling Wealth Advisors Inc. | 28 323 | 4,21 | 1 416 | 4,12 | ||||
| 2025-07-16 | 13F | ORG Wealth Partners, LLC | 0 | −100,00 | 0 | |||||
| 2025-07-24 | 13F | IFP Advisors, Inc | 31 247 | 26,23 | 1 562 | 26,27 | ||||
| 2025-08-14 | 13F | Principia Wealth Advisory, LLC | 2 | 0 | ||||||
| 2025-08-11 | 13F | Tidemark, LLC | 13 758 | 2,21 | 688 | 2,08 | ||||
| 2025-08-15 | 13F | CI Private Wealth, LLC | 34 218 | 10,50 | 1 711 | 10,47 | ||||
| 2025-08-05 | 13F | Simplex Trading, Llc | 2 | 0 | ||||||
| 2025-08-08 | 13F | Avantax Advisory Services, Inc. | 28 928 | −8,25 | 1 446 | −8,25 | ||||
| 2025-08-12 | 13F | Steward Partners Investment Advisory, Llc | 295 257 | −22,96 | 14 761 | −22,98 | ||||
| 2025-08-14 | 13F | Fmr Llc | 624 | −82,12 | 31 | −82,18 | ||||
| 2025-08-13 | 13F | F/M Investments LLC | 1 021 520 | 30,82 | 51 070 | 30,79 | ||||
| 2025-07-28 | 13F | Elmwood Wealth Management, Inc. | 10 315 | 0,00 | 516 | 0,00 | ||||
| 2025-07-28 | 13F | Revolve Wealth Partners, LLC | 486 487 | 0,04 | 24 322 | 0,00 | ||||
| 2025-07-29 | 13F | Private Trust Co Na | 18 016 | 10,88 | 901 | 10,84 | ||||
| 2025-07-25 | 13F | Transcendent Capital Group LLC | 23 160 | −48,77 | 1 158 | −48,83 | ||||
| 2025-08-04 | 13F | Savvy Advisors, Inc. | 4 446 | 222 | ||||||
| 2025-08-11 | 13F | Core Wealth Partners LLC | 18 533 | −3,32 | 927 | −3,34 | ||||
| 2025-07-18 | 13F | Marino, Stram & Associates Llc | 0 | −100,00 | 0 | |||||
| 2025-07-18 | 13F | PFG Investments, LLC | 4 611 | 231 | ||||||
| 2025-08-04 | 13F | Silver Coast Investments LLC | 22 642 | 5,00 | 1 132 | 4,92 | ||||
| 2025-08-14 | 13F | EP Wealth Advisors, Inc. | 13 509 | 9,95 | 675 | 9,93 | ||||
| 2025-07-07 | 13F | Park Edge Advisors, LLC | 7 687 | −53,38 | 384 | −53,40 | ||||
| 2025-08-08 | 13F | Meridian Wealth Management, LLC | 25 003 | −10,34 | 1 250 | −10,33 | ||||
| 2025-04-22 | 13F | Castleview Partners, Llc | 0 | −100,00 | 0 | |||||
| 2025-08-14 | 13F | Toroso Investments, LLC | 174 778 | 23,21 | 8 707 | 22,75 | ||||
| 2025-04-10 | 13F | SMI Advisory Services, LLC | 0 | −100,00 | 0 | |||||
| 2025-08-01 | 13F | Vision Financial Markets Llc | 109 288 | 3,79 | 5 464 | 3,78 | ||||
| 2025-08-14 | 13F | Betterment LLC | 26 705 | 4,18 | 1 | 0,00 | ||||
| 2025-08-06 | 13F | Commonwealth Equity Services, Llc | 913 760 | −4,38 | 46 | −4,26 | ||||
| 2025-07-31 | 13F | Sage Mountain Advisors LLC | 32 203 | −11,30 | 1 610 | −11,35 | ||||
| 2025-08-13 | 13F | Townsquare Capital Llc | 0 | −100,00 | 0 | |||||
| 2025-07-29 | 13F | Financial Guidance Group, Inc. | 8 900 | −2,20 | 445 | −2,42 | ||||
| 2025-08-14 | 13F | Raymond James Financial Inc | 2 012 446 | −1,18 | 100 612 | −1,21 | ||||
| 2025-08-12 | 13F | Putnam Fl Investment Management Co | 187 515 | −11,21 | 9 375 | −11,24 | ||||
| 2025-08-13 | 13F | Luminist Capital LLC | 7 315 | −1,20 | 364 | −1,36 | ||||
| 2025-08-06 | 13F | Rps Advisory Solutions Llc | 0 | −100,00 | 0 | |||||
| 2025-08-13 | 13F | Wealthquest Corp | 228 988 | −6,71 | 11 448 | −6,74 | ||||
| 2025-08-14 | 13F | Ancora Advisors, LLC | 53 | −51,82 | 3 | −60,00 | ||||
| 2025-08-29 | 13F | Total Investment Management Inc | 1 023 870 | 51 188 | ||||||
| 2025-07-16 | 13F | Crown Wealth Group, LLC | 34 541 | 110,24 | 1 727 | 110,23 | ||||
| 2025-07-18 | 13F | Truist Financial Corp | 84 137 | −4,51 | 4 206 | −4,54 | ||||
| 2025-08-04 | 13F | Flagship Harbor Advisors, Llc | 47 612 | 294,50 | 2 380 | 294,69 | ||||
| 2025-08-11 | 13F | Banque Cantonale Vaudoise | 2 868 | 6,18 | 0 | |||||
| 2025-07-23 | 13F | Gentry Private Wealth, Llc | 6 141 | −33,90 | 307 | −33,84 | ||||
| 2025-07-09 | 13F | Heritage Wealth Architects, Inc. | 115 747 | 5 787 | ||||||
| 2025-07-09 | 13F | Fiduciary Alliance LLC | 80 800 | −5,39 | 4 040 | −5,41 | ||||
| 2025-08-14 | 13F | Mariner, LLC | 358 151 | 16,17 | 17 906 | 16,14 | ||||
| 2025-07-22 | 13F | Coastal Investment Advisors, Inc. | 2 500 | 0,00 | 125 | −0,80 | ||||
| 2025-07-23 | 13F | Castle Rock Wealth Management, LLC | 6 556 | 21,68 | 327 | 22,01 | ||||
| 2025-07-16 | 13F | Formidable Asset Management, LLC | 104 240 | 1,96 | 5 213 | 1,96 | ||||
| 2025-07-23 | 13F | Clear Creek Financial Management, LLC | 23 190 | 1 159 | ||||||
| 2025-07-25 | 13F | Atria Wealth Solutions, Inc. | 21 257 | 69,23 | 1 063 | 69,11 | ||||
| 2025-08-13 | 13F | Generation Capital Management LLC | 268 531 | 8,10 | 13 425 | 8,07 | ||||
| 2025-08-14 | 13F | Benjamin Edwards Inc | 797 860 | 14,18 | 39 889 | 14,15 | ||||
| 2025-05-19 | 13F | Heck Capital Advisors, LLC | 0 | 0 | ||||||
| 2025-08-14 | 13F | GWM Advisors LLC | 33 467 | −60,80 | 1 673 | −60,81 | ||||
| 2025-07-21 | 13F | DHJJ Financial Advisors, Ltd. | 2 | 0,00 | 0 | |||||
| 2025-04-29 | 13F | Brookstone Capital Management | 0 | −100,00 | 0 | |||||
| 2025-08-07 | 13F | 49 Wealth Management, Llc | 222 297 | −16,80 | 11 114 | −16,83 | ||||
| 2025-08-14 | 13F | Susquehanna International Group, Llp | 54 708 | 70,63 | 2 735 | 70,62 | ||||
| 2025-07-03 | 13F | TrueWealth Advisors, LLC | 16 631 | −13,25 | 831 | −13,26 | ||||
| 2025-08-05 | 13F | Rareview Capital LLC | 53 821 | 0,00 | 2 691 | −0,04 | ||||
| 2025-07-28 | 13F | Harbour Investments, Inc. | 13 133 | −9,71 | 657 | −9,77 | ||||
| 2025-07-28 | 13F | RFG Advisory, LLC | 125 954 | 28,62 | 6 297 | 28,59 | ||||
| 2025-07-23 | 13F | RiverTree Advisors, LLC | 0 | −100,00 | 0 | |||||
| 2025-08-06 | 13F | AE Wealth Management LLC | 24 580 | 2 229,86 | 1 229 | 2 261,54 | ||||
| 2025-08-05 | 13F | Ceera Investments, Llc | 27 965 | −33,01 | 1 398 | −33,01 | ||||
| 2025-08-01 | 13F | Envestnet Asset Management Inc | 887 973 | 5,09 | 44 394 | 5,06 | ||||
| 2025-09-10 | 13F | WT Wealth Management | 17 777 | 889 | ||||||
| 2025-08-19 | 13F/A | Pitcairn Co | 25 450 | 0,00 | 1 272 | 0,00 | ||||
| 2025-08-14 | 13F | Family Office Research LLC | 235 946 | −37,96 | 11 796 | −37,98 | ||||
| 2025-08-05 | 13F | Bank Of Montreal /can/ | 54 561 | 14 646,22 | 2 728 | 15 050,00 | ||||
| 2025-08-08 | 13F | Pnc Financial Services Group, Inc. | 0 | −100,00 | 0 | |||||
| 2025-08-14 | 13F | Integrated Wealth Concepts LLC | 474 058 | 5,59 | 23 701 | 5,56 | ||||
| 2025-08-14 | 13F | Comerica Bank | 47 568 | 70,07 | 2 378 | 70,10 | ||||
| 2025-07-14 | 13F | Sterling Group Wealth Management, LLC | 23 533 | 1 177 | ||||||
| 2025-08-07 | 13F | Traynor Capital Management, Inc. | 7 074 | 352 | ||||||
| 2025-08-14 | 13F | Citadel Advisors Llc | 160 665 | 8 032 | ||||||
| 2025-07-31 | 13F | Stegent Equity Advisors, Inc. | 36 526 | −14,82 | 1 826 | −14,83 | ||||
| 2025-08-13 | 13F | EverSource Wealth Advisors, LLC | 4 748 | 31,31 | 237 | 31,67 | ||||
| 2025-07-23 | 13F | Kingswood Wealth Advisors, Llc | 0 | −100,00 | 0 | −100,00 | ||||
| 2025-07-30 | 13F | Red Crane Wealth Management, Llc | 15 945 | −17,07 | 797 | −17,07 | ||||
| 2025-08-29 | 13F | Centaurus Financial, Inc. | 11 776 | 38,98 | 1 |