Grundläggande statistik
| Portföljvärde | $ 192 529 365 |
| Aktuella positioner | 107 |
Senaste innehav, resultat, förvaltat kapital (från 13F, 13D)
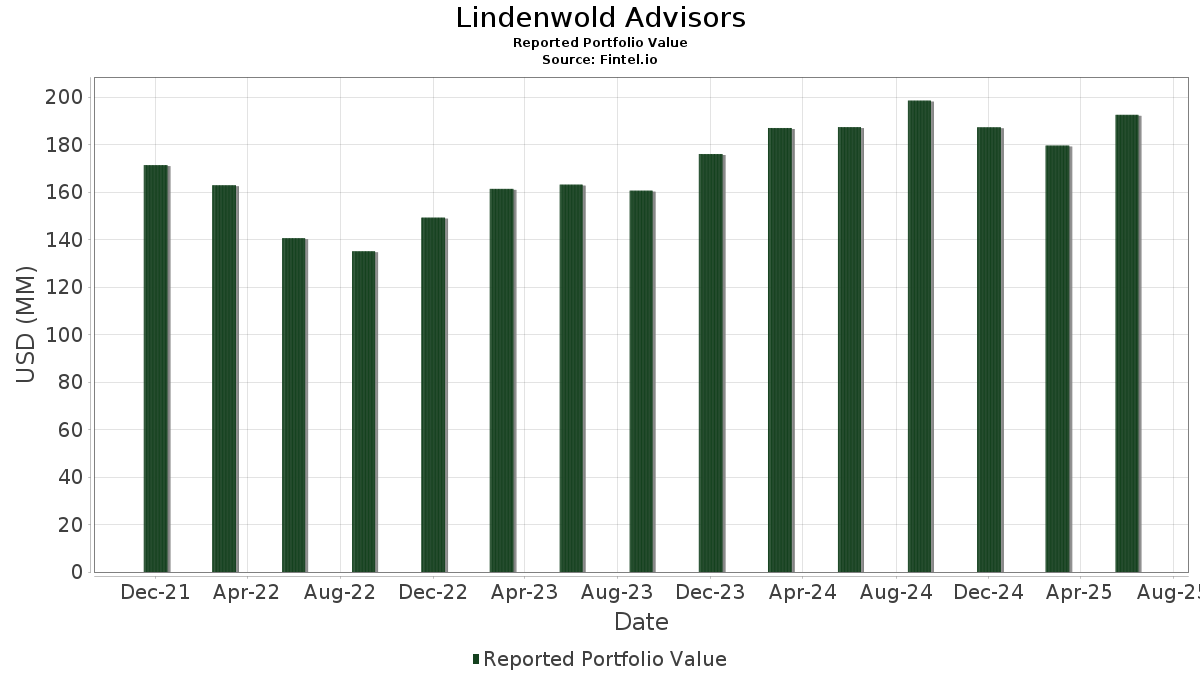
Lindenwold Advisors har redovisat 107 totala innehav i sina senaste SEC-arkiveringar. Det senaste portföljvärdet beräknas vara $ 192 529 365 USD. Faktiskt förvaltade tillgångar (AUM) är detta värde plus likvida medel (som inte redovisas). Lindenwold Advisorss största innehav är Vanguard STAR Funds - Vanguard Total International Stock ETF (US:VXUS) , iShares Trust - iShares National Muni Bond ETF (US:MUB) , Microsoft Corporation (US:MSFT) , Apple Inc. (US:AAPL) , and iShares Trust - iShares MBS ETF (US:MBB) . Lindenwold Advisorss nya positioner inkluderar ResMed Inc. (US:RMD) , Netflix, Inc. (US:NFLX) , The Sherwin-Williams Company (US:SHW) , Vanguard Municipal Bond Funds - Vanguard Short Duration Tax-Exempt Bond ETF (US:VSDM) , and AptarGroup, Inc. (US:ATR) .
Största ökningarna detta kvartal
Vi använder förändringen i portföljallokeringen eftersom det är det mest meningsfulla måttet. Förändringar kan bero på transaktioner eller förändringar i aktiekurser.
| Värdepapper | Aktier (MM) |
Värde (MM$) |
Portfölj % av | ΔPortfölj % av |
|---|---|---|---|---|
| 0,01 | 2,13 | 1,1049 | 1,1049 | |
| 0,02 | 8,93 | 4,6383 | 0,9559 | |
| 0,04 | 5,67 | 2,9474 | 0,7973 | |
| 0,31 | 21,74 | 11,2935 | 0,7508 | |
| 0,00 | 1,35 | 0,6990 | 0,6990 | |
| 0,00 | 1,30 | 0,6766 | 0,6766 | |
| 0,01 | 2,36 | 1,2260 | 0,3797 | |
| 0,00 | 3,65 | 1,8973 | 0,3299 | |
| 0,05 | 1,37 | 0,7099 | 0,3093 | |
| 0,01 | 0,58 | 0,2998 | 0,2998 |
Största minskningarna detta kvartal
Vi använder förändringen i portföljallokeringen eftersom det är det mest meningsfulla måttet. Förändringar kan bero på transaktioner eller förändringar i aktiepriser.
| Värdepapper | Aktier (MM) |
Värde (MM$) |
Portfölj % av | ΔPortfölj % av |
|---|---|---|---|---|
| 0,01 | 2,71 | 1,4083 | −1,0563 | |
| 0,01 | 1,59 | 0,8234 | −0,5791 | |
| 0,04 | 7,99 | 4,1516 | −0,5713 | |
| 0,00 | 2,06 | 1,0682 | −0,3332 | |
| 0,02 | 2,87 | 1,4931 | −0,2683 | |
| 0,01 | 3,26 | 1,6957 | −0,2642 | |
| 0,10 | 10,15 | 5,2726 | −0,2535 | |
| 0,04 | 4,64 | 2,4119 | −0,2040 | |
| 0,03 | 1,73 | 0,8991 | −0,1884 | |
| 0,01 | 3,26 | 1,6935 | −0,1857 |
13F- och fond arkiveringar
Denna blankett lämnades in den 2025-07-24 för rapporteringsperioden 2025-06-30. Klicka på länksymbolen för att se hela transaktionshistoriken.
Uppgradera för att låsa upp premiumdata och exportera till Excel![]() .
.
| Värdepapper | Typ | Genomsnittligt aktiepris | Aktier (MM) |
ΔAktier (%) |
ΔAktier (%) |
Värde ($MM) |
Portfölj (%) |
ΔPortfölj (%) |
|
|---|---|---|---|---|---|---|---|---|---|
| VXUS / Vanguard STAR Funds - Vanguard Total International Stock ETF | 0,31 | 3,22 | 21,74 | 14,84 | 11,2935 | 0,7508 | |||
| MUB / iShares Trust - iShares National Muni Bond ETF | 0,10 | 3,22 | 10,15 | 2,29 | 5,2726 | −0,2535 | |||
| MSFT / Microsoft Corporation | 0,02 | 1,91 | 8,93 | 35,04 | 4,6383 | 0,9559 | |||
| AAPL / Apple Inc. | 0,04 | 2,02 | 7,99 | −5,77 | 4,1516 | −0,5713 | |||
| MBB / iShares Trust - iShares MBS ETF | 0,07 | 11,95 | 6,36 | 12,10 | 3,3055 | 0,1440 | |||
| KORP / American Century ETF Trust - American Century Diversified Corporate Bond ETF | 0,13 | 12,78 | 6,19 | 13,59 | 3,2136 | 0,1802 | |||
| NVDA / NVIDIA Corporation | 0,04 | 0,81 | 5,67 | 46,96 | 2,9474 | 0,7973 | |||
| CORP / PIMCO ETF Trust - PIMCO Investment Grade Corporate Bond Index Exchange-Traded Fund | 0,06 | 12,63 | 5,59 | 13,26 | 2,9022 | 0,1551 | |||
| GOOGL / Alphabet Inc. | 0,03 | 2,36 | 5,14 | 16,67 | 2,6688 | 0,2162 | |||
| SUB / iShares Trust - iShares Short-Term National Muni Bond ETF | 0,04 | −1,85 | 4,64 | −1,15 | 2,4119 | −0,2040 | |||
| AVUV / American Century ETF Trust - Avantis U.S. Small Cap Value ETF | 0,05 | −0,76 | 4,36 | 3,71 | 2,2640 | −0,0761 | |||
| AMZN / Amazon.com, Inc. | 0,02 | 1,79 | 4,16 | 17,35 | 2,1606 | 0,1872 | |||
| META / Meta Platforms, Inc. | 0,00 | 1,33 | 3,65 | 29,78 | 1,8973 | 0,3299 | |||
| V / Visa Inc. | 0,01 | 4,95 | 3,57 | 6,32 | 1,8541 | −0,0154 | |||
| JPM / JPMorgan Chase & Co. | 0,01 | 2,51 | 3,42 | 21,16 | 1,7789 | 0,2048 | |||
| MMC / Marsh & McLennan Companies, Inc. | 0,01 | 3,52 | 3,26 | −7,25 | 1,6957 | −0,2642 | |||
| PGR / The Progressive Corporation | 0,01 | 2,46 | 3,26 | −3,38 | 1,6935 | −0,1857 | |||
| UNP / Union Pacific Corporation | 0,01 | 2,05 | 2,88 | −0,59 | 1,4965 | −0,1176 | |||
| ABBV / AbbVie Inc. | 0,02 | 2,58 | 2,87 | −9,14 | 1,4931 | −0,2683 | |||
| UNH / UnitedHealth Group Incorporated | 0,01 | 2,84 | 2,71 | −38,75 | 1,4083 | −1,0563 | |||
| SNA / Snap-on Incorporated | 0,01 | 2,84 | 2,50 | −5,05 | 1,2996 | −0,1676 | |||
| PG / The Procter & Gamble Company | 0,02 | 2,52 | 2,43 | −4,14 | 1,2632 | −0,1498 | |||
| ADBE / Adobe Inc. | 0,01 | 53,95 | 2,36 | 55,37 | 1,2260 | 0,3797 | |||
| KLAC / KLA Corporation | 0,00 | 1,81 | 2,31 | 34,13 | 1,2008 | 0,2413 | |||
| MCD / McDonald's Corporation | 0,01 | 2,71 | 2,26 | −3,91 | 1,1729 | −0,1359 | |||
| ULTA / Ulta Beauty, Inc. | 0,00 | 2,49 | 2,21 | 30,81 | 1,1491 | 0,2074 | |||
| RMD / ResMed Inc. | 0,01 | 2,13 | 1,1049 | 1,1049 | |||||
| LRCX / Lam Research Corporation | 0,02 | 1,22 | 2,11 | 35,54 | 1,0958 | 0,2290 | |||
| HD / The Home Depot, Inc. | 0,01 | 1,05 | 2,08 | 1,07 | 1,0807 | −0,0653 | |||
| BLK / BlackRock, Inc. | 0,00 | −26,29 | 2,06 | −18,28 | 1,0682 | −0,3332 | |||
| CDNS / Cadence Design Systems, Inc. | 0,01 | 0,61 | 1,89 | 21,91 | 0,9800 | 0,1181 | |||
| AEE / Ameren Corporation | 0,02 | 1,46 | 1,88 | −2,94 | 0,9760 | −0,1020 | |||
| TMUS / T-Mobile US, Inc. | 0,01 | 1,61 | 1,88 | −9,24 | 0,9753 | −0,1765 | |||
| EXPD / Expeditors International of Washington, Inc. | 0,02 | 2,10 | 1,87 | −3,01 | 0,9712 | −0,1021 | |||
| EA / Electronic Arts Inc. | 0,01 | 1,39 | 1,86 | 12,05 | 0,9662 | 0,0417 | |||
| GIS / General Mills, Inc. | 0,03 | 2,29 | 1,73 | −11,37 | 0,8991 | −0,1884 | |||
| PEP / PepsiCo, Inc. | 0,01 | 5,93 | 1,72 | −6,68 | 0,8918 | −0,1331 | |||
| CVX / Chevron Corporation | 0,01 | −26,47 | 1,59 | −37,05 | 0,8234 | −0,5791 | |||
| LMT / Lockheed Martin Corporation | 0,00 | 1,98 | 1,55 | 5,75 | 0,8035 | −0,0111 | |||
| CSCO / Cisco Systems, Inc. | 0,02 | 0,26 | 1,52 | 12,68 | 0,7899 | 0,0387 | |||
| ACN / Accenture plc | 0,00 | 0,30 | 1,49 | −3,93 | 0,7742 | −0,0897 | |||
| DFSV / Dimensional ETF Trust - Dimensional US Small Cap Value ETF | 0,05 | 81,72 | 1,37 | 89,99 | 0,7099 | 0,3093 | |||
| NFLX / Netflix, Inc. | 0,00 | 1,35 | 0,6990 | 0,6990 | |||||
| CW / Curtiss-Wright Corporation | 0,00 | −0,18 | 1,34 | 53,74 | 0,6943 | 0,2100 | |||
| SHW / The Sherwin-Williams Company | 0,00 | 1,30 | 0,6766 | 0,6766 | |||||
| EOG / EOG Resources, Inc. | 0,01 | 1,59 | 1,29 | −5,22 | 0,6702 | −0,0880 | |||
| PSA / Public Storage | 0,00 | 1,07 | 1,24 | −0,88 | 0,6459 | −0,0529 | |||
| CVLT / Commvault Systems, Inc. | 0,01 | 0,05 | 1,15 | 10,56 | 0,5988 | 0,0181 | |||
| DELL / Dell Technologies Inc. | 0,01 | 3,14 | 1,12 | 38,68 | 0,5793 | 0,1317 | |||
| MRK / Merck & Co., Inc. | 0,01 | 0,82 | 1,09 | −11,14 | 0,5682 | −0,1168 | |||
| CMCSA / Comcast Corporation | 0,03 | 2,94 | 1,06 | −0,47 | 0,5511 | −0,0423 | |||
| WSO / Watsco, Inc. | 0,00 | −0,21 | 1,05 | −13,28 | 0,5461 | −0,1292 | |||
| SCHO / Schwab Strategic Trust - Schwab Short-Term U.S. Treasury ETF | 0,04 | −7,95 | 1,03 | −7,87 | 0,5354 | −0,0871 | |||
| DVN / Devon Energy Corporation | 0,03 | 1,80 | 0,85 | −13,43 | 0,4425 | −0,1054 | |||
| SFM / Sprouts Farmers Market, Inc. | 0,01 | −14,29 | 0,83 | −7,58 | 0,4309 | −0,0688 | |||
| EWBC / East West Bancorp, Inc. | 0,01 | −0,29 | 0,69 | 12,21 | 0,3580 | 0,0159 | |||
| CBSH / Commerce Bancshares, Inc. | 0,01 | 1,37 | 0,67 | 1,21 | 0,3479 | −0,0204 | |||
| WSM / Williams-Sonoma, Inc. | 0,00 | −0,03 | 0,63 | 3,29 | 0,3266 | −0,0123 | |||
| CUBE / CubeSmart | 0,01 | 1,35 | 0,62 | 0,82 | 0,3214 | −0,0202 | |||
| MEDP / Medpace Holdings, Inc. | 0,00 | −0,10 | 0,60 | 2,75 | 0,3106 | −0,0130 | |||
| ORI / Old Republic International Corporation | 0,02 | 0,45 | 0,59 | −1,51 | 0,3044 | −0,0270 | |||
| VSDM / Vanguard Municipal Bond Funds - Vanguard Short Duration Tax-Exempt Bond ETF | 0,01 | 0,58 | 0,2998 | 0,2998 | |||||
| AIT / Applied Industrial Technologies, Inc. | 0,00 | −0,04 | 0,55 | 3,17 | 0,2875 | −0,0114 | |||
| EME / EMCOR Group, Inc. | 0,00 | 0,10 | 0,54 | 44,65 | 0,2814 | 0,0731 | |||
| RPM / RPM International Inc. | 0,00 | −0,11 | 0,52 | −5,14 | 0,2686 | −0,0350 | |||
| CSL / Carlisle Companies Incorporated | 0,00 | −0,08 | 0,49 | 9,60 | 0,2552 | 0,0055 | |||
| FDS / FactSet Research Systems Inc. | 0,00 | −0,77 | 0,46 | −2,53 | 0,2409 | −0,0236 | |||
| ATR / AptarGroup, Inc. | 0,00 | 0,45 | 0,2322 | 0,2322 | |||||
| CRUS / Cirrus Logic, Inc. | 0,00 | −0,05 | 0,44 | 4,53 | 0,2278 | −0,0057 | |||
| MTG / MGIC Investment Corporation | 0,02 | −0,26 | 0,44 | 12,11 | 0,2262 | 0,0098 | |||
| MUSA / Murphy USA Inc. | 0,00 | 0,00 | 0,42 | −13,37 | 0,2187 | −0,0521 | |||
| HALO / Halozyme Therapeutics, Inc. | 0,01 | 0,63 | 0,42 | −17,91 | 0,2167 | −0,0665 | |||
| OC / Owens Corning | 0,00 | −0,10 | 0,41 | −3,75 | 0,2138 | −0,0245 | |||
| TTEK / Tetra Tech, Inc. | 0,01 | −0,50 | 0,37 | 22,52 | 0,1924 | 0,0238 | |||
| SEIC / SEI Investments Company | 0,00 | −0,46 | 0,35 | 15,18 | 0,1816 | 0,0126 | |||
| TXRH / Texas Roadhouse, Inc. | 0,00 | 38,89 | 0,35 | 56,56 | 0,1801 | 0,0565 | |||
| CWST / Casella Waste Systems, Inc. | 0,00 | −6,65 | 0,34 | −3,41 | 0,1767 | −0,0194 | |||
| ROAD / Construction Partners, Inc. | 0,00 | −22,88 | 0,33 | 14,04 | 0,1730 | 0,0104 | |||
| DSGX / The Descartes Systems Group Inc. | 0,00 | −3,80 | 0,32 | −3,02 | 0,1672 | −0,0176 | |||
| USFD / US Foods Holding Corp. | 0,00 | 0,31 | 0,1619 | 0,1619 | |||||
| FFIN / First Financial Bankshares, Inc. | 0,01 | −0,37 | 0,31 | 0,00 | 0,1601 | −0,0119 | |||
| TTC / The Toro Company | 0,00 | −0,25 | 0,31 | −3,15 | 0,1599 | −0,0170 | |||
| MTDR / Matador Resources Company | 0,01 | −0,26 | 0,30 | −6,60 | 0,1543 | −0,0233 | |||
| HRB / H&R Block, Inc. | 0,01 | −4,33 | 0,29 | −4,55 | 0,1530 | −0,0185 | |||
| PEGA / Pegasystems Inc. | 0,01 | 0,29 | 0,1492 | 0,1492 | |||||
| OPCH / Option Care Health, Inc. | 0,01 | −0,34 | 0,29 | −7,47 | 0,1484 | −0,0234 | |||
| ESE / ESCO Technologies Inc. | 0,00 | −2,31 | 0,28 | 17,84 | 0,1476 | 0,0133 | |||
| RBC / RBC Bearings Incorporated | 0,00 | −15,12 | 0,28 | 1,45 | 0,1459 | −0,0082 | |||
| FSV / FirstService Corporation | 0,00 | −2,44 | 0,28 | 2,57 | 0,1451 | −0,0064 | |||
| NBIX / Neurocrine Biosciences, Inc. | 0,00 | 2,59 | 0,28 | 16,81 | 0,1447 | 0,0116 | |||
| WTRG / Essential Utilities, Inc. | 0,01 | −0,45 | 0,28 | −6,42 | 0,1439 | −0,0210 | |||
| GNTX / Gentex Corporation | 0,01 | −0,47 | 0,26 | −5,82 | 0,1345 | −0,0190 | |||
| VSMV / Victory Portfolios II - VictoryShares US Multi-Factor Minimum Volatility ETF | 0,01 | 14,77 | 0,26 | 16,74 | 0,1344 | 0,0110 | |||
| NOVT / Novanta Inc. | 0,00 | 18,21 | 0,25 | 18,84 | 0,1282 | 0,0129 | |||
| MMSI / Merit Medical Systems, Inc. | 0,00 | −3,32 | 0,24 | −14,49 | 0,1259 | −0,0320 | |||
| EXPO / Exponent, Inc. | 0,00 | −4,65 | 0,24 | −12,22 | 0,1232 | −0,0271 | |||
| STVN / Stevanato Group S.p.A. | 0,01 | 0,23 | 0,1191 | 0,1191 | |||||
| CHRD / Chord Energy Corporation | 0,00 | 0,04 | 0,22 | −13,95 | 0,1154 | −0,0285 | |||
| BCPC / Balchem Corporation | 0,00 | −2,80 | 0,22 | −7,17 | 0,1148 | −0,0172 | |||
| MUR / Murphy Oil Corporation | 0,01 | −0,08 | 0,22 | −20,80 | 0,1128 | −0,0400 | |||
| LNTH / Lantheus Holdings, Inc. | 0,00 | 3,92 | 0,22 | −12,85 | 0,1128 | −0,0259 | |||
| FSS / Federal Signal Corporation | 0,00 | 0,21 | 0,1078 | 0,1078 | |||||
| TBIL / The RBB Fund, Inc. - F/m US Treasury 3 Month Bill ETF | 0,00 | 0,00 | 0,21 | 0,00 | 0,1077 | −0,0078 | |||
| SSD / Simpson Manufacturing Co., Inc. | 0,00 | −2,20 | 0,21 | −3,27 | 0,1075 | −0,0117 | |||
| SPSC / SPS Commerce, Inc. | 0,00 | −2,31 | 0,20 | 0,00 | 0,1048 | −0,0074 | |||
| CCCS / CCC Intelligent Solutions Holdings Inc. | 0,02 | 19,66 | 0,16 | 25,20 | 0,0827 | 0,0116 | |||
| HLMN / Hillman Solutions Corp. | 0,01 | −2,47 | 0,07 | −20,65 | 0,0381 | −0,0135 | |||
| AAON / AAON, Inc. | 0,00 | −100,00 | 0,00 | 0,0000 | |||||
| SKX / Skechers U.S.A., Inc. | 0,00 | −100,00 | 0,00 | 0,0000 | |||||
| ARW / Arrow Electronics, Inc. | 0,00 | −100,00 | 0,00 | 0,0000 | |||||
| CSWI / CSW Industrials, Inc. | 0,00 | −100,00 | 0,00 | 0,0000 | |||||
| ASGN / ASGN Incorporated | 0,00 | −100,00 | 0,00 | 0,0000 | |||||
| NEOG / Neogen Corporation | 0,00 | −100,00 | 0,00 | 0,0000 | |||||
| HOLX / Hologic, Inc. | 0,00 | −100,00 | 0,00 | 0,0000 | |||||
| LMAT / LeMaitre Vascular, Inc. | 0,00 | −100,00 | 0,00 | 0,0000 | |||||
| AVY / Avery Dennison Corporation | 0,00 | −100,00 | 0,00 | 0,0000 | |||||
| CWAN / Clearwater Analytics Holdings, Inc. | 0,00 | −100,00 | 0,00 | 0,0000 |