Grundläggande statistik
| Institutionella aktier (lång) | 377 897 053 - 65,74% (ex 13D/G) - change of 13,15MM shares 3,61% MRQ |
| Institutionellt värde (lång) | $ 2 337 179 USD ($1000) |
Institutionellt ägande och aktieägare
NexGen Energy Ltd. (US:NXE) har 310 Institutionella ägare och aktieägare som har lämnat in 13D/G- eller 13F-formulär till Securities Exchange Commission (SEC). Dessa institut innehar totalt 378,040,453 aktier. Största aktieägare inkluderar L1 Capital Pty Ltd, MIRAE ASSET GLOBAL ETFS HOLDINGS Ltd., URA - Global X Uranium ETF, Vanguard Group Inc, Van Eck Associates Corp, Alps Advisors Inc, Segra Capital Management, LLC, Sprott Funds Trust - Sprott Uranium Miners Etf, NLR - VanEck Vectors Uranium+Nuclear Energy ETF, and Grantham, Mayo, Van Otterloo & Co. LLC .
NexGen Energy Ltd. (NYSE:NXE) Institutionell ägarstruktur visar institutioners och fonders nuvarande positioner i företaget, samt de senaste förändringarna i positionernas storlek. Större aktieägare kan vara enskilda investerare, fonder, hedgefonder eller institutioner. Bilaga 13D visar att investeraren äger (eller ägde) mer än 5% av företaget och avser (eller avsåg) att aktivt eftersträva en förändring av affärsstrategin. Schedule 13G indikerar en passiv investering på över 5%.
The share price as of September 8, 2025 is 7,98 / share. Previously, on September 9, 2024, the share price was 5,32 / share. This represents an increase of 49,91% over that period.

Fondsentimentets poäng
Fondsentimentet poängen(fka Ägarackumulation-poäng) visar vilka aktier som är mest köpta av fonder. Det är resultatet av en sofistikerad kvantitativ flerfaktormodell som identifierar företag med de högsta nivåerna av institutionell ackumulering. Poängsättningsmodellen använder en kombination av den totala ökningen av redovisade ägare, förändringarna i portföljallokeringarna för dessa ägare och andra mått. Siffran sträcker sig från 0 till 100, där högre siffror indikerar en högre nivå av ackumulering i förhållande till sina konkurrenter, och 50 är genomsnittet.
Uppdateringsfrekvens: Dagligen
Se Ownership Explorer, som innehåller en lista över de högst rankade företagen.
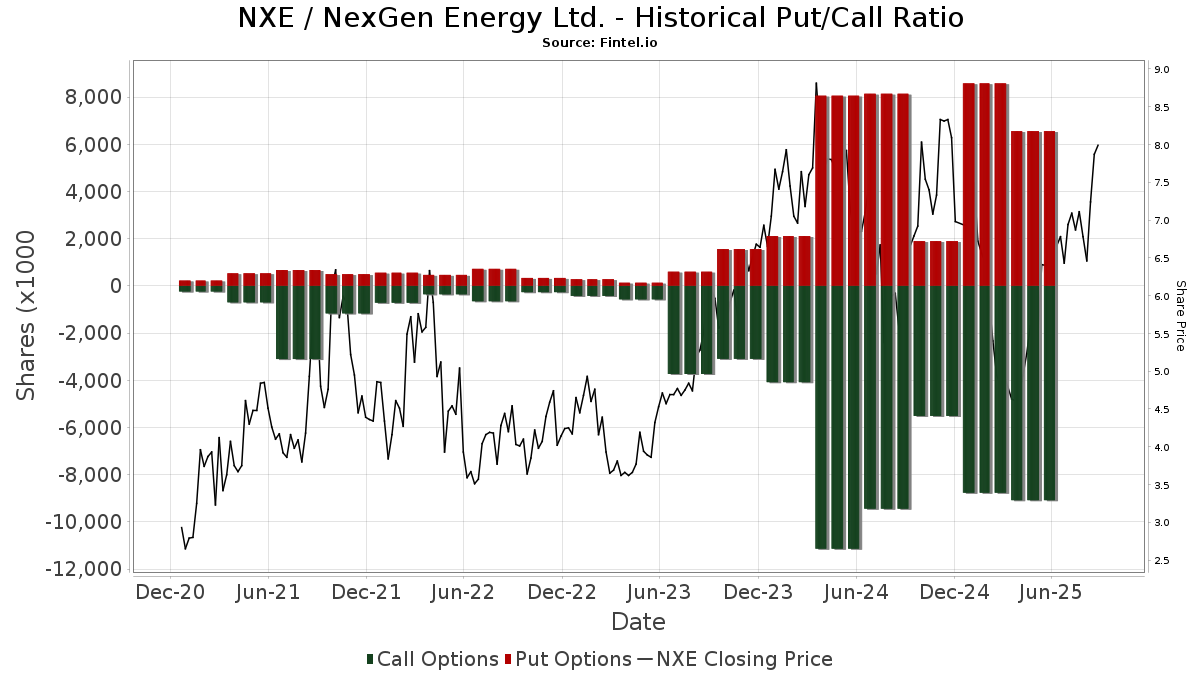
Institutionell sälj/köp-kvot
Förutom att rapportera vanliga eget kapital- och skuldemissioner måste institutioner med mer än 100MM tillgångar under förvaltning också avslöja sina innehav av sälj- och köpoptioner. Eftersom säljoptioner i allmänhet indikerar ett negativt sentiment och köpoptioner indikerar ett positivt sentiment, kan vi få en uppfattning om det övergripande institutionella sentimentet genom att plotta förhållandet mellan säljoptioner och köpoptioner. Diagrammet till höger visar det historiska förhållandet mellan sälj- och köpoptioner för detta instrument.
Genom att använda sälj/köp-kvoten som en indikator på aktieägarnas sentiment undviker man en av de största bristerna med att använda det totala institutionella ägandet, nämligen att en betydande del av de förvaltade tillgångarna investeras passivt för att följa index. Passivt förvaltade fonder köper vanligtvis inte optioner, så indikatorn för sälj/köp-kvoten ger en bättre bild av stämningen i aktivt förvaltade fonder.
13D/G-Arkiveringar
Vi presenterar 13D/G-arkiveringar separat från 13F-arkiveringar på grund av att de behandlas olika av SEC. 13D/G-arkiveringar kan lämnas in av grupper av investerare (med en ledare), medan 13F-arkiveringar inte kan det. Detta leder till situationer där en investerare kan lämna in en 13D/G-ansökan med ett värde för de totala aktierna (vilket motsvarar alla aktier som ägs av investerargruppen), men sedan lämna in en 13F-ansökan med ett annat värde för de totala aktierna (vilket motsvarar enbart deras eget ägande). Detta innebär att aktieägandet i 13D/G-arkiveringar och 13F-arkiveringar ofta inte är direkt jämförbara, så vi presenterar dem separat.
Notera: Från och med den 16 maj 2021 visar vi inte längre ägare som inte har lämnat in en 13D/G under det senaste året. Tidigare visade vi hela historiken för 13D/G-arkiveringar. I allmänhet måste enheter som är skyldiga att lämna in 13D/G-arkiveringar lämna in minst en gång per år innan de lämnar in en stängningsarkivering. Fonder avslutar dock ibland positioner utan att lämna in en avslutande arkivering (dvs. de avvecklar), så att visa hela historiken resulterade ibland i förvirring om det nuvarande ägandet. För att förhindra förvirring visar vi nu endast "nuvarande" ägare - det vill säga ägare som har lämnat in en ansökan under det senaste året.
Upgrade to unlock premium data.
| Fil Datum | Formulär | Investerare | Föregående aktier |
Senaste aktier |
Δ Aktier (Procent) |
Ägande (Procent) |
Δ Ägande (Procent) |
|
|---|---|---|---|---|---|---|---|---|
| 2024-11-14 | Global X Management CO LLC | 34,648,600 | 6.14 |
13F- och NPORT-arkiveringar
Detaljer om 13F-arkiveringar är gratis. Detaljer om NP-arkiveringar kräver ett premiummedlemskap. Gröna rader indikerar nya positioner. Röda rader indikerar stängda positioner. Klicka på länk symbolen för att se hela transaktionshistoriken.
Uppgradera
för att låsa upp premiumdata och exportera till Excel ![]() .
.
| Fil Datum | Källa | Investerare | Typ | Genomsnittligt pris (beräknat) |
Aktier | Δ Aktier (%) |
Rapporterat värde (1000 USD) |
Δ Värde (%) |
Portföljallokering (%) |
|
|---|---|---|---|---|---|---|---|---|---|---|
| 2025-04-08 | 13F | Rothschild Investment Llc | 0 | −100,00 | 0 | |||||
| 2025-05-14 | 13F | CIBC World Markets Inc. | Call | 0 | −100,00 | 0 | −100,00 | |||
| 2025-07-25 | 13F | JustInvest LLC | 36 833 | 139,36 | 256 | 269,57 | ||||
| 2025-08-13 | 13F | Russell Investments Group, Ltd. | 1 034 729 | 336,85 | 7 176 | 576,34 | ||||
| 2025-08-14 | 13F | Mariner, LLC | 16 304 | −6,14 | 113 | 44,87 | ||||
| 2025-07-24 | 13F | Financial Security Advisor, Inc. | 10 164 | 0,00 | 71 | 55,56 | ||||
| 2025-05-15 | 13F | Options Solutions, Llc | 0 | −100,00 | 0 | |||||
| 2025-08-07 | 13F | Tacita Capital Inc | 1 409 | 0,00 | 10 | 50,00 | ||||
| 2025-05-14 | 13F | OMERS ADMINISTRATION Corp | 0 | −100,00 | 0 | |||||
| 2025-08-14 | 13F | J. Goldman & Co LP | Call | 0 | −100,00 | 0 | ||||
| 2025-08-13 | 13F | Grantham, Mayo, Van Otterloo & Co. LLC | 9 219 454 | 18,01 | 63 918 | 82,56 | ||||
| 2025-08-14 | 13F | J. Goldman & Co LP | 0 | −100,00 | 0 | |||||
| 2025-08-25 | NP | MVALX - MERIDIAN CONTRARIAN FUND Legacy Class | 536 655 | 10,96 | 3 724 | 71,53 | ||||
| 2025-05-15 | 13F | Centiva Capital, LP | 0 | −100,00 | 0 | −100,00 | ||||
| 2025-08-07 | 13F | Compass Rose Asset Management, LP | 100 000 | 694 | ||||||
| 2025-08-13 | 13F | Marshall Wace, Llp | 6 204 620 | 15,60 | 43 060 | 78,68 | ||||
| 2025-08-26 | NP | DSMDX - Driehaus Small/Mid Cap Growth Fund | 82 553 | 48,15 | 573 | 128,80 | ||||
| 2025-08-14 | 13F | Susquehanna International Group, Llp | 1 484 462 | 17,88 | 10 302 | 82,21 | ||||
| 2025-08-14 | 13F | Susquehanna International Group, Llp | Call | 959 800 | −72,91 | 6 661 | −58,13 | |||
| 2025-08-14 | 13F | Susquehanna International Group, Llp | Put | 835 100 | −68,93 | 5 796 | −51,98 | |||
| 2025-08-14 | 13F | GeoSphere Capital Management | 300 000 | 2 082 | ||||||
| 2025-07-17 | 13F | Ausbil Investment Management Ltd | 107 000 | 72,58 | 743 | 166,91 | ||||
| 2025-08-14 | 13F | Qube Research & Technologies Ltd | 0 | −100,00 | 0 | |||||
| 2025-07-25 | NP | FILL - iShares MSCI Global Energy Producers ETF | 16 537 | −5,62 | 102 | 9,78 | ||||
| 2025-07-31 | 13F | Cambridge Investment Research Advisors, Inc. | 23 560 | −40,69 | 0 | |||||
| 2025-05-14 | 13F | Peak6 Llc | 0 | −100,00 | 0 | −100,00 | ||||
| 2025-08-13 | 13F | ExodusPoint Capital Management, LP | 500 654 | 3 | ||||||
| 2025-08-14 | 13F | MIRAE ASSET GLOBAL ETFS HOLDINGS Ltd. | 29 419 345 | −13,45 | 203 963 | 33,89 | ||||
| 2025-07-23 | 13F | Vontobel Holding Ltd. | 50 183 | −1,35 | 349 | 52,63 | ||||
| 2025-08-14 | 13F | Turim 21 Investimentos Ltda. | 123 215 | 0,00 | 855 | 54,61 | ||||
| 2025-08-05 | 13F | Bank Of Montreal /can/ | 2 001 209 | −2,03 | 13 911 | 51,92 | ||||
| 2025-08-13 | 13F | 1832 Asset Management L.P. | 2 382 176 | −10,15 | 16 532 | 38,88 | ||||
| 2025-08-14 | 13F | Balyasny Asset Management Llc | 438 447 | −22,28 | 3 043 | 20,09 | ||||
| 2025-05-09 | 13F | CenterBook Partners LP | 0 | −100,00 | 0 | |||||
| 2025-08-14 | 13F | Group One Trading, L.p. | Put | 142 200 | −2,34 | 987 | 51,00 | |||
| 2025-03-21 | NP | PASIX - PACE Alternative Strategies Investments Class A | Short | −15 600 | −102 | |||||
| 2025-05-15 | 13F | Oxford Asset Management Llp | 23 718 | −21,88 | 106 | −47,00 | ||||
| 2025-06-26 | NP | KGGAX - KOPERNIK GLOBAL ALL-CAP FUND CLASS A SHARES | 2 419 938 | 140,09 | 12 656 | 108,06 | ||||
| 2025-06-25 | NP | CDAZX - Multi-Manager Directional Alternative Strategies Fund Institutional Class | 0 | −100,00 | 0 | −100,00 | ||||
| 2025-07-30 | NP | TGFRX - TANAKA Growth Fund Class R | 190 889 | −29,01 | 1 174 | −17,63 | ||||
| 2025-08-14 | 13F | Alliancebernstein L.p. | 2 836 189 | −8,40 | 19 683 | 41,59 | ||||
| 2025-08-14 | 13F | Driehaus Capital Management Llc | 3 360 064 | 48,73 | 23 319 | 129,89 | ||||
| 2025-06-18 | NP | RMYAX - Multi-Strategy Income Fund Class A | 10 417 | 54 | ||||||
| 2025-08-14 | 13F | Masters Capital Management Llc | 2 000 000 | 0,00 | 13 880 | 54,57 | ||||
| 2025-08-13 | 13F | Lido Advisors, LLC | 10 100 | −1,57 | 70 | 52,17 | ||||
| 2025-08-12 | 13F | Deutsche Bank Ag\ | 30 968 | 0,00 | 215 | 53,96 | ||||
| 2025-08-12 | 13F | Winnow Wealth Llc | 143 635 | 997 | ||||||
| 2025-06-26 | NP | AMTAX - AB All Market Real Return Portfolio Class A | 66 540 | 348 | ||||||
| 2025-06-26 | NP | TIOIX - TIAA-CREF International Opportunities Fund Institutional Class | 0 | −100,00 | 0 | −100,00 | ||||
| 2025-08-11 | 13F | Persistent Asset Partners Ltd | 278 082 | 7,52 | 1 931 | 66,38 | ||||
| 2025-08-13 | 13F | Northwest & Ethical Investments L.P. | 102 831 | 23,27 | 707 | 88,77 | ||||
| 2025-08-12 | 13F | Franklin Resources Inc | 31 248 | −5,37 | 217 | 46,62 | ||||
| 2025-08-11 | 13F | Citigroup Inc | 442 128 | 1 963,51 | 3 065 | 3 092,71 | ||||
| 2025-08-14 | 13F | Anson Funds Management LP | 0 | −100,00 | 0 | |||||
| 2025-05-15 | 13F | Scopus Asset Management, L.p. | 0 | −100,00 | 0 | |||||
| 2025-08-27 | NP | TIFF INVESTMENT PROGRAM - TIFF Multi-Asset Fund | 140 419 | 93,68 | 975 | 199,69 | ||||
| 2025-07-22 | NP | DSMFX - Destinations Small-Mid Cap Equity Fund Class I | 221 760 | 11,21 | 1 370 | 29,98 | ||||
| 2025-08-14 | 13F | Kingdon Capital Management, L.l.c. | 1 977 837 | 5,33 | 13 726 | 62,80 | ||||
| 2025-08-14 | 13F | Hood River Capital Management LLC | 0 | −100,00 | 0 | |||||
| 2025-08-14 | 13F | Citadel Advisors Llc | 685 673 | −90,57 | 4 759 | −85,42 | ||||
| 2025-08-14 | 13F | Citadel Advisors Llc | Call | 2 727 800 | 2 353,06 | 18 931 | 3 693,59 | |||
| 2025-08-14 | 13F | Citadel Advisors Llc | Put | 4 217 400 | 0,09 | 29 269 | 54,70 | |||
| 2025-08-12 | 13F | Aviso Financial Inc. | 2 476 | 0,00 | 17 | 54,55 | ||||
| 2025-05-12 | 13F | Aigen Investment Management, Lp | 0 | −100,00 | 0 | |||||
| 2025-08-11 | 13F | Sprott Inc. | 419 240 | 3,55 | 2 917 | 60,54 | ||||
| 2025-08-14 | 13F | SummitTX Capital, L.P. | 265 111 | 1 840 | ||||||
| 2025-08-12 | 13F | Dynamic Technology Lab Private Ltd | 52 519 | 364 | ||||||
| 2025-08-14 | 13F | Lloyd Harbor Capital Management, LLC | Call | 0 | −100,00 | 0 | −100,00 | |||
| 2025-07-29 | 13F | Violich Capital Management, Inc. | 45 400 | −50,16 | 315 | |||||
| 2025-08-01 | 13F | Jennison Associates Llc | 379 576 | −4,53 | 2 639 | 48,04 | ||||
| 2025-08-14 | 13F | PenderFund Capital Management Ltd. | 11 600 | 0,00 | 81 | −87,90 | ||||
| 2025-06-27 | NP | MGNR - American Beacon GLG Natural Resources ETF | 233 980 | 47,58 | 1 224 | 17,60 | ||||
| 2025-08-06 | 13F | Stone House Investment Management, LLC | 0 | −100,00 | 0 | −100,00 | ||||
| 2025-08-14 | 13F | CIBC World Markets Inc. | 80 334 | −39,95 | 559 | −6,84 | ||||
| 2025-08-13 | 13F | Bank Of Nova Scotia | 0 | −100,00 | 0 | −100,00 | ||||
| 2025-08-07 | 13F | Zurcher Kantonalbank (Zurich Cantonalbank) | 222 927 | 20,23 | 1 546 | 86,14 | ||||
| 2025-08-13 | 13F | Falcon Edge Capital, LP | 753 195 | 56,23 | 5 227 | 141,54 | ||||
| 2025-05-07 | 13F | Fiera Capital Corp | 0 | −100,00 | 0 | |||||
| 2025-05-28 | NP | QCGLRX - Global Equities Account Class R1 | 0 | −100,00 | 0 | −100,00 | ||||
| 2025-08-12 | 13F | Goehring & Rozencwajg Associates, LLC | 1 445 108 | −1,89 | 10 029 | 35,11 | ||||
| 2025-08-12 | 13F | CIBC Private Wealth Group, LLC | 2 400 | 0,00 | 17 | 77,78 | ||||
| 2025-08-06 | 13F | Pekin Hardy Strauss, Inc. | 169 200 | 5,62 | 1 174 | 63,28 | ||||
| 2025-08-14 | 13F | Voya Investment Management Llc | 675 717 | −23,16 | 4 689 | 18,77 | ||||
| 2025-08-12 | 13F | Proequities, Inc. | Put | 0 | 0 | |||||
| 2025-05-14 | 13F | PineBridge Investments, L.P. | 0 | −100,00 | 0 | |||||
| 2025-08-12 | 13F | Proequities, Inc. | 0 | 0 | ||||||
| 2025-08-14 | 13F | Raymond James Financial Inc | Put | 6 900 | 41 | |||||
| 2025-06-26 | NP | KGIIX - KOPERNIK INTERNATIONAL FUND CLASS I SHARES | 1 248 830 | 6 531 | ||||||
| 2025-08-14 | 13F | BRITISH COLUMBIA INVESTMENT MANAGEMENT Corp | 345 664 | 7,87 | 2 403 | 67,27 | ||||
| 2025-08-14 | 13F | ArrowMark Colorado Holdings LLC | 536 655 | 10,96 | 3 724 | 71,53 | ||||
| 2025-08-14 | 13F | Raymond James Financial Inc | 839 080 | 31,29 | 5 823 | 102,96 | ||||
| 2025-08-14 | 13F | Tudor Investment Corp Et Al | 39 690 | 275 | ||||||
| 2025-08-13 | 13F | Tejara Capital Ltd | 385 469 | −19,45 | 2 675 | 24,53 | ||||
| 2025-08-13 | 13F | Quantbot Technologies LP | 150 216 | −81,34 | 1 042 | −71,18 | ||||
| 2025-08-25 | NP | AMERICAN FUNDS INSURANCE SERIES - Global Small Capitalization Fund Class 1 This fund is a listed as child fund of Capital World Investors and if that institution has disclosed ownership in this security, then these positions will not be double counted when calculating total shares and total value | 380 341 | 38,01 | 2 640 | 113,34 | ||||
| 2025-08-14 | 13F | Cinctive Capital Management LP | 831 675 | 5 772 | ||||||
| 2025-07-14 | 13F | Legacy Capital Group California, Inc. | 76 530 | 47,76 | 531 | 128,88 | ||||
| 2025-07-24 | 13F | Us Bancorp \de\ | 14 430 | 0,00 | 100 | 56,25 | ||||
| 2025-08-14 | 13F | Caption Management, LLC | 176 187 | 1 882,97 | 1 223 | 3 033,33 | ||||
| 2025-07-14 | 13F | Pacifica Partners Inc. | 21 000 | 0,00 | 143 | 52,13 | ||||
| 2025-08-14 | 13F | Nokomis Capital, L.L.C. | 1 564 848 | 8,67 | 10 860 | 67,98 | ||||
| 2025-07-24 | 13F | U S Global Investors Inc | 0 | −100,00 | 0 | −100,00 | ||||
| 2025-08-12 | 13F | Fulcrum Asset Management LLP | 12 556 | 87 | ||||||
| 2025-08-19 | 13F/A | L1 Capital Pty Ltd | 33 816 063 | 10,35 | 234 683 | 70,84 | ||||
| 2025-05-14 | 13F/A | Norges Bank | 144 496 | 1 124 | ||||||
| 2025-08-13 | 13F | Flow Traders U.s. Llc | 10 903 | 0 | ||||||
| 2025-08-14 | 13F | Peak6 Llc | Put | 425 100 | 2 950 | |||||
| 2025-08-14 | 13F | Peak6 Llc | Call | 3 019 000 | 174,23 | 20 952 | 323,85 | |||
| 2025-08-13 | 13F | Walleye Capital LLC | 45 443 | 315 | ||||||
| 2025-08-13 | 13F | Walleye Capital LLC | Call | 84 700 | −39,11 | 588 | −5,93 | |||
| 2025-08-13 | 13F | Walleye Capital LLC | Put | 87 900 | 24,15 | 610 | 92,43 | |||
| 2025-07-21 | 13F | Azarias Capital Management, L.P. | 1 414 414 | −20,92 | 9 816 | 22,23 | ||||
| 2025-07-25 | NP | WSML - iShares MSCI World Small-Cap ETF | 31 031 | 191 | ||||||
| 2025-08-27 | NP | TPDAX - Timothy Plan Defensive Strategies Fund Class A | 7 557 | 0,00 | 52 | 57,58 | ||||
| 2025-07-31 | 13F | Anthracite Investment Company, Inc. | 1 314 887 | 0,00 | 9 125 | 54,58 | ||||
| 2025-08-14 | 13F | Macquarie Group Ltd | 95 209 | 13,21 | 661 | 75,07 | ||||
| 2025-08-12 | 13F | Virtu Financial LLC | 128 096 | 1 | ||||||
| 2025-07-14 | 13F | AdvisorNet Financial, Inc | 3 343 | 47,53 | 23 | 130,00 | ||||
| 2025-08-08 | 13F | Alberta Investment Management Corp | 0 | −100,00 | 0 | −100,00 | ||||
| 2025-08-14 | 13F | CoreCommodity Management, LLC | 114 498 | −65,29 | 795 | −46,39 | ||||
| 2025-08-14 | 13F | Bnp Paribas | 0 | −100,00 | 0 | −100,00 | ||||
| 2025-05-15 | 13F | BW Gestao de Investimentos Ltda. | Put | 0 | −100,00 | 0 | −100,00 | |||
| 2025-08-29 | NP | FTWO - Strive FAANG 2.0 ETF | 24 001 | 24,29 | 167 | 93,02 | ||||
| 2025-08-07 | 13F | Rathbone Brothers plc | 33 131 | 0,00 | 230 | 54,73 | ||||
| 2025-08-14 | 13F | Millennium Management Llc | 5 122 491 | 24,89 | 35 563 | 93,21 | ||||
| 2025-08-14 | 13F | Schonfeld Strategic Advisors LLC | 42 622 | 139,45 | 296 | 273,42 | ||||
| 2025-08-14 | 13F | Mountaineer Partners Management, LLC | 564 507 | 0,00 | 3 918 | 54,58 | ||||
| 2025-05-14 | 13F | Group One Trading, L.p. | 0 | −100,00 | 0 | −100,00 | ||||
| 2025-08-19 | 13F | Advisory Services Network, LLC | 16 650 | −33,40 | 112 | −0,89 | ||||
| 2025-08-14 | 13F | Jane Street Group, Llc | 1 053 129 | 579,20 | 7 309 | 950,00 | ||||
| 2025-08-25 | NP | SMCWX - SMALLCAP WORLD FUND INC Class A | 2 783 977 | 28,75 | 19 321 | 99,01 | ||||
| 2025-08-12 | 13F | Accordant Advisory Group Inc | 143 635 | 3,18 | 997 | 59,36 | ||||
| 2025-04-30 | 13F | Silphium Asset Management Ltd | 0 | −100,00 | 0 | |||||
| 2025-07-23 | 13F | Rye Brook Capital LLC | 767 900 | 6,27 | 5 | 66,67 | ||||
| 2025-08-14 | 13F | Freshford Capital Management, LLC | 1 117 852 | 7 758 | ||||||
| 2025-08-27 | 13F/A | Squarepoint Ops LLC | Put | 0 | −100,00 | 0 | −100,00 | |||
| 2025-08-13 | 13F | Beacon Pointe Advisors, LLC | 37 000 | 117,65 | 257 | 236,84 | ||||
| 2025-08-14 | 13F | Cibc World Markets Corp | 104 500 | −59,81 | 725 | −37,87 | ||||
| 2025-05-12 | 13F | Telemark Asset Management, LLC | 0 | −100,00 | 0 | |||||
| 2025-06-25 | NP | CCNR - ALPS | CoreCommodity Natural Resources ETF | 368 679 | 1 850,99 | 1 928 | 1 867,35 | ||||
| 2025-08-08 | 13F | Garnet Equity Capital Holdings, Inc. | 400 000 | −20,00 | 2 776 | 23,65 | ||||
| 2025-04-17 | 13F | Janney Montgomery Scott LLC | 0 | −100,00 | 0 | |||||
| 2025-08-01 | 13F | Vision Financial Markets Llc | 40 | 0,00 | 0 | |||||
| 2025-05-15 | 13F | Engineers Gate Manager LP | 0 | −100,00 | 0 | |||||
| 2025-08-14 | 13F | CoreCap Advisors, LLC | 8 748 | 0,10 | 61 | 53,85 | ||||
| 2025-07-14 | 13F | Kapitalo Investimentos Ltda | 1 608 804 | 54,83 | 11 165 | 139,34 | ||||
| 2025-08-14 | 13F | Ubs Asset Management Americas Inc | 677 541 | −3,90 | 4 702 | 48,56 | ||||
| 2025-08-14 | 13F | Bnp Paribas Arbitrage, Sa | 928 237 | 1 674,39 | 6 442 | 2 652,56 | ||||
| 2025-08-08 | 13F | Pnc Financial Services Group, Inc. | 0 | −100,00 | 0 | −100,00 | ||||
| 2025-07-30 | 13F | FNY Investment Advisers, LLC | Call | 0 | −100,00 | 0 | ||||
| 2025-08-13 | 13F | BCJ Capital Management, LLC | 0 | −100,00 | 0 | −100,00 | ||||
| 2025-05-15 | 13F | Polar Asset Management Partners Inc. | 0 | −100,00 | 0 | −100,00 | ||||
| 2025-08-13 | 13F | Jones Financial Companies Lllp | 8 311 | 26,98 | 57 | 93,10 | ||||
| 2025-07-11 | 13F | Farther Finance Advisors, LLC | 58 | 0,00 | 0 | |||||
| 2025-08-18 | 13F | Wolverine Trading, Llc | 114 194 | 549,12 | 777 | 870,00 | ||||
| 2025-04-22 | 13F | Madison Wealth Partners, Inc | 0 | −100,00 | 0 | −100,00 | ||||
| 2025-08-14 | 13F | Sig Brokerage, Lp | 13 769 | −15,88 | 96 | 30,14 | ||||
| 2025-08-11 | 13F | Vanguard Group Inc | 20 923 707 | −0,16 | 145 357 | 54,75 | ||||
| 2025-08-13 | 13F | Invesco Ltd. | 26 153 | −2,02 | 182 | 52,10 | ||||
| 2025-08-18 | 13F | Wolverine Trading, Llc | Call | 278 200 | 42,74 | 1 892 | 113,43 | |||
| 2025-08-18 | 13F | Wolverine Trading, Llc | Put | 91 700 | −26,11 | 624 | 10,46 | |||
| 2025-08-12 | 13F | Catalyst Funds Management Pty Ltd | 223 300 | 1 550 | ||||||
| 2025-07-30 | 13F | FNY Investment Advisers, LLC | 14 606 | 0 | ||||||
| 2025-07-16 | 13F | St Germain D J Co Inc | 1 000 | 0,00 | 7 | 50,00 | ||||
| 2025-08-15 | 13F | Ion Asset Management Ltd. | 67 000 | 465 | ||||||
| 2025-08-14 | 13F | Mpwm Advisory Solutions, Llc | 1 400 | 0,00 | 10 | 50,00 | ||||
| 2025-08-13 | 13F | Renaissance Technologies Llc | 2 958 800 | −31,72 | 20 534 | 5,54 | ||||
| 2025-05-13 | 13F | EverSource Wealth Advisors, LLC | 0 | −100,00 | 0 | |||||
| 2025-08-11 | 13F | Banque Cantonale Vaudoise | 67 454 | 0 | ||||||
| 2025-08-05 | 13F | Ninepoint Partners LP | 380 000 | 0,00 | 2 637 | 54,57 | ||||
| 2025-08-14 | 13F | Bank Of America Corp /de/ | 411 039 | −81,91 | 2 853 | −72,04 | ||||
| 2025-08-14 | 13F | Nebula Research & Development LLC | 113 708 | 22,69 | 789 | 89,66 | ||||
| 2025-08-18 | 13F/A | National Bank Of Canada /fi/ | 534 523 | 42,37 | 3 693 | 120,68 | ||||
| 2025-07-25 | NP | SCHC - Schwab International Small-Cap Equity ETF This fund is a listed as child fund of Charles Schwab Investment Management Inc and if that institution has disclosed ownership in this security, then these positions will not be double counted when calculating total shares and total value | 981 353 | −1,00 | 6 038 | 15,01 | ||||
| 2025-08-15 | 13F | Kestra Advisory Services, LLC | 12 065 | −41,68 | 84 | −9,78 | ||||
| 2025-05-15 | 13F | Millennium Management Llc | Call | 0 | −100,00 | 0 | −100,00 | |||
| 2025-09-04 | 13F/A | Advisor Group Holdings, Inc. | 35 057 | 5,74 | 243 | 64,19 | ||||
| 2025-04-18 | 13F | PKO Investment Management Joint-Stock Co | 0 | −100,00 | 0 | |||||
| 2025-08-13 | 13F | Scotia Capital Inc. | 132 377 | 367,35 | 909 | 626,40 | ||||
| 2025-08-28 | NP | QCSTRX - Stock Account Class R1 | 424 986 | −8,85 | 2 952 | 41,31 | ||||
| 2025-08-12 | 13F | Charles Schwab Investment Management Inc | 949 367 | −3,52 | 6 582 | 49,26 | ||||
| 2025-07-24 | 13F | Blair William & Co/il | 13 921 | 0,00 | 97 | 54,84 | ||||
| 2025-08-14 | 13F | Jane Street Group, Llc | Put | 52 800 | 98,50 | 366 | 207,56 | |||
| 2025-08-14 | 13F | Jane Street Group, Llc | Call | 394 500 | −71,43 | 2 738 | −55,84 | |||
| 2025-08-14 | 13F | Goldman Sachs Group Inc | 4 504 768 | 50,81 | 31 263 | 133,11 | ||||
| 2025-08-14 | 13F | Lombard Odier Asset Management (USA) Corp | 221 504 | 1 537 | ||||||
| 2025-05-15 | 13F | Aquatic Capital Management LLC | 0 | −100,00 | 0 | |||||
| 2025-05-15 | 13F | Cubist Systematic Strategies, LLC | 0 | −100,00 | 0 | |||||
| 2025-07-14 | 13F | Southland Equity Partners LLC | 13 747 | 0,00 | 95 | 55,74 | ||||
| 2025-07-31 | 13F | Fielder Capital Group LLC | 323 375 | −1,83 | 2 244 | 51,72 | ||||
| 2025-08-13 | 13F | StoneX Group Inc. | 0 | −100,00 | 0 | −100,00 | ||||
| 2025-08-01 | 13F | Y-Intercept (Hong Kong) Ltd | 581 789 | 4 038 | ||||||
| 2025-08-14 | 13F | Graham Capital Management, L.P. | 0 | −100,00 | 0 | |||||
| 2025-08-25 | 13F/A | NewGen Asset Management Ltd | 1 200 000 | 8 328 | ||||||
| 2025-09-04 | 13F | SevenBridge Financial Group, LLC | 12 250 | 0,00 | 85 | 21,74 | ||||
| 2025-07-22 | 13F | Silver Lake Advisory, LLC | 11 000 | 0,00 | 76 | 55,10 | ||||
| 2025-08-11 | 13F | TD Waterhouse Canada Inc. | 122 933 | −14,17 | 826 | 27,27 | ||||
| 2025-08-11 | 13F | NewGen Equity Long/Short Fund | 1 200 000 | 8 328 | ||||||
| 2025-08-12 | 13F | Trexquant Investment LP | 374 836 | 302,00 | 2 601 | 522,25 | ||||
| 2025-05-15 | 13F | Verition Fund Management LLC | 0 | −100,00 | 0 | −100,00 | ||||
| 2025-07-29 | NP | GMOYX - GMO Resource Transition Fund Class VI | 469 000 | 76,98 | 2 891 | 106,94 | ||||
| 2025-08-04 | 13F | Muzinich & Co., Inc. | Call | 35 000 | 243 | |||||
| 2025-08-12 | 13F | Swiss National Bank | 1 040 200 | −0,59 | 7 198 | 53,38 | ||||
| 2025-05-15 | 13F | Philadelphia Financial Management of San Francisco, LLC | 0 | −100,00 | 0 | |||||
| 2025-08-14 | 13F | Black Maple Capital Management LP | 91 200 | 0,00 | 633 | 54,52 | ||||
| 2025-08-08 | 13F | Old West Investment Management, LLC | 2 534 801 | 29,74 | 17 604 | 100,68 | ||||
| 2025-08-12 | 13F | Steward Partners Investment Advisory, Llc | 15 336 | −39,71 | 106 | −7,02 | ||||
| 2025-08-08 | 13F | SBI Securities Co., Ltd. | 902 | 27,40 | 6 | 100,00 | ||||
| 2025-07-01 | 13F | Confluence Investment Management Llc | 69 649 | 483 | ||||||
| 2025-08-15 | 13F | Tower Research Capital LLC (TRC) | 10 036 | −88,69 | 70 | −82,66 | ||||
| 2025-07-23 | 13F | Tcfg Wealth Management, Llc | 62 500 | −0,79 | 434 | 53,55 | ||||
| 2025-05-12 | 13F | Operose Advisors LLC | 0 | −100,00 | 0 | |||||
| 2025-08-12 | 13F | XTX Topco Ltd | 89 291 | 620 | ||||||
| 2025-06-26 | NP | IDEV - iShares Core MSCI International Developed Markets ETF | 429 796 | 9,40 | 2 251 | −12,28 | ||||
| 2025-05-15 | 13F | Tanaka Capital Management Inc | 569 675 | −0,83 | 3 | −33,33 | ||||
| 2025-07-14 | 13F | UMA Financial Services, Inc. | 35 | 0,00 | 0 | |||||
| 2025-08-08 | 13F | Abc Arbitrage Sa | 43 359 | 9,72 | 301 | 69,49 | ||||
| 2025-07-29 | 13F | CapWealth Advisors, LLC | 14 000 | −33,33 | 97 | 3,19 | ||||
| 2025-08-14 | 13F | Cantor Fitzgerald, L. P. | 90 109 | 99,00 | 625 | 207,88 | ||||
| 2025-06-25 | NP | PGNAX - PGIM Jennison Natural Resources Fund Class A | 384 513 | 5,63 | 2 014 | −15,28 | ||||
| 2025-08-14 | 13F | Vident Advisory, LLC | 2 761 974 | 35,07 | 19 168 | 108,78 | ||||
| 2025-08-01 | 13F | Envestnet Asset Management Inc | 328 048 | 61,64 | 2 277 | 149,84 | ||||
| 2025-08-12 | 13F | Eisler Capital Management Ltd. | 33 873 | 235 | ||||||
| 2025-05-15 | 13F | Numerai GP LLC | 0 | −100,00 | 0 | |||||
| 2025-08-14 | 13F | Toronto Dominion Bank | 38 573 | 11,06 | 268 | 72,90 | ||||
| 2025-08-14 | 13F | Encompass Capital Advisors LLC | 3 651 140 | −12,09 | 25 353 | 36,06 | ||||
| 2025-05-15 | 13F | Mirabella Financial Services Llp | 0 | −100,00 | 0 | −100,00 | ||||
| 2025-07-29 | 13F | Stanley-Laman Group, Ltd. | 451 054 | −8,52 | 3 130 | 41,44 | ||||
| 2025-03-27 | NP | ASGCX - Allspring Global Long/Short Equity Fund Class C | Short | −127 800 | −834 | |||||
| 2025-08-04 | 13F | Beirne Wealth Consulting Services, LLC | 25 000 | 0,00 | 174 | 54,46 | ||||
| 2025-07-16 | 13F | ORG Partners LLC | 1 610 | −19,90 | 11 | 11,11 | ||||
| 2025-08-04 | 13F | Spire Wealth Management | 3 919 | −54,53 | 27 | −28,95 | ||||
| 2025-08-13 | 13F | Natixis Advisors, L.p. | 121 034 | 40,24 | 1 | |||||
| 2025-08-08 | 13F | Larson Financial Group LLC | 10 775 | 1,89 | 75 | 57,45 | ||||
| 2025-08-14 | 13F | Banque Transatlantique SA | 0 | −100,00 | 0 | |||||
| 2025-07-28 | 13F | Harbour Investments, Inc. | 0 | −100,00 | 0 | |||||
| 2025-08-14 | 13F | Banco BTG Pactual S.A. | 0 | −100,00 | 0 | |||||
| 2025-07-22 | 13F | IMC-Chicago, LLC | 230 357 | −23,07 | 1 599 | 18,90 | ||||
| 2025-08-14 | 13F | Parallax Volatility Advisers, L.P. | Call | 5 600 | −77,60 | 39 | −66,07 | |||
| 2025-07-22 | 13F | IMC-Chicago, LLC | Put | 232 400 | −17,71 | 1 613 | 27,23 | |||
| 2025-08-14 | 13F | Parallax Volatility Advisers, L.P. | 90 313 | 627 | ||||||
| 2025-08-14 | 13F | Parallax Volatility Advisers, L.P. | Put | 100 000 | 694 | |||||
| 2025-08-14 | 13F | GWM Advisors LLC | 142 691 | −5,77 | 990 | 45,80 | ||||
| 2025-08-14 | 13F | Optiver Holding B.V. | 35 | −65,69 | 0 | |||||
| 2025-08-08 | 13F | Gts Securities Llc | 39 182 | 272 | ||||||
| 2025-07-23 | 13F | Shell Asset Management Co | 29 602 | 2,21 | 0 | |||||
| 2025-04-22 | 13F | Packer & Co Ltd | 3 024 793 | 14 | ||||||
| 2025-08-14 | 13F/A | Barclays Plc | 143 039 | −0,73 | 1 | |||||
| 2025-08-05 | 13F | Simplex Trading, Llc | Put | 105 400 | −69,63 | 1 | −100,00 | |||
| 2025-08-05 | 13F | Simplex Trading, Llc | 280 171 | −9,61 | 2 | 0,00 | ||||
| 2025-08-14 | 13F | Wells Fargo & Company/mn | 413 531 | 12,04 | 2 870 | 73,35 | ||||
| 2025-07-31 | 13F | City State Bank | 0 | −100,00 | 0 | −100,00 | ||||
| 2025-08-14 | 13F | Van Eck Associates Corp | 18 327 861 | 6,22 | 127 | 64,94 | ||||
| 2025-08-14 | 13F | Ardsley Advisory Partners Lp | 50 000 | 347 | ||||||
| 2025-08-14 | 13F | Investment Management Corp of Ontario | 34 570 | −4,95 | 240 | 46,63 | ||||
| 2025-06-26 | NP | IXUS - iShares Core MSCI Total International Stock ETF | 699 713 | 0,83 | 3 665 | −19,13 | ||||
| 2025-04-23 | 13F | Harbour Capital Advisors, LLC | 0 | −100,00 | 0 | |||||
| 2025-08-28 | NP | SPDW - SPDR(R) Portfolio Developed World ex-US ETF | 416 465 | 2,77 | 2 887 | 58,98 | ||||
| 2025-08-08 | 13F | Geode Capital Management, Llc | 294 658 | 6,01 | 2 057 | 63,51 | ||||
| 2025-08-14 | 13F | Great Valley Advisor Group, Inc. | 11 016 | −7,35 | 76 | 43,40 | ||||
| 2025-07-29 | NP | GIMFX - GMO Implementation Fund | 192 000 | 77,29 | 1 184 | 107,18 | ||||
| 2025-06-24 | NP | TLTD - FlexShares Morningstar Developed Markets ex-US Factor Tilt Index Fund | 10 602 | 0,00 | 55 | −20,29 | ||||
| 2025-05-27 | NP | HRITX - Hood River International Opportunity Fund Retirement Shares | 151 291 | 66,77 | 679 | 13,55 | ||||
| 2025-07-22 | 13F | Kercheville Advisors, LLC | 10 000 | 69 | ||||||
| 2025-08-05 | 13F | Bank of New York Mellon Corp | 1 999 769 | −1,07 | 13 878 | 52,93 | ||||
| 2025-08-14 | 13F | CIBC Asset Management Inc | 656 798 | −19,68 | 4 561 | 24,41 | ||||
| 2025-05-27 | NP | HRNOX - Hood River New Opportunities Fund Institutional Shares | 154 249 | 34,47 | 693 | −8,59 | ||||
| 2025-07-09 | 13F | Dudley & Shanley, Inc. | 1 237 000 | 0,04 | 8 585 | 54,64 | ||||
| 2025-06-30 | NP | VFSNX - Vanguard FTSE All-World ex-US Small-Cap Index Fund Institutional Shares | 1 719 474 | −6,94 | 9 005 | −25,36 | ||||
| 2025-08-12 | 13F | Kimelman & Baird, LLC | 131 | 0,00 | 1 | |||||
| 2025-06-26 | NP | CCSO - Carbon Collective Climate Solutions U.S. Equity ETF | 28 015 | 3,38 | 147 | −17,51 | ||||
| 2025-08-27 | NP | URAN - Themes Uranium & Nuclear ETF | 51 444 | 41,77 | 357 | 120,37 | ||||
| 2025-08-14 | 13F | Arosa Capital Management LP | Call | 1 250 000 | 8 675 | |||||
| 2025-08-06 | 13F | First Horizon Advisors, Inc. | 2 000 | 0,00 | 14 | 62,50 | ||||
| 2025-08-14 | 13F | Atomi Financial Group, Inc. | 10 150 | −0,75 | 70 | 55,56 | ||||
| 2025-08-14 | 13F | Kopernik Global Investors, LLC | 1 760 522 | 12 218 | ||||||
| 2025-08-14 | 13F | Hancock Prospecting Pty Ltd | 5 750 000 | 39 975 | ||||||
| 2025-08-13 | 13F | De Lisle Partners LLP | 1 208 732 | 0,00 | 8 389 | 54,56 | ||||
| 2025-08-13 | 13F | Northwestern Mutual Wealth Management Co | 13 | 0 | ||||||
| 2025-08-14 | 13F | Arosa Capital Management LP | 714 200 | 5,32 | 4 957 | 62,81 | ||||
| 2025-08-13 | 13F | Pictet Asset Management Holding SA | 99 362 | 1,44 | 688 | 56,72 | ||||
| 2025-08-12 | 13F | Fulcrum Asset Management LLP | Put | 0 | −100,00 | 0 | −100,00 | |||
| 2025-07-07 | 13F | Versant Capital Management, Inc | 1 | 0 | ||||||
| 2025-07-21 | 13F | Matauro, Llc | 12 858 | 1,57 | 89 | 58,93 | ||||
| 2025-05-12 | 13F | Fiduciary Family Office, Llc | 0 | −100,00 | 0 | −100,00 | ||||
| 2025-05-12 | 13F | Fiduciary Family Office, Llc | Put | 0 | −100,00 | 0 | −100,00 | |||
| 2025-05-05 | 13F | Archer Investment Corp | 0 | −100,00 | 0 | |||||
| 2025-07-22 | NP | GRHIX - Goehring & Rozencwajg Resources Fund Institutional Class Shares | 778 616 | 0,00 | 4 812 | 16,83 | ||||
| 2025-07-16 | 13F | Eagle Global Advisors Llc | 55 000 | 0,00 | 382 | 54,88 | ||||
| 2025-08-13 | 13F | Bridgewater Associates, LP | 1 289 750 | −47,02 | 8 951 | −18,11 | ||||
| 2025-06-26 | NP | PDAVX - PineBridge Dynamic Asset Allocation Fund Investor Servicing Shares | 0 | −100,00 | 0 | −100,00 | ||||
| 2025-08-28 | NP | NANR - SPDR S&P North American Natural Resources ETF | 80 459 | −8,33 | 558 | 41,73 | ||||
| 2025-08-11 | 13F | HighTower Advisors, LLC | 19 555 | −11,28 | 136 | −12,34 | ||||
| 2025-08-13 | 13F | Capital Research Global Investors | 3 164 318 | 29,80 | 21 960 | 100,64 | ||||
| 2025-08-12 | 13F | Legal & General Group Plc | 674 866 | 8,24 | 4 679 | 67,47 | ||||
| 2025-08-14 | 13F | Moore Capital Management, Lp | 632 651 | −22,21 | 4 393 | 20,39 | ||||
| 2025-08-06 | 13F | MMCAP International Inc. SPC | 2 006 125 | 91,06 | 13 923 | 195,33 | ||||
| 2025-05-14 | 13F | Ameriprise Financial Inc | 0 | −100,00 | 0 | |||||
| 2025-06-18 | NP | RTXAX - Tax-Managed Real Assets Fund Class A | 445 636 | 54,23 | 2 334 | 23,70 | ||||
| 2025-08-27 | NP | VTMGX - Vanguard Developed Markets Index Fund Admiral Shares | 4 731 607 | −0,53 | 32 870 | 54,17 | ||||
| 2025-08-07 | 13F | Allworth Financial LP | 1 629 | 11 | ||||||
| 2025-08-12 | 13F | Picton Mahoney Asset Management | 1 010 456 | 7 | ||||||
| 2025-08-25 | NP | SPROTT FUNDS TRUST - Sprott Junior Uranium Miners ETF | 5 068 284 | 13,34 | 35 174 | 75,19 | ||||
| 2025-08-13 | 13F | Hsbc Holdings Plc | 0 | −100,00 | 0 | |||||
| 2025-08-14 | 13F | Segra Capital Management, LLC | 14 107 844 | 2,69 | 97 908 | 58,72 | ||||
| 2025-08-25 | NP | SETM - Sprott Energy Transition Materials ETF | 171 295 | 10,39 | 1 189 | 70,69 | ||||
| 2025-08-14 | 13F | Sunbelt Securities, Inc. | 400 | 0,00 | 3 | 100,00 | ||||
| 2025-08-12 | 13F | MAI Capital Management | 0 | −100,00 | 0 | |||||
| 2025-05-15 | 13F | Oxbow Capital Management (HK) Ltd | 0 | −100,00 | 0 | |||||
| 2025-08-14 | 13F | Janus Henderson Group Plc | 788 276 | −9,75 | 5 444 | 35,43 | ||||
| 2025-08-14 | 13F | Royal Bank Of Canada | Call | 15 400 | −96,58 | 107 | −94,71 | |||
| 2025-08-14 | 13F | Royal Bank Of Canada | 7 008 199 | 24,87 | 48 637 | 93,00 | ||||
| 2025-08-25 | 13F/A | Neuberger Berman Group LLC | 28 800 | 6,67 | 200 | 64,46 | ||||
| 2025-08-14 | 13F | Evergreen Capital Management Llc | 53 935 | 4,05 | 374 | 61,21 | ||||
| 2025-08-12 | 13F | BlackRock, Inc. | 128 642 | −2,50 | 893 | 50,68 | ||||
| 2025-05-14 | 13F | Caitlin John, LLC | 0 | −100,00 | 0 | |||||
| 2025-08-14 | 13F | Appian Way Asset Management LP | 0 | −100,00 | 0 | −100,00 | ||||
| 2025-08-14 | 13F | BW Gestao de Investimentos Ltda. | 388 200 | 2 694 | ||||||
| 2025-05-27 | NP | PSPFX - Global Resources Fund | 25 000 | 0,00 | 112 | −32,12 | ||||
| 2025-07-17 | 13F | Refined Wealth Management | 11 000 | 0,00 | 76 | 55,10 | ||||
| 2025-08-13 | 13F | Natixis | 86 906 | 6,23 | 599 | 66,39 | ||||
| 2025-05-15 | 13F | CAPROCK Group, Inc. | 70 000 | 0,00 | 314 | −32,03 | ||||
| 2025-08-06 | 13F | Titan Global Capital Management Usa Llc | 520 871 | 27,66 | 3 615 | 97,38 | ||||
| 2025-08-15 | 13F | Morgan Stanley | 1 611 126 | −7,18 | 11 181 | 43,47 | ||||
| 2025-08-14 | 13F | Two Sigma Securities, Llc | 0 | −100,00 | 0 | |||||
| 2025-05-15 | 13F | Mountain Lake Investment Management LLC | 0 | −100,00 | 0 | |||||
| 2025-08-12 | 13F | Pathstone Holdings, LLC | 0 | −100,00 | 0 | −100,00 | ||||
| 2025-06-26 | NP | FTIHX - Fidelity Total International Index Fund This fund is a listed as child fund of Fmr Llc and if that institution has disclosed ownership in this security, then these positions will not be double counted when calculating total shares and total value | 246 283 | 5,33 | 1 290 | −15,53 | ||||
| 2025-08-06 | 13F | Decker Retirement Planning Inc. | 0 | −100,00 | 0 | −100,00 | ||||
| 2025-08-12 | 13F | Rhumbline Advisers | 1 | 0,00 | 0 | |||||
| 2025-07-28 | 13F | Td Asset Management Inc | 3 298 902 | 30,06 | 22 871 | 101,21 | ||||
| 2025-08-12 | 13F | Nuveen, LLC | 406 142 | −12,89 | 2 816 | 34,75 | ||||
| 2025-08-15 | 13F | Caxton Associates Llp | 18 411 | −50,00 | 128 | −23,03 | ||||
| 2025-08-27 | 13F/A | Squarepoint Ops LLC | 138 762 | 0,00 | 963 | 54,57 | ||||
| 2025-07-30 | 13F | Cullen/frost Bankers, Inc. | 0 | −100,00 | 0 | −100,00 | ||||
| 2025-08-14 | 13F | Toroso Investments, LLC | 28 015 | 6,94 | 194 | 65,81 | ||||
| 2025-08-28 | NP | SMSAX - SIMT Multi-Strategy Alternative Fund Class F | 129 471 | 0,00 | 899 | 54,56 | ||||
| 2025-08-12 | 13F | Global Retirement Partners, LLC | 0 | −100,00 | 0 | |||||
| 2025-08-08 | 13F | Cetera Investment Advisers | 128 690 | 1,40 | 893 | 56,94 | ||||
| 2025-08-14 | 13F | Sei Investments Co | 51 611 | −80,73 | 358 | −70,22 | ||||
| 2025-08-13 | 13F | New Harbor Financial Group, LLC | 23 500 | −6,00 | 163 | 45,54 | ||||
| 2025-05-14 | 13F | Hartree Partners, LP | 0 | −100,00 | 0 | −100,00 | ||||
| 2025-08-05 | 13F | VGI Partners Ltd | 45 000 | −84,38 | 312 | −75,87 | ||||
| 2025-08-29 | NP | JOHN HANCOCK INVESTMENT TRUST - John Hancock Diversified Real Assets Fund Class NAV | 308 455 | −1,77 | 2 143 | 52,24 | ||||
| 2025-08-11 | 13F | Waratah Capital Advisors Ltd. | 3 539 978 | −5,93 | 24 567 | 45,39 | ||||
| 2025-08-28 | NP | IGE - iShares North American Natural Resources ETF | 128 638 | −2,50 | 893 | 50,68 | ||||
| 2025-06-27 | NP | URA - Global X Uranium ETF This fund is a listed as child fund of Mirae Asset Global Investments Co., Ltd. and if that institution has disclosed ownership in this security, then these positions will not be double counted when calculating total shares and total value | 28 921 688 | −12,89 | 151 173 | −30,51 | ||||
| 2025-08-14 | 13F | Lloyd Harbor Capital Management, LLC | 2 512 817 | −40,35 | 17 439 | −7,81 | ||||
| 2025-07-25 | NP | SCAVX - AB Small Cap Value Portfolio Class A | 754 110 | 0,00 | 4 660 | 16,82 | ||||
| 2025-07-29 | NP | GOFIX - GMO Resources Fund Class III | 3 688 339 | 61,44 | 22 737 | 88,72 | ||||
| 2025-08-07 | 13F | Campbell & CO Investment Adviser LLC | 54 858 | 91,84 | 381 | 196,88 | ||||
| 2025-08-11 | 13F | Private Advisor Group, LLC | 0 | −100,00 | 0 | −100,00 | ||||
| 2025-08-28 | NP | SSGVX - State Street Global Equity ex-U.S. Index Portfolio State Street Global All Cap Equity ex-U.S. Index Portfolio This fund is a listed as child fund of State Street Corp and if that institution has disclosed ownership in this security, then these positions will not be double counted when calculating total shares and total value | 141 500 | 0,00 | 981 | 54,73 | ||||
| 2025-06-18 | NP | RAZAX - Multi-Asset Growth Strategy Fund Class A | 24 361 | 127 | ||||||
| 2025-08-07 | 13F | Connor, Clark & Lunn Investment Management Ltd. | 1 728 160 | 97,82 | 12 013 | 206,77 | ||||
| 2025-08-12 | 13F | Jpmorgan Chase & Co | 5 007 555 | −8,67 | 34 752 | 41,17 | ||||
| 2025-08-15 | 13F | Raffles Associates Lp | 290 000 | −4,92 | 2 013 | 46,97 | ||||
| 2025-08-13 | 13F | Mackenzie Financial Corp | 250 763 | 7,41 | 1 743 | 66,63 | ||||
| 2025-08-14 | 13F | Altshuler Shaham Ltd | 36 490 | 28,99 | 253 | 99,21 | ||||
| 2025-08-28 | NP | SPGM - SPDR(R) Portfolio MSCI Global Stock Market ETF | 43 643 | 2,96 | 303 | 59,79 | ||||
| 2025-08-13 | 13F | Drummond Knight Asset Management Pty Ltd | 937 511 | 6 506 | ||||||
| 2025-08-14 | 13F | Polar Asset Management Partners Inc. | Call | 0 | −100,00 | 0 | ||||
| 2025-08-14 | 13F | Black Maple Capital Management LP | Call | 0 | −100,00 | 0 | ||||
| 2025-08-14 | 13F | D. E. Shaw & Co., Inc. | 197 002 | 701,37 | 1 367 | 1 142,73 | ||||
| 2025-08-08 | 13F | Keebeck Alpha, LP | 10 505 | 73 | ||||||
| 2025-07-15 | 13F | Public Employees Retirement System Of Ohio | 125 770 | −3,10 | 872 | 50,09 | ||||
| 2025-08-04 | 13F | Canton Hathaway, LLC | 8 200 | 0 | ||||||
| 2025-07-31 | 13F | Ground Swell Capital, LLC | 0 | −100,00 | 0 | −100,00 | ||||
| 2025-08-07 | 13F | PCJ Investment Counsel Ltd. | 746 400 | 131,70 | 5 186 | 259,07 | ||||
| 2025-08-11 | 13F | Alps Advisors Inc | 17 259 319 | 1,25 | 119 780 | 56,50 | ||||
| 2025-08-14 | 13F | Wexford Capital Lp | 28 040 | −28,27 | 195 | 10,86 | ||||
| 2025-08-14 | 13F | Headlands Technologies LLC | 12 165 | −73,49 | 84 | −59,22 | ||||
| 2025-08-14 | 13F | Federation des caisses Desjardins du Quebec | 367 784 | 14,05 | 2 525 | 75,96 | ||||
| 2025-08-11 | 13F | Aptus Capital Advisors, LLC | 12 281 | 0,00 | 85 | 54,55 | ||||
| 2025-08-15 | 13F | Great West Life Assurance Co /can/ | 253 311 | −45,35 | 2 | −50,00 | ||||
| 2025-08-14 | 13F | SIH Partners, LLLP | 0 | −100,00 | 0 | −100,00 | ||||
| 2025-08-14 | 13F | Fmr Llc | 39 | 0,00 | 0 | |||||
| 2025-08-14 | 13F | Man Group plc | 266 594 | 20,60 | 1 850 | 86,49 | ||||
| 2025-08-14 | 13F | Kerrisdale Advisers, LLC | 50 883 | 0,00 | 354 | 54,82 | ||||
| 2025-08-13 | 13F | Walleye Trading LLC | Call | 31 100 | 216 | |||||
| 2025-08-14 | 13F | Wiley Bros.-aintree Capital, Llc | 17 842 | 122 | ||||||
| 2025-08-13 | 13F | Walleye Trading LLC | Put | 13 900 | 96 | |||||
| 2025-07-31 | 13F | Caitong International Asset Management Co., Ltd | 1 716 | 485,67 | 12 | 1 000,00 | ||||
| 2025-08-25 | NP | MMYAX - MassMutual Select Small Company Value Fund Class A | 39 180 | −29,41 | 272 | 8,84 | ||||
| 2025-08-15 | 13F | Sender Co & Partners, Inc. | 25 989 | 180 | ||||||
| 2025-05-14 | 13F | New Harbor Financial Group, LLC | Put | 0 | −100,00 | 0 | −100,00 | |||
| 2025-08-13 | 13F | Walleye Trading LLC | 195 466 | 1 357 | ||||||
| 2025-08-18 | 13F/A | Nomura Holdings Inc | 30 543 | 120,27 | 212 | 240,32 | ||||
| 2025-07-22 | 13F | Sava Infond d.o.o. | 16 000 | 14,29 | 111 | 79,03 | ||||
| 2025-08-14 | 13F | Capstone Investment Advisors, Llc | 80 403 | 558 | ||||||
| 2025-08-21 | NP | NLR - VanEck Vectors Uranium+Nuclear Energy ETF | 10 586 553 | 10,62 | 73 471 | 70,98 | ||||
| 2025-08-05 | 13F | Huntington National Bank | 0 | −100,00 | 0 | −100,00 | ||||
| 2025-08-04 | 13F | Assetmark, Inc | 60 | 0,00 | 0 | |||||
| 2025-06-30 | NP | VGTSX - Vanguard Total International Stock Index Fund Investor Shares | 7 656 282 | 3,20 | 40 097 | −17,23 | ||||
| 2025-05-15 | 13F | Mercer Global Advisors Inc /adv | 0 | −100,00 | 0 | |||||
| 2025-08-14 | 13F | Royal Bank Of Canada | Put | 0 | −100,00 | 0 | −100,00 | |||
| 2025-06-30 | NP | VT - Vanguard Total World Stock Index Fund ETF Shares | 355 632 | 10,03 | 1 863 | −11,75 | ||||
| 2025-08-14 | 13F | Stifel Financial Corp | 84 614 | 587 | ||||||
| 2025-05-15 | 13F | Point72 Asset Management, L.P. | 0 | −100,00 | 0 | |||||
| 2025-08-14 | 13F | Empyrean Capital Partners, LP | 2 051 600 | 14 238 | ||||||
| 2025-05-14 | 13F | State of Wyoming | 0 | −100,00 | 0 | |||||
| 2025-05-27 | NP | VARIABLE INSURANCE PRODUCTS FUND - Stock Selector All Cap Portfolio Investor Class | 0 | −100,00 | 0 | −100,00 | ||||
| 2025-08-12 | 13F | LPL Financial LLC | 178 827 | 98,07 | 1 241 | 206,42 | ||||
| 2025-08-14 | 13F | Prelude Capital Management, Llc | 24 404 | 10,23 | 169 | 70,71 | ||||
| 2025-08-13 | 13F | Cooper Creek Partners Management Llc | 5 978 466 | 41 | ||||||
| 2025-08-14 | 13F | Hrt Financial Lp | 0 | −100,00 | 0 | |||||
| 2025-08-13 | 13F | Amundi | 817 740 | 633 806,98 | 5 544 | |||||
| 2025-08-14 | 13F | UBS Group AG | 1 951 170 | 154,32 | 13 541 | 293,18 | ||||
| 2025-08-14 | 13F | UBS Group AG | Put | 94 000 | 652 | |||||
| 2025-05-27 | NP | Fidelity Central Investment Portfolios LLC - Fidelity U.S. Equity Central Fund This fund is a listed as child fund of Fmr Llc and if that institution has disclosed ownership in this security, then these positions will not be double counted when calculating total shares and total value | 0 | −100,00 | 0 | −100,00 | ||||
| 2025-04-25 | NP | FSUTX - Utilities Portfolio This fund is a listed as child fund of Fmr Llc and if that institution has disclosed ownership in this security, then these positions will not be double counted when calculating total shares and total value | 0 | −100,00 | 0 | −100,00 | ||||
| 2025-08-11 | 13F | Bell Investment Advisors, Inc | 112 | 1 | ||||||
| 2025-08-14 | 13F | SIG North Trading, ULC | Call | 279 600 | 210,32 | 1 940 | 380,20 | |||
| 2025-08-14 | 13F | Manufacturers Life Insurance Company, The | 6 619 233 | −8,33 | 45 673 | 41,33 | ||||
| 2025-07-24 | 13F | Verde Servicos Internacionais S.A. | 125 000 | 1 | ||||||
| 2025-08-27 | NP | BBGSX - Bridge Builder Small/Mid Cap Growth Fund | 2 531 804 | 40,39 | 17 571 | 116,99 | ||||
| 2025-07-30 | 13F | DekaBank Deutsche Girozentrale | 11 651 | 318,35 | 0 | |||||
| 2025-08-25 | NP | Sprott Funds Trust - Sprott Uranium Miners Etf | 12 019 740 | −3,21 | 83 417 | 49,60 | ||||
| 2025-08-14 | 13F | SIG North Trading, ULC | Put | 159 300 | −12,95 | 1 106 | 34,59 | |||
| 2025-07-29 | NP | GCCHX - GMO Climate Change Fund Class III | 1 072 000 | 17,09 | 6 608 | 36,87 | ||||
| 2025-08-14 | 13F | SIG North Trading, ULC | 248 621 | 88,85 | 1 725 | 191,88 |