Grundläggande statistik
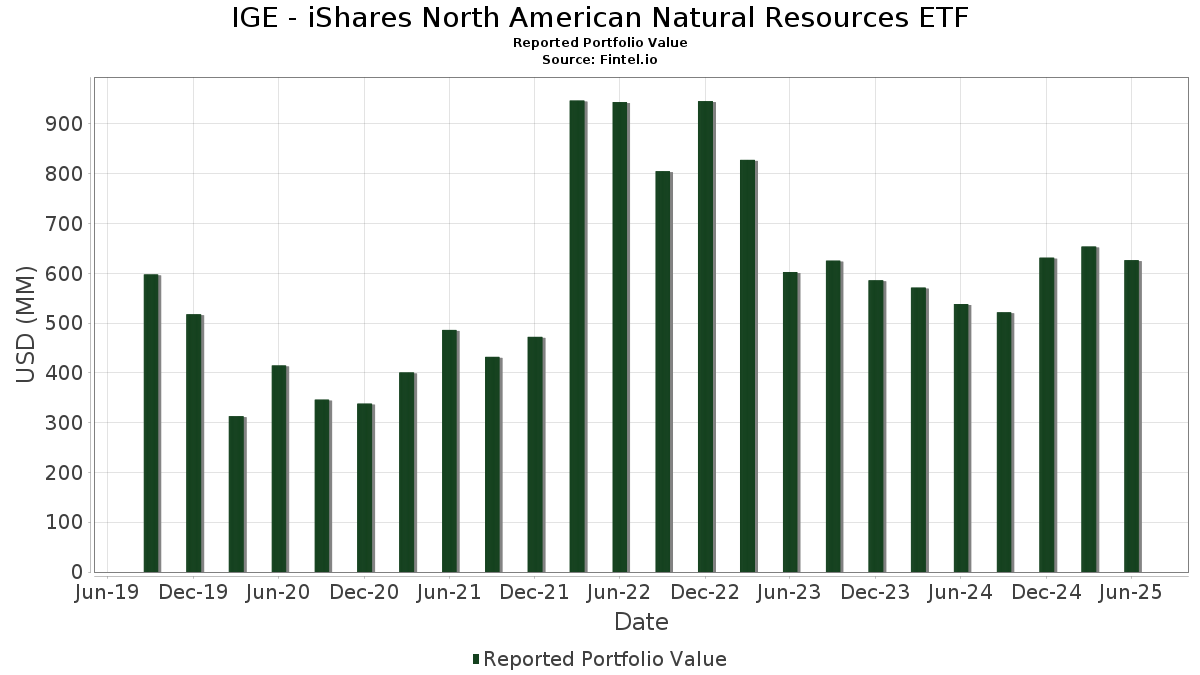
| Portföljvärde | $ 626 248 159 |
| Aktuella positioner | 133 |
Senaste innehav, resultat, förvaltat kapital (från 13F, 13D)
IGE - iShares North American Natural Resources ETF har redovisat 133 totala innehav i sina senaste SEC-arkiveringar. Det senaste portföljvärdet beräknas vara $ 626 248 159 USD. Faktiskt förvaltade tillgångar (AUM) är detta värde plus likvida medel (som inte redovisas). IGE - iShares North American Natural Resources ETFs största innehav är Exxon Mobil Corporation (US:XOM) , Chevron Corporation (US:CVX) , ConocoPhillips (US:COP) , BlackRock Cash Funds: Institutional, SL Agency Shares (US:US0669225197) , and Enbridge Inc. (US:ENB) . IGE - iShares North American Natural Resources ETFs nya positioner inkluderar OR Royalties Inc. (US:OR) , New Gold Inc. (US:NGD) , Sandstorm Gold Ltd. (US:SAND) , Orla Mining Ltd. (US:ORLA) , and Sable Offshore Corp. (US:SOC) .
Största ökningarna detta kvartal
Vi använder förändringen i portföljallokeringen eftersom det är det mest meningsfulla måttet. Förändringar kan bero på transaktioner eller förändringar i aktiekurser.
| Värdepapper | Aktier (MM) |
Värde (MM$) |
Portfölj % av | ΔPortfölj % av |
|---|---|---|---|---|
| 22,76 | 22,77 | 3,7689 | 1,7177 | |
| 0,10 | 7,26 | 1,2021 | 0,5542 | |
| 0,25 | 14,58 | 2,4123 | 0,4224 | |
| 0,32 | 14,00 | 2,3161 | 0,3464 | |
| 0,52 | 4,73 | 0,7836 | 0,2753 | |
| 0,11 | 13,45 | 2,2266 | 0,2527 | |
| 0,10 | 9,16 | 1,5161 | 0,2411 | |
| 0,07 | 11,47 | 1,8984 | 0,2317 | |
| 0,27 | 17,24 | 2,8530 | 0,2158 | |
| 0,49 | 22,21 | 3,6755 | 0,1800 |
Största minskningarna detta kvartal
Vi använder förändringen i portföljallokeringen eftersom det är det mest meningsfulla måttet. Förändringar kan bero på transaktioner eller förändringar i aktiepriser.
| Värdepapper | Aktier (MM) |
Värde (MM$) |
Portfölj % av | ΔPortfölj % av |
|---|---|---|---|---|
| 0,37 | 52,28 | 8,6516 | −1,4424 | |
| 0,31 | 10,33 | 1,7103 | −0,4096 | |
| 0,28 | 25,47 | 4,2145 | −0,4086 | |
| 0,56 | 59,85 | 9,9052 | −0,3930 | |
| 0,14 | 11,46 | 1,8969 | −0,3318 | |
| 0,12 | 14,67 | 2,4286 | −0,1827 | |
| 0,05 | 8,49 | 1,4049 | −0,1777 | |
| 0,06 | 8,63 | 1,4289 | −0,1694 | |
| 0,00 | 4,47 | 0,7404 | −0,1633 | |
| 0,22 | 8,54 | 1,4131 | −0,1623 |
13F- och fond arkiveringar
Denna blankett lämnades in den 2025-08-28 för rapporteringsperioden 2025-06-30. Klicka på länksymbolen för att se hela transaktionshistoriken.
Uppgradera för att låsa upp premiumdata och exportera till Excel![]() .
.
| Värdepapper | Typ | Genomsnittligt aktiepris | Aktier (MM) |
ΔAktier (%) |
ΔAktier (%) |
Värde ($MM) |
Portfölj (%) |
ΔPortfölj (%) |
|
|---|---|---|---|---|---|---|---|---|---|
| XOM / Exxon Mobil Corporation | 0,56 | 0,01 | 59,85 | −9,35 | 9,9052 | −0,3930 | |||
| CVX / Chevron Corporation | 0,37 | −5,63 | 52,28 | −19,22 | 8,6516 | −1,4424 | |||
| COP / ConocoPhillips | 0,28 | 0,54 | 25,47 | −14,09 | 4,2145 | −0,4086 | |||
| US0669225197 / BlackRock Cash Funds: Institutional, SL Agency Shares | 22,76 | 73,19 | 22,77 | 73,18 | 3,7689 | 1,7177 | |||
| ENB / Enbridge Inc. | 0,49 | −3,11 | 22,21 | −0,90 | 3,6755 | 0,1800 | |||
| WMB / The Williams Companies, Inc. | 0,27 | −2,99 | 17,24 | 1,96 | 2,8530 | 0,2158 | |||
| CNQ / Canadian Natural Resources Limited | 0,47 | −3,49 | 14,79 | −1,60 | 2,4469 | 0,1031 | |||
| EOG / EOG Resources, Inc. | 0,12 | −6,02 | 14,67 | −12,35 | 2,4286 | −0,1827 | |||
| NEM / Newmont Corporation | 0,25 | −5,32 | 14,58 | 14,25 | 2,4123 | 0,4224 | |||
| FCX / Freeport-McMoRan Inc. | 0,32 | −3,21 | 14,00 | 10,83 | 2,3161 | 0,3464 | |||
| CRH / CRH plc | 0,15 | −3,76 | 13,93 | 0,43 | 2,3055 | 0,1420 | |||
| AEM / Agnico Eagle Mines Limited | 0,11 | −3,09 | 13,45 | 6,31 | 2,2266 | 0,2527 | |||
| KMI / Kinder Morgan, Inc. | 0,43 | −3,15 | 12,78 | −0,20 | 2,1144 | 0,1177 | |||
| LNG / Cheniere Energy, Inc. | 0,05 | −4,27 | 12,14 | 0,75 | 2,0092 | 0,1297 | |||
| MPC / Marathon Petroleum Corporation | 0,07 | −5,85 | 11,47 | 7,36 | 1,8984 | 0,2317 | |||
| OKE / ONEOK, Inc. | 0,14 | −2,50 | 11,46 | −19,79 | 1,8969 | −0,3318 | |||
| TRP / TC Energy Corporation | 0,23 | −3,10 | 11,40 | 0,13 | 1,8870 | 0,1110 | |||
| PSX / Phillips 66 | 0,09 | −4,46 | 10,93 | −7,69 | 1,8083 | −0,0379 | |||
| SLB / Schlumberger Limited | 0,31 | −5,97 | 10,33 | −23,96 | 1,7103 | −0,4096 | |||
| SU / Suncor Energy Inc. | 0,28 | −4,48 | 10,33 | −7,61 | 1,7103 | −0,0344 | |||
| VLO / Valero Energy Corporation | 0,07 | −4,19 | 9,46 | −2,48 | 1,5662 | 0,0525 | |||
| WPM / Wheaton Precious Metals Corp. | 0,10 | −3,12 | 9,16 | 12,07 | 1,5161 | 0,2411 | |||
| HES / Hess Corporation | 0,06 | −2,86 | 8,63 | −15,74 | 1,4289 | −0,1694 | |||
| BKR / Baker Hughes Company | 0,22 | −3,09 | 8,54 | −15,47 | 1,4131 | −0,1623 | |||
| TRGP / Targa Resources Corp. | 0,05 | −3,66 | 8,49 | −16,34 | 1,4049 | −0,1777 | |||
| B / Barrick Mining Corporation | 0,39 | −3,58 | 8,05 | 3,26 | 1,3318 | 0,1163 | |||
| EQT / EQT Corporation | 0,13 | −2,84 | 7,85 | 6,05 | 1,2988 | 0,1446 | |||
| VMC / Vulcan Materials Company | 0,03 | −3,12 | 7,75 | 8,31 | 1,2818 | 0,1664 | |||
| MLM / Martin Marietta Materials, Inc. | 0,01 | −4,48 | 7,44 | 9,67 | 1,2311 | 0,1732 | |||
| CCJ / Cameco Corporation | 0,10 | −3,04 | 7,26 | 74,84 | 1,2021 | 0,5542 | |||
| FNV / Franco-Nevada Corporation | 0,04 | −3,15 | 7,10 | 0,77 | 1,1742 | 0,0759 | |||
| OXY / Occidental Petroleum Corporation | 0,16 | 1,57 | 6,69 | −13,55 | 1,1074 | −0,0999 | |||
| FANG / Diamondback Energy, Inc. | 0,04 | −3,11 | 5,77 | −16,73 | 0,9556 | −0,1261 | |||
| EXE / Expand Energy Corporation | 0,05 | −0,28 | 5,69 | 4,75 | 0,9421 | 0,0945 | |||
| IP / International Paper Company | 0,12 | −3,01 | 5,56 | −14,87 | 0,9200 | −0,0984 | |||
| PBA / Pembina Pipeline Corporation | 0,13 | −3,00 | 4,90 | −9,11 | 0,8105 | −0,0299 | |||
| Smurfit WestRock plc / EC (IE00028FXN24) | 0,11 | −2,85 | 4,81 | −6,96 | 0,7962 | −0,0104 | |||
| AMCR / Amcor plc | 0,52 | 53,35 | 4,73 | 45,30 | 0,7836 | 0,2753 | |||
| DVN / Devon Energy Corporation | 0,14 | −5,31 | 4,59 | −19,47 | 0,7600 | −0,1294 | |||
| TPL / Texas Pacific Land Corporation | 0,00 | −3,16 | 4,47 | −22,80 | 0,7404 | −0,1633 | |||
| CTRA / Coterra Energy Inc. | 0,17 | 0,37 | 4,36 | −11,86 | 0,7209 | −0,0499 | |||
| KGC / Kinross Gold Corporation | 0,28 | −3,11 | 4,32 | 20,10 | 0,7150 | 0,1539 | |||
| TECK / Teck Resources Limited | 0,10 | −4,62 | 4,01 | 5,70 | 0,6633 | 0,0720 | |||
| HAL / Halliburton Company | 0,19 | −4,06 | 3,94 | −22,93 | 0,6521 | −0,1453 | |||
| CVE / Cenovus Energy Inc. | 0,29 | −3,08 | 3,90 | −5,22 | 0,6458 | 0,0035 | |||
| PKG / Packaging Corporation of America | 0,02 | −3,02 | 3,79 | −7,71 | 0,6264 | −0,0132 | |||
| BALL / Ball Corporation | 0,06 | −10,01 | 3,50 | −3,05 | 0,5793 | 0,0161 | |||
| FTI / TechnipFMC plc | 0,09 | −4,43 | 3,24 | 3,88 | 0,5366 | 0,0497 | |||
| AVY / Avery Dennison Corporation | 0,02 | −6,00 | 3,08 | −7,31 | 0,5098 | −0,0086 | |||
| CCK / Crown Holdings, Inc. | 0,03 | −5,05 | 2,66 | 9,56 | 0,4403 | 0,0615 | |||
| AR / Antero Resources Corporation | 0,07 | −3,22 | 2,65 | −3,57 | 0,4379 | 0,0098 | |||
| RGLD / Royal Gold, Inc. | 0,01 | −3,13 | 2,63 | 5,37 | 0,4353 | 0,0459 | |||
| AGI / Alamos Gold Inc. | 0,09 | −3,11 | 2,51 | −3,79 | 0,4156 | 0,0086 | |||
| DTM / DT Midstream, Inc. | 0,02 | −2,76 | 2,51 | 10,77 | 0,4155 | 0,0620 | |||
| ATR / AptarGroup, Inc. | 0,01 | −4,08 | 2,32 | 1,13 | 0,3839 | 0,0261 | |||
| PAAS / Pan American Silver Corp. | 0,08 | −3,10 | 2,31 | 6,54 | 0,3828 | 0,0442 | |||
| OVV / Ovintiv Inc. | 0,06 | −3,18 | 2,23 | −13,96 | 0,3684 | −0,0350 | |||
| RRC / Range Resources Corporation | 0,05 | −3,97 | 2,19 | −2,19 | 0,3622 | 0,0132 | |||
| PR / Permian Resources Corporation | 0,14 | −3,74 | 1,95 | −5,34 | 0,3228 | 0,0014 | |||
| AA / Alcoa Corporation | 0,06 | −2,83 | 1,72 | −5,96 | 0,2847 | −0,0007 | |||
| EXP / Eagle Materials Inc. | 0,01 | −3,37 | 1,51 | −12,04 | 0,2504 | −0,0178 | |||
| APA / APA Corporation | 0,08 | −5,74 | 1,48 | −17,94 | 0,2453 | −0,0366 | |||
| DINO / HF Sinclair Corporation | 0,04 | −3,36 | 1,48 | 20,77 | 0,2445 | 0,0536 | |||
| GPK / Graphic Packaging Holding Company | 0,07 | −2,78 | 1,43 | −21,10 | 0,2364 | −0,0459 | |||
| AM / Antero Midstream Corporation | 0,08 | −3,42 | 1,43 | 1,64 | 0,2363 | 0,0173 | |||
| CDE / Coeur Mining, Inc. | 0,14 | −3,32 | 1,27 | 44,71 | 0,2106 | 0,0734 | |||
| CHRD / Chord Energy Corporation | 0,01 | −8,74 | 1,26 | −21,55 | 0,2079 | −0,0420 | |||
| MTDR / Matador Resources Company | 0,03 | −2,85 | 1,25 | −9,22 | 0,2071 | −0,0080 | |||
| SOBO / South Bow Corporation | 0,05 | −3,19 | 1,21 | −1,70 | 0,2005 | 0,0083 | |||
| LPX / Louisiana-Pacific Corporation | 0,01 | −4,36 | 1,20 | −10,62 | 0,1979 | −0,0107 | |||
| VNOM / Viper Energy, Inc. | 0,03 | −3,01 | 1,13 | −18,12 | 0,1863 | −0,0281 | |||
| CNX / CNX Resources Corporation | 0,03 | −5,95 | 1,09 | 0,64 | 0,1811 | 0,0115 | |||
| OR / OR Royalties Inc. | 0,04 | 1,08 | 0,1793 | 0,1793 | |||||
| BTG / B2Gold Corp. | 0,30 | −3,17 | 1,07 | 22,73 | 0,1770 | 0,0410 | |||
| CHX / ChampionX Corporation | 0,04 | −3,19 | 1,07 | −19,32 | 0,1764 | −0,0296 | |||
| NOV / NOV Inc. | 0,08 | −4,89 | 1,05 | −22,37 | 0,1736 | −0,0370 | |||
| KNF / Knife River Corporation | 0,01 | −3,37 | 1,04 | −12,54 | 0,1720 | −0,0134 | |||
| SEE / Sealed Air Corporation | 0,03 | 13,45 | 1,03 | 21,80 | 0,1703 | 0,0385 | |||
| SLGN / Silgan Holdings Inc. | 0,02 | −3,19 | 0,99 | 2,58 | 0,1644 | 0,0134 | |||
| AROC / Archrock, Inc. | 0,04 | −2,57 | 0,99 | −7,86 | 0,1631 | −0,0036 | |||
| SON / Sonoco Products Company | 0,02 | −3,16 | 0,97 | −10,72 | 0,1600 | −0,0089 | |||
| IAG / IAMGOLD Corporation | 0,13 | −2,63 | 0,95 | 14,46 | 0,1573 | 0,0278 | |||
| MGY / Magnolia Oil & Gas Corporation | 0,04 | −5,64 | 0,94 | −16,03 | 0,1562 | −0,0191 | |||
| HBM / Hudbay Minerals Inc. | 0,09 | −3,18 | 0,94 | 35,40 | 0,1557 | 0,0473 | |||
| WFG / West Fraser Timber Co. Ltd. | 0,01 | −3,96 | 0,94 | −8,57 | 0,1555 | −0,0047 | |||
| EGO / Eldorado Gold Corporation | 0,05 | −3,28 | 0,94 | 16,98 | 0,1551 | 0,0301 | |||
| EQX / Equinox Gold Corp. | 0,16 | 65,14 | 0,94 | 38,11 | 0,1548 | 0,0491 | |||
| MP / MP Materials Corp. | 0,03 | −3,33 | 0,91 | 31,69 | 0,1501 | 0,0427 | |||
| NXE / NexGen Energy Ltd. | 0,13 | −2,50 | 0,89 | 50,68 | 0,1477 | 0,0553 | |||
| NGD / New Gold Inc. | 0,18 | 0,88 | 0,1456 | 0,1456 | |||||
| HL / Hecla Mining Company | 0,14 | −3,12 | 0,85 | 4,42 | 0,1407 | 0,0137 | |||
| WFRD / Weatherford International plc | 0,02 | −3,15 | 0,82 | −8,95 | 0,1364 | −0,0049 | |||
| AG / First Majestic Silver Corp. | 0,10 | −2,40 | 0,79 | 20,76 | 0,1310 | 0,0287 | |||
| CNR / Core Natural Resources, Inc. | 0,01 | −5,04 | 0,78 | −14,14 | 0,1297 | −0,0126 | |||
| NE / Noble Corporation plc | 0,03 | −4,58 | 0,78 | 6,89 | 0,1285 | 0,0152 | |||
| CRC / California Resources Corporation | 0,02 | −6,11 | 0,71 | −2,46 | 0,1181 | 0,0040 | |||
| MUR / Murphy Oil Corporation | 0,03 | −5,51 | 0,68 | −25,19 | 0,1122 | −0,0290 | |||
| WHD / Cactus, Inc. | 0,02 | −1,16 | 0,67 | −5,62 | 0,1112 | 0,0000 | |||
| UEC / Uranium Energy Corp. | 0,10 | −1,85 | 0,65 | 39,74 | 0,1083 | 0,0352 | |||
| SM / SM Energy Company | 0,03 | −3,10 | 0,63 | −20,05 | 0,1050 | −0,0188 | |||
| NOG / Northern Oil and Gas, Inc. | 0,02 | −4,48 | 0,63 | −10,46 | 0,1035 | −0,0054 | |||
| VAL / Valaris Limited | 0,01 | −3,19 | 0,62 | 3,85 | 0,1027 | 0,0095 | |||
| CRK / Comstock Resources, Inc. | 0,02 | −3,20 | 0,56 | 31,78 | 0,0934 | 0,0265 | |||
| GPOR / Gulfport Energy Corporation | 0,00 | −3,12 | 0,56 | 5,84 | 0,0931 | 0,0102 | |||
| CIVI / Civitas Resources, Inc. | 0,02 | −7,38 | 0,53 | −26,94 | 0,0871 | −0,0253 | |||
| SAND / Sandstorm Gold Ltd. | 0,05 | 0,51 | 0,0850 | 0,0850 | |||||
| OI / O-I Glass, Inc. | 0,03 | −4,44 | 0,51 | 22,89 | 0,0845 | 0,0197 | |||
| PBF / PBF Energy Inc. | 0,02 | −3,20 | 0,48 | 9,91 | 0,0790 | 0,0112 | |||
| OII / Oceaneering International, Inc. | 0,02 | −3,18 | 0,47 | −8,01 | 0,0780 | −0,0019 | |||
| TDW / Tidewater Inc. | 0,01 | −8,69 | 0,47 | −0,42 | 0,0780 | 0,0042 | |||
| ORLA / Orla Mining Ltd. | 0,05 | 0,47 | 0,0780 | 0,0780 | |||||
| PTEN / Patterson-UTI Energy, Inc. | 0,08 | −3,10 | 0,47 | −30,15 | 0,0775 | −0,0270 | |||
| US0669224778 / BlackRock Cash Funds: Treasury, SL Agency Shares | 0,46 | −19,25 | 0,46 | −19,26 | 0,0764 | −0,0128 | |||
| RIG / Transocean Ltd. | 0,18 | −3,19 | 0,45 | −20,91 | 0,0752 | −0,0144 | |||
| LBRT / Liberty Energy Inc. | 0,04 | −3,14 | 0,42 | −29,80 | 0,0691 | −0,0236 | |||
| GEF / Greif, Inc. | 0,01 | −3,32 | 0,38 | 14,33 | 0,0635 | 0,0111 | |||
| SLVM / Sylvamo Corporation | 0,01 | −3,24 | 0,38 | −27,74 | 0,0634 | −0,0193 | |||
| KNTK / Kinetik Holdings Inc. | 0,01 | −1,45 | 0,38 | −16,30 | 0,0629 | −0,0080 | |||
| BTU / Peabody Energy Corporation | 0,03 | −3,19 | 0,37 | −3,93 | 0,0608 | 0,0010 | |||
| WKC / World Kinect Corporation | 0,01 | −5,85 | 0,36 | −6,01 | 0,0597 | −0,0001 | |||
| SOC / Sable Offshore Corp. | 0,02 | 0,36 | 0,0593 | 0,0593 | |||||
| CRGY / Crescent Energy Company | 0,04 | −3,13 | 0,35 | −25,84 | 0,0585 | −0,0159 | |||
| HP / Helmerich & Payne, Inc. | 0,02 | −3,18 | 0,34 | −43,89 | 0,0564 | −0,0382 | |||
| INSW / International Seaways, Inc. | 0,01 | −3,17 | 0,33 | 6,43 | 0,0548 | 0,0063 | |||
| TFPM / Triple Flag Precious Metals Corp. | 0,01 | −3,20 | 0,32 | 19,70 | 0,0533 | 0,0114 | |||
| KGS / Kodiak Gas Services, Inc. | 0,01 | −3,22 | 0,31 | −11,05 | 0,0507 | −0,0030 | |||
| NG / NovaGold Resources Inc. | 0,07 | 20,10 | 0,28 | 69,09 | 0,0462 | 0,0203 | |||
| BTE / Baytex Energy Corp. | 0,15 | −5,13 | 0,27 | −24,08 | 0,0445 | −0,0106 | |||
| USLM / United States Lime & Minerals, Inc. | 0,00 | −3,31 | 0,24 | 8,80 | 0,0390 | 0,0053 | |||
| AESI / Atlas Energy Solutions Inc. | 0,02 | −0,55 | 0,22 | −25,59 | 0,0367 | −0,0097 | |||
| CVI / CVR Energy, Inc. | 0,01 | −3,19 | 0,21 | 33,99 | 0,0340 | 0,0101 | |||
| Xab Materials Equity Index / DE (N/A) | 0,00 | 0,0000 | 0,0000 | ||||||
| VRN / Veren Inc. | 0,00 | −100,00 | 0,00 | −100,00 | −0,1468 | ||||
| XAE Energy Index / DE (N/A) | −0,03 | −0,0051 | −0,0051 |