Grundläggande statistik
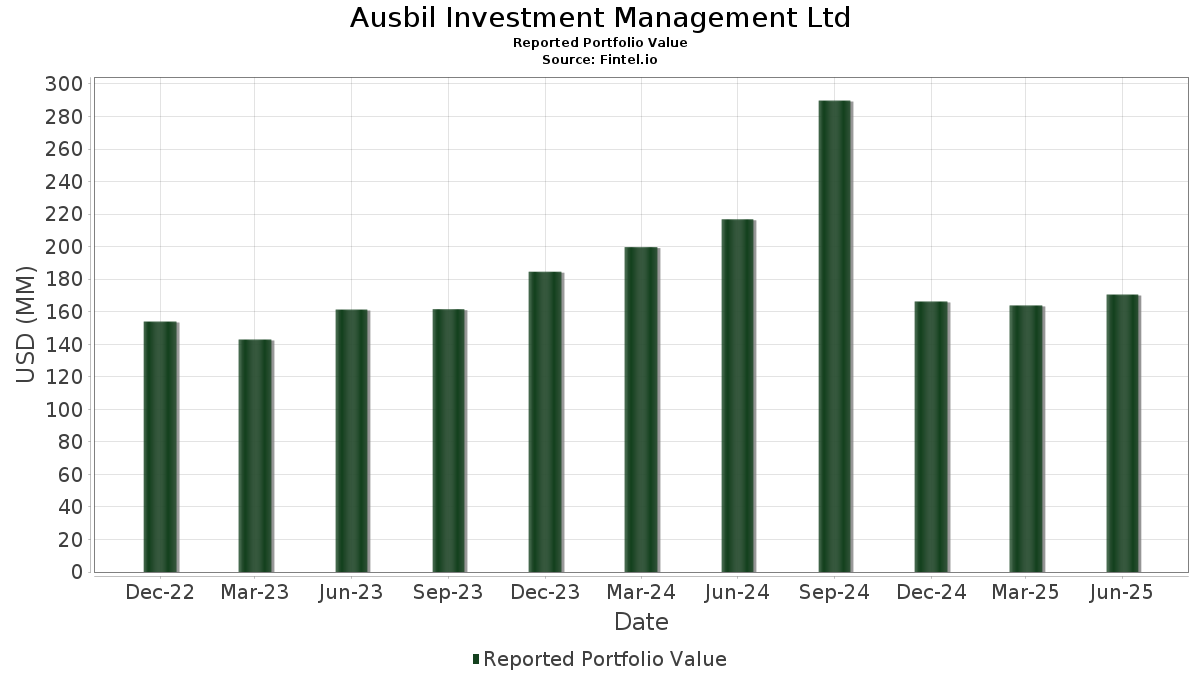
| Portföljvärde | $ 170 562 572 |
| Aktuella positioner | 71 |
Senaste innehav, resultat, förvaltat kapital (från 13F, 13D)
Ausbil Investment Management Ltd har redovisat 71 totala innehav i sina senaste SEC-arkiveringar. Det senaste portföljvärdet beräknas vara $ 170 562 572 USD. Faktiskt förvaltade tillgångar (AUM) är detta värde plus likvida medel (som inte redovisas). Ausbil Investment Management Ltds största innehav är Norfolk Southern Corporation (US:NSC) , Cheniere Energy, Inc. (US:LNG) , CSX Corporation (US:CSX) , Exelon Corporation (US:EXC) , and Ferrovial SE (US:FER) . Ausbil Investment Management Ltds nya positioner inkluderar Eversource Energy (US:ES) , Duke Energy Corporation (US:DUK) , Constellation Energy Corporation (US:CEG) , Canadian National Railway Company (US:CNI) , and ONE Gas, Inc. (US:OGS) .
Största ökningarna detta kvartal
Vi använder förändringen i portföljallokeringen eftersom det är det mest meningsfulla måttet. Förändringar kan bero på transaktioner eller förändringar i aktiekurser.
| Värdepapper | Aktier (MM) |
Värde (MM$) |
Portfölj % av | ΔPortfölj % av |
|---|---|---|---|---|
| 0,10 | 6,06 | 3,5526 | 3,5526 | |
| 0,04 | 5,21 | 3,0572 | 3,0572 | |
| 0,02 | 5,19 | 3,0444 | 3,0444 | |
| 0,04 | 3,81 | 2,2333 | 2,2333 | |
| 0,03 | 8,64 | 5,0671 | 2,1850 | |
| 0,02 | 3,64 | 2,1318 | 2,1318 | |
| 0,05 | 3,61 | 2,1194 | 2,1194 | |
| 0,22 | 7,26 | 4,2572 | 1,5588 | |
| 0,18 | 1,94 | 1,1384 | 1,1384 | |
| 0,03 | 7,65 | 4,4827 | 0,6392 |
Största minskningarna detta kvartal
Vi använder förändringen i portföljallokeringen eftersom det är det mest meningsfulla måttet. Förändringar kan bero på transaktioner eller förändringar i aktiepriser.
| Värdepapper | Aktier (MM) |
Värde (MM$) |
Portfölj % av | ΔPortfölj % av |
|---|---|---|---|---|
| 0,02 | 1,22 | 0,7178 | −5,4248 | |
| 0,13 | 5,37 | 3,1486 | −1,3400 | |
| 0,06 | 5,19 | 3,0442 | −1,2363 | |
| 0,16 | 6,95 | 4,0758 | −1,1771 | |
| 0,06 | 5,44 | 3,1868 | −1,1456 | |
| 0,29 | 3,99 | 2,3375 | −0,6594 | |
| 0,02 | 4,57 | 2,6818 | −0,6035 | |
| 0,01 | 1,93 | 1,1305 | −0,4898 | |
| 0,08 | 1,47 | 0,8594 | −0,4346 | |
| 0,00 | 0,25 | 0,1465 | −0,3560 |
13F- och fond arkiveringar
Denna blankett lämnades in den 2025-07-17 för rapporteringsperioden 2025-06-30. Klicka på länksymbolen för att se hela transaktionshistoriken.
Uppgradera för att låsa upp premiumdata och exportera till Excel![]() .
.
| Värdepapper | Typ | Genomsnittligt aktiepris | Aktier (MM) |
ΔAktier (%) |
ΔAktier (%) |
Värde ($MM) |
Portfölj (%) |
ΔPortfölj (%) |
|
|---|---|---|---|---|---|---|---|---|---|
| NSC / Norfolk Southern Corporation | 0,03 | 69,34 | 8,64 | 83,02 | 5,0671 | 2,1850 | |||
| LNG / Cheniere Energy, Inc. | 0,03 | 15,36 | 7,65 | 21,41 | 4,4827 | 0,6392 | |||
| CSX / CSX Corporation | 0,22 | 48,12 | 7,26 | 64,24 | 4,2572 | 1,5588 | |||
| EXC / Exelon Corporation | 0,16 | −14,28 | 6,95 | −19,24 | 4,0758 | −1,1771 | |||
| FER / Ferrovial SE | 0,12 | 0,54 | 6,15 | 20,07 | 3,6068 | 0,4802 | |||
| ES / Eversource Energy | 0,10 | 6,06 | 3,5526 | 3,5526 | |||||
| WMB / The Williams Companies, Inc. | 0,09 | 0,00 | 5,73 | 5,10 | 3,3622 | 0,0323 | |||
| NEE / NextEra Energy, Inc. | 0,08 | 0,00 | 5,64 | −2,07 | 3,3087 | −0,2084 | |||
| ENB / Enbridge Inc. | 0,12 | 0,00 | 5,45 | 2,27 | 3,1926 | −0,0571 | |||
| PEG / Public Service Enterprise Group Incorporated | 0,06 | −25,14 | 5,44 | −23,43 | 3,1868 | −1,1456 | |||
| NI / NiSource Inc. | 0,13 | −27,43 | 5,37 | −26,98 | 3,1486 | −1,3400 | |||
| DUK / Duke Energy Corporation | 0,04 | 5,21 | 3,0572 | 3,0572 | |||||
| CEG / Constellation Energy Corporation | 0,02 | 5,19 | 3,0444 | 3,0444 | |||||
| ETR / Entergy Corporation | 0,06 | −23,86 | 5,19 | −25,97 | 3,0442 | −1,2363 | |||
| AEE / Ameren Corporation | 0,05 | 0,00 | 5,16 | −4,34 | 3,0249 | −0,2668 | |||
| AMT / American Tower Corporation | 0,02 | −16,34 | 4,57 | −15,03 | 2,6818 | −0,6035 | |||
| PPL / PPL Corporation | 0,13 | 0,00 | 4,26 | −6,15 | 2,4972 | −0,2725 | |||
| PCG / PG&E Corporation | 0,29 | 0,06 | 3,99 | −18,82 | 2,3375 | −0,6594 | |||
| CNI / Canadian National Railway Company | 0,04 | 3,81 | 2,2333 | 2,2333 | |||||
| ATO / Atmos Energy Corporation | 0,02 | 0,00 | 3,70 | −0,30 | 2,1681 | −0,0956 | |||
| MLI / Mueller Industries, Inc. | 0,05 | 16,35 | 3,68 | 21,42 | 2,1605 | 0,3086 | |||
| TRP / TC Energy Corporation | 0,08 | 1,22 | 3,68 | 4,46 | 2,1565 | 0,0072 | |||
| SBAC / SBA Communications Corporation | 0,02 | 3,64 | 2,1318 | 2,1318 | |||||
| POWL / Powell Industries, Inc. | 0,02 | 6,58 | 3,63 | 31,71 | 2,1284 | 0,4460 | |||
| OGS / ONE Gas, Inc. | 0,05 | 3,61 | 2,1194 | 2,1194 | |||||
| SOBO / South Bow Corporation | 0,13 | 0,00 | 3,30 | 1,45 | 1,9344 | −0,0507 | |||
| AIT / Applied Industrial Technologies, Inc. | 0,01 | 0,84 | 2,80 | 4,01 | 1,6445 | −0,0012 | |||
| CCI / Crown Castle Inc. | 0,02 | −3,60 | 2,52 | −5,02 | 1,4756 | −0,1410 | |||
| ATKR / Atkore Inc. | 0,03 | 1,06 | 2,31 | 18,82 | 1,3554 | 0,1683 | |||
| AES / The AES Corporation | 0,18 | 1,94 | 1,1384 | 1,1384 | |||||
| EGP / EastGroup Properties, Inc. | 0,01 | −23,45 | 1,93 | −27,35 | 1,1305 | −0,4898 | |||
| SFM / Sprouts Farmers Market, Inc. | 0,01 | 11,38 | 1,77 | 20,20 | 1,0395 | 0,1388 | |||
| RLI / RLI Corp. | 0,02 | 96,30 | 1,54 | 76,67 | 0,9012 | 0,3696 | |||
| ADMA / ADMA Biologics, Inc. | 0,08 | −24,68 | 1,47 | −30,90 | 0,8594 | −0,4346 | |||
| PRI / Primerica, Inc. | 0,01 | 0,00 | 1,46 | −3,83 | 0,8550 | −0,0703 | |||
| CHE / Chemed Corporation | 0,00 | 345,47 | 1,34 | 252,63 | 0,7859 | 0,5539 | |||
| SLGN / Silgan Holdings Inc. | 0,02 | 14,76 | 1,22 | −87,84 | 0,7178 | −5,4248 | |||
| SIGI / Selective Insurance Group, Inc. | 0,01 | 88,88 | 1,22 | 78,85 | 0,7145 | 0,2985 | |||
| CLS / Celestica Inc. | 0,01 | −17,51 | 1,16 | 63,43 | 0,6816 | 0,2474 | |||
| MTZ / MasTec, Inc. | 0,01 | 23,83 | 1,11 | 80,88 | 0,6491 | 0,2754 | |||
| PLPC / Preformed Line Products Company | 0,01 | 1,63 | 1,07 | 16,00 | 0,6293 | 0,0643 | |||
| FCX / Freeport-McMoRan Inc. | 0,02 | 15,61 | 0,87 | 32,57 | 0,5083 | 0,1086 | |||
| MEDP / Medpace Holdings, Inc. | 0,00 | 33,67 | 0,83 | 37,83 | 0,4851 | 0,1184 | |||
| CCJ / Cameco Corporation | 0,01 | 37,50 | 0,82 | 147,72 | 0,4780 | 0,2770 | |||
| LTC / LTC Properties, Inc. | 0,02 | 131,84 | 0,78 | 126,96 | 0,4591 | 0,2480 | |||
| NXE / NexGen Energy Ltd. | 0,11 | 72,58 | 0,74 | 166,91 | 0,4354 | 0,2655 | |||
| EXP / Eagle Materials Inc. | 0,00 | 18,54 | 0,71 | 7,95 | 0,4145 | 0,0148 | |||
| IESC / IES Holdings, Inc. | 0,00 | 0,71 | 0,4144 | 0,4144 | |||||
| HBM / Hudbay Minerals Inc. | 0,06 | 71,43 | 0,64 | 139,62 | 0,3725 | 0,2106 | |||
| GNRC / Generac Holdings Inc. | 0,00 | 0,57 | 0,3326 | 0,3326 | |||||
| BLD / TopBuild Corp. | 0,00 | 92,87 | 0,55 | 104,83 | 0,3232 | 0,1589 | |||
| EXE / Expand Energy Corporation | 0,00 | 200,00 | 0,53 | 216,87 | 0,3085 | 0,2066 | |||
| MTH / Meritage Homes Corporation | 0,01 | 0,49 | 0,2855 | 0,2855 | |||||
| AA / Alcoa Corporation | 0,01 | 650,00 | 0,44 | 624,59 | 0,2595 | 0,2223 | |||
| KNF / Knife River Corporation | 0,00 | 36,58 | 0,39 | 23,73 | 0,2295 | 0,0362 | |||
| ACLS / Axcelis Technologies, Inc. | 0,01 | 0,38 | 0,2200 | 0,2200 | |||||
| NHI / National Health Investors, Inc. | 0,01 | 0,36 | 0,2089 | 0,2089 | |||||
| CBU / Community Financial System, Inc. | 0,01 | 0,00 | 0,32 | 0,00 | 0,1904 | −0,0078 | |||
| CIEN / Ciena Corporation | 0,00 | −60,11 | 0,31 | −46,23 | 0,1841 | −0,1729 | |||
| UFPI / UFP Industries, Inc. | 0,00 | 122,45 | 0,27 | 106,11 | 0,1587 | 0,0787 | |||
| FN / Fabrinet | 0,00 | −79,66 | 0,25 | −69,74 | 0,1465 | −0,3560 | |||
| EVR / Evercore Inc. | 0,00 | 0,00 | 0,22 | 35,37 | 0,1304 | 0,0300 | |||
| PRIM / Primoris Services Corporation | 0,00 | 0,00 | 0,20 | 36,24 | 0,1191 | 0,0278 | |||
| STRL / Sterling Infrastructure, Inc. | 0,00 | −70,90 | 0,19 | −40,88 | 0,1107 | −0,0836 | |||
| FORM / FormFactor, Inc. | 0,01 | 0,18 | 0,1078 | 0,1078 | |||||
| LMAT / LeMaitre Vascular, Inc. | 0,00 | 0,00 | 0,18 | −0,55 | 0,1068 | −0,0055 | |||
| PNFP / Pinnacle Financial Partners, Inc. | 0,00 | 0,00 | 0,18 | 4,17 | 0,1027 | 0,0000 | |||
| PBH / Prestige Consumer Healthcare Inc. | 0,00 | 0,17 | 0,1013 | 0,1013 | |||||
| MOD / Modine Manufacturing Company | 0,00 | 0,17 | 0,0989 | 0,0989 | |||||
| COLB / Columbia Banking System, Inc. | 0,01 | 0,00 | 0,16 | −6,59 | 0,0919 | −0,0101 | |||
| RGEN / Repligen Corporation | 0,00 | 0,00 | 0,13 | −2,96 | 0,0774 | −0,0050 | |||
| UEC / Uranium Energy Corp. | 0,00 | −100,00 | 0,00 | 0,0000 | |||||
| TRGP / Targa Resources Corp. | 0,00 | −100,00 | 0,00 | 0,0000 | |||||
| TXNM / TXNM Energy, Inc. | 0,00 | −100,00 | 0,00 | 0,0000 | |||||
| EME / EMCOR Group, Inc. | 0,00 | −100,00 | 0,00 | 0,0000 | |||||
| EIX / Edison International | 0,00 | −100,00 | 0,00 | 0,0000 | |||||
| OXY / Occidental Petroleum Corporation | 0,00 | −100,00 | 0,00 | 0,0000 | |||||
| DTM / DT Midstream, Inc. | 0,00 | −100,00 | 0,00 | 0,0000 | |||||
| LXU / LSB Industries, Inc. | 0,00 | −100,00 | 0,00 | 0,0000 | |||||
| MEOH / Methanex Corporation | 0,00 | −100,00 | 0,00 | 0,0000 | |||||
| X / United States Steel Corporation | 0,00 | −100,00 | 0,00 | 0,0000 |