Grundläggande statistik
| Institutionella ägare | 300 total, 300 long only, 0 short only, 0 long/short - change of 0,00% MRQ |
| Genomsnittlig portföljallokering | 0.1044 % - change of −10,26% MRQ |
| Institutionella aktier (lång) | 59 634 014 (ex 13D/G) - change of −2,65MM shares −4,25% MRQ |
| Institutionellt värde (lång) | $ 425 991 USD ($1000) |
Institutionellt ägande och aktieägare
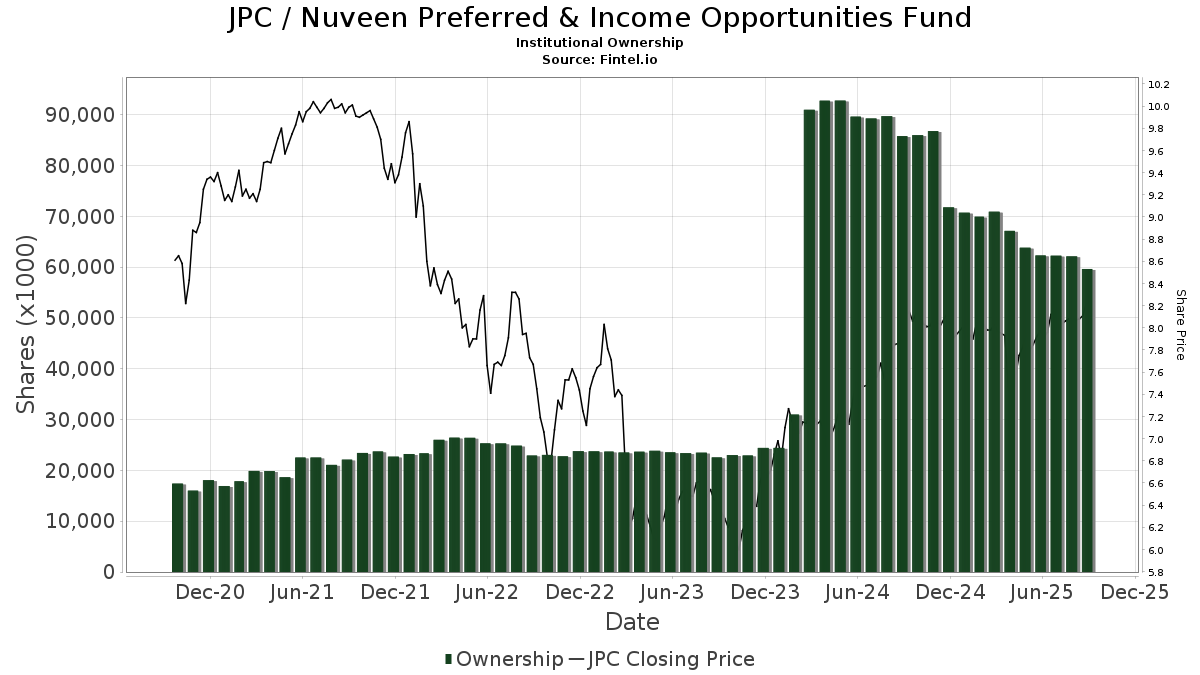
Nuveen Preferred & Income Opportunities Fund (US:JPC) har 300 Institutionella ägare och aktieägare som har lämnat in 13D/G- eller 13F-formulär till Securities Exchange Commission (SEC). Dessa institut innehar totalt 59,634,014 aktier. Största aktieägare inkluderar Morgan Stanley, Bank Of America Corp /de/, UBS Group AG, Wells Fargo & Company/mn, Raymond James Financial Inc, Invesco Ltd., PCEF - Invesco CEF Income Composite ETF, Commonwealth Equity Services, Llc, LPL Financial LLC, and Guggenheim Capital Llc .
Nuveen Preferred & Income Opportunities Fund (NYSE:JPC) Institutionell ägarstruktur visar institutioners och fonders nuvarande positioner i företaget, samt de senaste förändringarna i positionernas storlek. Större aktieägare kan vara enskilda investerare, fonder, hedgefonder eller institutioner. Bilaga 13D visar att investeraren äger (eller ägde) mer än 5% av företaget och avser (eller avsåg) att aktivt eftersträva en förändring av affärsstrategin. Schedule 13G indikerar en passiv investering på över 5%.
The share price as of September 16, 2025 is 8,27 / share. Previously, on September 17, 2024, the share price was 8,02 / share. This represents an increase of 3,12% over that period.
Fondsentimentets poäng
Fondsentimentet poängen(fka Ägarackumulation-poäng) visar vilka aktier som är mest köpta av fonder. Det är resultatet av en sofistikerad kvantitativ flerfaktormodell som identifierar företag med de högsta nivåerna av institutionell ackumulering. Poängsättningsmodellen använder en kombination av den totala ökningen av redovisade ägare, förändringarna i portföljallokeringarna för dessa ägare och andra mått. Siffran sträcker sig från 0 till 100, där högre siffror indikerar en högre nivå av ackumulering i förhållande till sina konkurrenter, och 50 är genomsnittet.
Uppdateringsfrekvens: Dagligen
Se Ownership Explorer, som innehåller en lista över de högst rankade företagen.
Institutionell sälj/köp-kvot
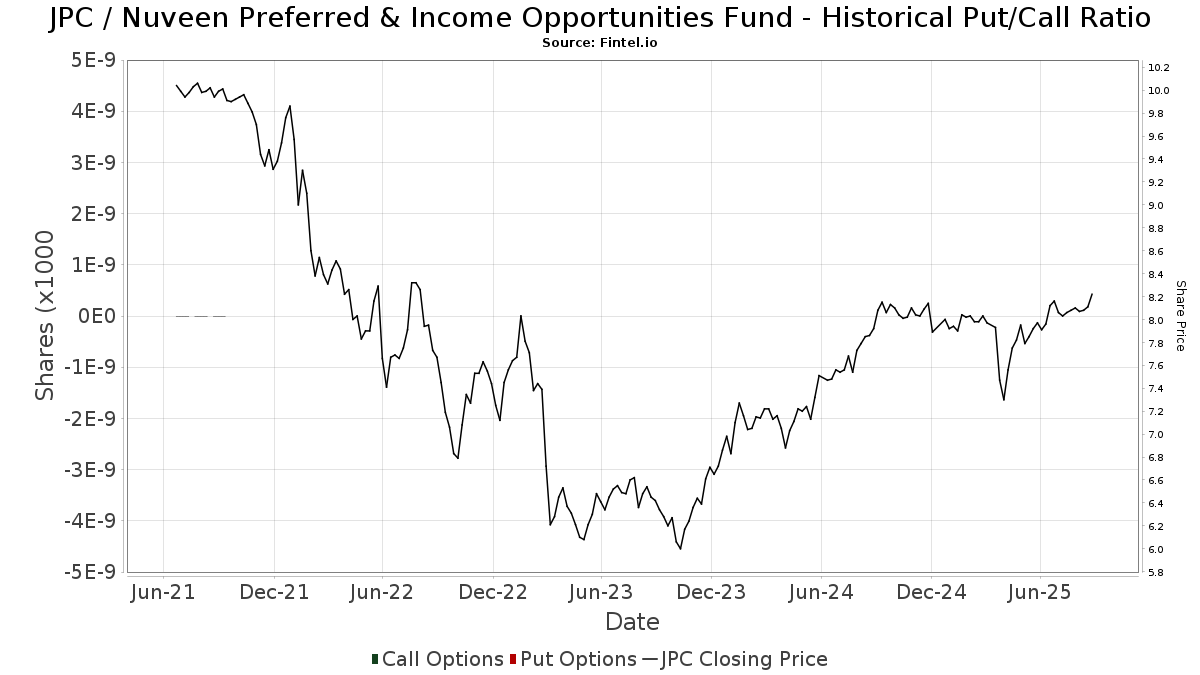
Förutom att rapportera vanliga eget kapital- och skuldemissioner måste institutioner med mer än 100MM tillgångar under förvaltning också avslöja sina innehav av sälj- och köpoptioner. Eftersom säljoptioner i allmänhet indikerar ett negativt sentiment och köpoptioner indikerar ett positivt sentiment, kan vi få en uppfattning om det övergripande institutionella sentimentet genom att plotta förhållandet mellan säljoptioner och köpoptioner. Diagrammet till höger visar det historiska förhållandet mellan sälj- och köpoptioner för detta instrument.
Genom att använda sälj/köp-kvoten som en indikator på aktieägarnas sentiment undviker man en av de största bristerna med att använda det totala institutionella ägandet, nämligen att en betydande del av de förvaltade tillgångarna investeras passivt för att följa index. Passivt förvaltade fonder köper vanligtvis inte optioner, så indikatorn för sälj/köp-kvoten ger en bättre bild av stämningen i aktivt förvaltade fonder.
13F- och NPORT-arkiveringar
Detaljer om 13F-arkiveringar är gratis. Detaljer om NP-arkiveringar kräver ett premiummedlemskap. Gröna rader indikerar nya positioner. Röda rader indikerar stängda positioner. Klicka på länk symbolen för att se hela transaktionshistoriken.
Uppgradera
för att låsa upp premiumdata och exportera till Excel ![]() .
.
| Fil Datum | Källa | Investerare | Typ | Genomsnittligt pris (beräknat) |
Aktier | Δ Aktier (%) |
Rapporterat värde (1000 USD) |
Δ Värde (%) |
Portföljallokering (%) |
|
|---|---|---|---|---|---|---|---|---|---|---|
| 2025-07-25 | 13F | LRI Investments, LLC | 427 | 0,00 | 3 | 0,00 | ||||
| 2025-08-04 | 13F | Prairie Wealth Advisors, Inc. | 29 041 | −3,84 | 235 | −3,31 | ||||
| 2025-08-13 | 13F | Lido Advisors, LLC | 398 064 | −0,79 | 3 219 | −0,06 | ||||
| 2025-07-29 | 13F | International Assets Investment Management, Llc | 61 919 | 20,88 | 497 | 21,87 | ||||
| 2025-08-13 | 13F | EverSource Wealth Advisors, LLC | 16 645 | 0,00 | 133 | 0,76 | ||||
| 2025-05-01 | 13F | Ballentine Partners, LLC | 0 | −100,00 | 0 | |||||
| 2025-07-23 | 13F | Tcfg Wealth Management, Llc | 14 525 | 0,00 | 116 | 0,87 | ||||
| 2025-07-28 | NP | PCEF - Invesco CEF Income Composite ETF This fund is a listed as child fund of Invesco Ltd. and if that institution has disclosed ownership in this security, then these positions will not be double counted when calculating total shares and total value | 2 736 729 | 1,19 | 21 593 | −0,20 | ||||
| 2025-08-14 | 13F | Royal Bank Of Canada | 799 968 | 7,10 | 6 415 | 7,89 | ||||
| 2025-07-11 | 13F | Caldwell Securities, Inc | 27 144 | 0,00 | 218 | 0,46 | ||||
| 2025-08-14 | 13F | Certified Advisory Corp | 10 850 | 1,91 | 87 | 3,57 | ||||
| 2025-06-10 | 13F | Birchbrook, Inc. | 0 | −100,00 | 0 | −100,00 | ||||
| 2025-07-17 | 13F | City Holding Co | 0 | −100,00 | 0 | |||||
| 2025-08-13 | 13F | Cerity Partners LLC | 968 109 | 23,72 | 7 764 | 24,66 | ||||
| 2025-07-11 | 13F | International Private Wealth Advisors LLC | 23 129 | 2,39 | 185 | 3,35 | ||||
| 2025-08-12 | 13F | Advisors Asset Management, Inc. | 1 036 282 | −2,05 | 8 311 | −1,32 | ||||
| 2025-07-22 | 13F | Elevate Capital Advisors, LLC | 15 691 | 2,56 | 126 | 3,31 | ||||
| 2025-08-14 | 13F | GWM Advisors LLC | 278 520 | 3,86 | 2 234 | 4,64 | ||||
| 2025-08-12 | 13F | Bokf, Na | 0 | −100,00 | 0 | |||||
| 2025-07-07 | 13F | Wesbanco Bank Inc | 21 511 | 0,00 | 173 | 0,58 | ||||
| 2025-08-12 | 13F | PSI Advisors, LLC | 19 669 | 1,25 | 158 | 1,95 | ||||
| 2025-07-25 | 13F | Concord Wealth Partners | 2 316 | 2,34 | 19 | 0,00 | ||||
| 2025-07-24 | 13F | Accredited Investor Services, Llc | 11 610 | −3,34 | 93 | −2,11 | ||||
| 2025-08-11 | 13F | Hexagon Capital Partners LLC | 0 | −100,00 | 0 | |||||
| 2025-08-07 | 13F | Hennion & Walsh Asset Management, Inc. | 570 516 | −22,63 | 4 576 | −22,05 | ||||
| 2025-07-17 | 13F | Sound Income Strategies, LLC | 6 734 | 72,67 | 54 | 74,19 | ||||
| 2025-08-04 | 13F | Waterfront Wealth Inc. | 19 790 | 0,06 | 159 | 0,64 | ||||
| 2025-08-14 | 13F | Modern Wealth Management, LLC | 0 | −100,00 | 0 | −100,00 | ||||
| 2025-08-06 | 13F | One Wealth Capital Management, Llc | 47 965 | 0,00 | 385 | 0,79 | ||||
| 2025-07-09 | 13F | Beacon Financial Group | 15 322 | 2,26 | 123 | 2,52 | ||||
| 2025-06-12 | 13F/A | Deutsche Bank Ag\ | 0 | −100,00 | 0 | |||||
| 2025-07-25 | 13F | Hazlett, Burt & Watson, Inc. | 4 828 | 5,44 | 0 | |||||
| 2025-08-14 | 13F | SWAN Capital LLC | 995 | 0,00 | 8 | 0,00 | ||||
| 2025-08-27 | NP | AAHYX - Thrivent Diversified Income Plus Fund Class A | 19 794 | −5,31 | 159 | −4,82 | ||||
| 2025-08-13 | 13F | Level Four Advisory Services, Llc | 72 055 | 0,24 | 578 | 0,87 | ||||
| 2025-07-10 | 13F | Stolper Co | 69 231 | 3,88 | 1 | |||||
| 2025-08-12 | 13F | AlphaCore Capital LLC | 102 959 | 10,05 | 833 | 10,93 | ||||
| 2025-08-27 | NP | THRIVENT SERIES FUND INC - Thrivent Diversified Income Plus Portfolio Class A | 11 861 | −9,37 | 95 | −8,65 | ||||
| 2025-08-15 | 13F | Tower Research Capital LLC (TRC) | 421 | 742,00 | 3 | |||||
| 2025-08-08 | 13F | Fiera Capital Corp | 269 309 | −2,38 | 2 160 | −1,64 | ||||
| 2025-08-14 | 13F | Mml Investors Services, Llc | 29 156 | 71,51 | 0 | |||||
| 2025-08-14 | 13F | Investmark Advisory Group LLC | 43 688 | 0,36 | 350 | 1,16 | ||||
| 2025-07-17 | 13F | Coastline Trust Co | 12 143 | 0,00 | 97 | 1,04 | ||||
| 2025-08-13 | 13F | Fisher Asset Management, LLC | 14 574 | 5,30 | 117 | 5,45 | ||||
| 2025-08-15 | 13F | Kestra Advisory Services, LLC | 159 139 | 20,03 | 1 276 | 20,95 | ||||
| 2025-08-18 | 13F | Geneos Wealth Management Inc. | 208 255 | 10,28 | 1 670 | 11,11 | ||||
| 2025-08-13 | 13F | StoneX Group Inc. | 53 114 | 4,60 | 429 | 5,41 | ||||
| 2025-07-17 | 13F | Janney Montgomery Scott LLC | 571 517 | 5,48 | 5 | 0,00 | ||||
| 2025-08-01 | 13F | Envestnet Asset Management Inc | 308 490 | 7,34 | 2 474 | 8,18 | ||||
| 2025-08-12 | 13F | Steward Partners Investment Advisory, Llc | 172 897 | 61,36 | 1 387 | 62,68 | ||||
| 2025-07-22 | 13F | Beacon Financial Advisory LLC | 13 284 | 0,39 | 107 | 0,95 | ||||
| 2025-08-12 | 13F | Financial Advocates Investment Management | 0 | −100,00 | 0 | −100,00 | ||||
| 2025-08-15 | 13F | CI Private Wealth, LLC | 16 531 | −20,28 | 133 | −20,00 | ||||
| 2025-08-07 | 13F | Montag A & Associates Inc | 219 | 0,00 | 2 | 0,00 | ||||
| 2025-08-14 | 13F | Wiley Bros.-aintree Capital, Llc | 142 246 | 4,70 | 1 141 | 5,95 | ||||
| 2025-07-03 | 13F | Sage Capital Advisors,llc | 41 989 | −8,84 | 337 | −8,20 | ||||
| 2025-05-13 | 13F | Aptus Capital Advisors, LLC | 0 | −100,00 | 0 | |||||
| 2025-08-05 | 13F | Blue Barn Wealth, LLC | 0 | −100,00 | 0 | |||||
| 2025-08-07 | 13F | CENTRAL TRUST Co | 9 866 | 0,00 | 79 | 1,28 | ||||
| 2025-07-30 | 13F | Brookstone Capital Management | 13 992 | 112 | ||||||
| 2025-05-12 | 13F | Sandy Spring Bank | 238 | 2 | ||||||
| 2025-08-12 | 13F | LPL Financial LLC | 1 898 223 | −20,18 | 15 224 | −19,58 | ||||
| 2025-08-04 | 13F | Spire Wealth Management | 92 669 | 35,49 | 743 | 36,58 | ||||
| 2025-04-14 | 13F | LexAurum Advisors, LLC | 0 | −100,00 | 0 | |||||
| 2025-07-31 | 13F | Gill Capital Partners, Llc | 14 492 | −1,73 | 116 | −0,85 | ||||
| 2025-08-01 | 13F | Planning Directions Inc | 0 | −100,00 | 0 | |||||
| 2025-08-12 | 13F | Fca Corp /tx | 454 604 | 3,91 | 3 646 | 4,68 | ||||
| 2025-05-12 | 13F | Hantz Financial Services, Inc. | 0 | −100,00 | 0 | |||||
| 2025-05-19 | 13F | Smith Asset Management Co., LLC | 357 253 | −0,79 | 2 844 | 0,46 | ||||
| 2025-08-04 | 13F | IFG Advisory, LLC | 34 989 | −13,89 | 281 | −13,31 | ||||
| 2025-07-22 | 13F | Powell Investment Advisors, LLC | 11 627 | 0,00 | 94 | 1,08 | ||||
| 2025-07-24 | 13F | Etesian Wealth Advisors, Inc. | 13 000 | −7,14 | 104 | −6,31 | ||||
| 2025-08-12 | 13F | Pathstone Holdings, LLC | 25 000 | 0,00 | 200 | 0,50 | ||||
| 2025-08-15 | 13F | Captrust Financial Advisors | 1 092 658 | 8,91 | 8 763 | 9,74 | ||||
| 2025-08-12 | 13F | Tradition Wealth Management, LLC | 13 369 | 0,00 | 107 | 0,94 | ||||
| 2025-08-19 | 13F | Cape Investment Advisory, Inc. | 941 | 0,00 | 8 | 0,00 | ||||
| 2025-07-08 | 13F | Nbc Securities, Inc. | 8 135 | −1,27 | 0 | |||||
| 2025-07-08 | 13F | Parallel Advisors, LLC | 630 | 0,00 | 5 | 0,00 | ||||
| 2025-08-05 | 13F | Pacific Wealth Strategies Group, Inc. | 10 000 | 0,00 | 81 | 1,27 | ||||
| 2025-08-19 | 13F | Anchor Investment Management, LLC | 10 733 | 0,43 | 86 | 1,18 | ||||
| 2025-08-12 | 13F | XTX Topco Ltd | 42 539 | 341 | ||||||
| 2025-07-07 | 13F | Trust Co | 676 | 0,00 | 5 | 0,00 | ||||
| 2025-07-23 | 13F | Stonegate Investment Group, LLC | 15 488 | −3,13 | 124 | −2,36 | ||||
| 2025-07-31 | 13F | Cambridge Investment Research Advisors, Inc. | 471 113 | −2,20 | 4 | 0,00 | ||||
| 2025-08-05 | 13F | Smith Shellnut Wilson Llc /adv | 12 855 | 0,00 | 103 | 0,98 | ||||
| 2025-07-25 | NP | FCEF - First Trust CEF Income Opportunity ETF This fund is a listed as child fund of First Trust Advisors Lp and if that institution has disclosed ownership in this security, then these positions will not be double counted when calculating total shares and total value | 140 384 | 3,93 | 1 108 | 2,50 | ||||
| 2025-08-12 | 13F | SRS Capital Advisors, Inc. | 15 593 | 125 | ||||||
| 2025-07-17 | 13F | Melfa Wealth Management, Llc | 97 230 | −2,54 | 780 | −1,89 | ||||
| 2025-08-11 | 13F | CBIZ Investment Advisory Services, LLC | 0 | −100,00 | 0 | |||||
| 2025-08-12 | 13F | Northstar Financial Companies, Inc. | 12 475 | −65,14 | 100 | −64,79 | ||||
| 2025-08-13 | 13F | Invesco Ltd. | 2 951 656 | 0,74 | 23 672 | 1,50 | ||||
| 2025-05-14 | 13F | Susquehanna International Group, Llp | 0 | −100,00 | 0 | |||||
| 2025-08-08 | 13F | Hartland & Co., LLC | 16 917 | 3,18 | 136 | 3,85 | ||||
| 2025-08-14 | 13F | Jane Street Group, Llc | 47 315 | 379 | ||||||
| 2025-08-14 | 13F | Wells Fargo & Company/mn | 3 761 396 | 5,57 | 30 166 | 6,36 | ||||
| 2025-08-11 | 13F | Protective Life Corp | 440 000 | 0,00 | 3 529 | 0,74 | ||||
| 2025-07-17 | 13F/A | Capital Investment Advisors, LLC | 339 215 | −3,58 | 2 721 | −2,86 | ||||
| 2025-07-30 | 13F | Whittier Trust Co Of Nevada Inc | 4 943 | 0,00 | 40 | 0,00 | ||||
| 2025-07-09 | 13F | Triumph Capital Management | 110 974 | 9,97 | 890 | 10,83 | ||||
| 2025-05-16 | 13F | Coppell Advisory Solutions LLC | 0 | −100,00 | 0 | |||||
| 2025-08-12 | 13F | J. L. Bainbridge & Co., Inc. | 18 991 | 0,00 | 152 | 0,66 | ||||
| 2025-08-07 | 13F | Kestra Private Wealth Services, Llc | 37 874 | −27,74 | 304 | −27,34 | ||||
| 2025-07-14 | 13F | Maryland Capital Advisors Inc. | 10 009 | 80 | ||||||
| 2025-04-30 | 13F | Axxcess Wealth Management, Llc | 0 | −100,00 | 0 | |||||
| 2025-08-14 | 13F | Snowden Capital Advisors LLC | 23 207 | −11,35 | 188 | −10,95 | ||||
| 2025-04-09 | 13F | Freestate Advisors LLC | 0 | −100,00 | 0 | |||||
| 2025-07-25 | 13F | Apollon Wealth Management, LLC | 22 175 | 1,51 | 178 | 2,31 | ||||
| 2025-07-30 | 13F | Whittier Trust Co | 27 043 | −4,12 | 217 | −3,57 | ||||
| 2025-08-06 | 13F | Commonwealth Equity Services, Llc | 2 366 589 | 3,60 | 19 | 0,00 | ||||
| 2025-08-13 | 13F | First Trust Advisors Lp | 281 887 | 2,67 | 2 261 | 3,43 | ||||
| 2025-08-08 | 13F | Creative Planning | 12 482 | 13,73 | 100 | 14,94 | ||||
| 2025-07-31 | 13F | Anchor Capital Management Group Inc | 70 000 | 0,00 | 561 | 0,72 | ||||
| 2025-07-31 | 13F | Glass Jacobson Investment Advisors llc | 22 462 | −6,10 | 180 | −4,26 | ||||
| 2025-07-21 | 13F | Future Financial Wealth Managment LLC | 10 000 | 0,00 | 80 | 1,27 | ||||
| 2025-07-21 | 13F | Ameritas Advisory Services, LLC | 54 151 | 7,92 | 434 | 10,15 | ||||
| 2025-05-12 | 13F | C2P Capital Advisory Group, LLC d.b.a. Prosperity Capital Advisors | 0 | −100,00 | 0 | −100,00 | ||||
| 2025-08-05 | 13F | Bank of New York Mellon Corp | 29 581 | −0,27 | 237 | 0,42 | ||||
| 2025-07-09 | 13F | Post Resch Tallon Group Inc. | 14 560 | 0,00 | 117 | 0,87 | ||||
| 2025-08-12 | 13F | Walled Lake Planning & Wealth Management, Llc | 55 269 | 0,00 | 443 | 0,91 | ||||
| 2025-07-08 | 13F | Advance Capital Management, Inc. | 15 926 | 128 | ||||||
| 2025-07-14 | 13F | Wealth Advisory Solutions, LLC | 274 632 | 12,52 | 2 203 | 13,39 | ||||
| 2025-08-11 | 13F | Shufro Rose & Co Llc | 18 373 | 0,00 | 146 | 0,00 | ||||
| 2025-07-14 | 13F | U.S. Capital Wealth Advisors, LLC | 14 602 | 0,00 | 117 | 0,86 | ||||
| 2025-07-30 | 13F | Green Square Capital Advisors Llc | 11 653 | 0,00 | 93 | 1,09 | ||||
| 2025-07-14 | 13F | Gridiron Partners, LLC | 52 969 | 0,00 | 425 | 0,71 | ||||
| 2025-07-21 | 13F | Onyx Financial Advisors, LLC | 37 848 | 200,50 | 304 | 203,00 | ||||
| 2025-07-29 | 13F | Chicago Partners Investment Group LLC | 347 690 | 6,49 | 2 792 | 9,32 | ||||
| 2025-08-07 | 13F | Ibex Wealth Advisors | 314 819 | 0,71 | 2 525 | 1,45 | ||||
| 2025-08-14 | 13F | Ausdal Financial Partners, Inc. | 19 449 | 0,09 | 156 | 0,65 | ||||
| 2025-08-14 | 13F | Atomi Financial Group, Inc. | 12 910 | 1,58 | 104 | 1,98 | ||||
| 2025-07-10 | 13F | Wealth Enhancement Advisory Services, Llc | 220 727 | 49,32 | 1 792 | 52,38 | ||||
| 2025-07-28 | 13F/A | Penbrook Management LLC | 25 710 | 0,00 | 206 | 0,98 | ||||
| 2025-09-09 | 13F | NWF Advisory Services Inc. | 43 620 | −0,38 | 350 | 0,29 | ||||
| 2025-08-14 | 13F | Vivaldi Capital Management, LLC | 0 | −100,00 | 0 | |||||
| 2025-08-12 | 13F | Proequities, Inc. | 0 | 0 | ||||||
| 2025-08-08 | 13F | Evolution Wealth Advisors, LLC | 10 162 | 81 | ||||||
| 2025-08-14 | 13F | Summit Trail Advisors, Llc | 18 299 | 2,57 | 148 | 2,80 | ||||
| 2025-08-21 | 13F | Pathway Financial Advisers, LLC | 11 964 | 0,98 | 96 | 1,06 | ||||
| 2025-08-14 | 13F | Boston Private Wealth Llc | 0 | −100,00 | 0 | |||||
| 2025-07-10 | 13F | Oliver Lagore Vanvalin Investment Group | 2 174 | 0,00 | 17 | 0,00 | ||||
| 2025-08-13 | 13F | Cary Street Partners Financial Llc | 102 362 | −0,53 | 821 | 0,12 | ||||
| 2025-08-14 | 13F | Mariner, LLC | 89 081 | 15,20 | 714 | 16,10 | ||||
| 2025-08-27 | NP | THRIVENT SERIES FUND INC - Thrivent Balanced Income Plus Portfolio Class A | 4 632 | −12,69 | 37 | −11,90 | ||||
| 2025-07-31 | 13F | Optimum Investment Advisors | 0 | −100,00 | 0 | |||||
| 2025-08-13 | 13F | Rsm Us Wealth Management Llc | 34 334 | −0,06 | 278 | 0,73 | ||||
| 2025-08-19 | 13F | Newbridge Financial Services Group, Inc. | 2 872 | 23 | ||||||
| 2025-05-15 | 13F | Benchmark Investment Advisors LLC | 88 000 | 0,00 | 700 | 1,30 | ||||
| 2025-08-08 | 13F | Avantax Advisory Services, Inc. | 43 649 | −1,85 | 350 | −1,13 | ||||
| 2025-08-13 | 13F | Russell Investments Group, Ltd. | 461 | 0,00 | 4 | 0,00 | ||||
| 2025-07-22 | 13F | DAVENPORT & Co LLC | 248 714 | −1,42 | 1 995 | −0,70 | ||||
| 2025-05-15 | 13F | Citadel Advisors Llc | 0 | −100,00 | 0 | |||||
| 2025-07-30 | 13F | D.a. Davidson & Co. | 20 458 | 8,68 | 164 | 10,07 | ||||
| 2025-08-14 | 13F | UBS Group AG | 4 198 535 | −5,02 | 33 672 | −4,30 | ||||
| 2025-08-14 | 13F | Bank Of America Corp /de/ | 4 201 219 | 2,54 | 33 694 | 3,31 | ||||
| 2025-08-05 | 13F | GHP Investment Advisors, Inc. | 1 229 | 0,00 | 10 | 0,00 | ||||
| 2025-08-11 | 13F | Mosaic Family Wealth Partners, Llc | 58 444 | 0,00 | 469 | 0,65 | ||||
| 2025-05-15 | 13F | Talon Private Wealth, LLC | 0 | −100,00 | 0 | −100,00 | ||||
| 2025-08-26 | 13F/A | Thrivent Financial For Lutherans | 161 712 | −5,82 | 1 | 0,00 | ||||
| 2025-08-07 | 13F | PFG Advisors | 0 | −100,00 | 0 | |||||
| 2025-08-12 | 13F | Founders Financial Alliance, LLC | 13 208 | 0,00 | 106 | 0,00 | ||||
| 2025-07-18 | 13F | Philip James Wealth Mangement, LLC | 10 000 | 0,00 | 80 | 1,27 | ||||
| 2025-08-12 | 13F | Titleist Asset Management, Llc | 11 833 | −5,26 | 95 | −5,05 | ||||
| 2025-07-28 | 13F | Mission Hills Financial Advisory, LLC | 73 305 | 389,19 | 588 | 393,28 | ||||
| 2025-08-14 | 13F | Operose Advisors LLC | 44 465 | 0,00 | 357 | 0,85 | ||||
| 2025-04-24 | 13F | Wingate Wealth Advisors, Inc. | 0 | −100,00 | 0 | |||||
| 2025-07-28 | 13F | Duncker Streett & Co Inc | 27 439 | 0,00 | 220 | 0,92 | ||||
| 2025-08-19 | 13F | National Asset Management, Inc. | 49 977 | −25,46 | 401 | −24,10 | ||||
| 2025-05-15 | 13F | Hrt Financial Lp | 0 | −100,00 | 0 | |||||
| 2025-06-26 | NP | ATCAX - Anchor Risk Managed Credit Strategies Fund Advisor Class Shares | 70 000 | 0,00 | 552 | −1,43 | ||||
| 2025-05-15 | 13F | Logan Stone Capital, LLC | 0 | −100,00 | 0 | |||||
| 2025-03-18 | 13F | Thoma Capital Management LLC | 467 245 | 3 673 | ||||||
| 2025-08-14 | 13F | Gen-Wealth Partners Inc | 929 | 0,00 | 7 | 0,00 | ||||
| 2025-08-14 | 13F | Bramshill Investments, LLC | 87 915 | 6,49 | 705 | 7,31 | ||||
| 2025-07-31 | 13F | Oppenheimer & Co Inc | 36 458 | −7,79 | 292 | −7,01 | ||||
| 2025-07-17 | 13F | Beacon Capital Management, LLC | 14 258 | 0,00 | 114 | 0,88 | ||||
| 2025-08-27 | NP | THRIVENT SERIES FUND INC - Thrivent Opportunity Income Plus Portfolio Class A | 8 576 | −16,56 | 69 | −16,05 | ||||
| 2025-08-14 | 13F | Advisor OS, LLC | 29 494 | 0,44 | 237 | 1,29 | ||||
| 2025-05-13 | 13F | Elequin Capital Lp | 0 | −100,00 | 0 | |||||
| 2025-07-29 | 13F | Private Trust Co Na | 31 148 | 6,35 | 250 | 6,87 | ||||
| 2025-07-28 | 13F | Harbour Investments, Inc. | 51 076 | 0,00 | 410 | 0,74 | ||||
| 2025-08-19 | 13F | Campbell Capital Management Inc | 381 038 | −1,03 | 3 056 | −0,29 | ||||
| 2025-05-14 | 13F | Aristides Capital LLC | 0 | −100,00 | 0 | |||||
| 2025-07-31 | 13F | Washington Trust Advisors, Inc. | 2 600 | 0,00 | 21 | 0,00 | ||||
| 2025-04-09 | 13F | American National Bank | 0 | −100,00 | 0 | −100,00 | ||||
| 2025-08-07 | 13F | Samalin Investment Counsel, LLC | 114 822 | 3,84 | 921 | 4,55 | ||||
| 2025-08-13 | 13F | Baird Financial Group, Inc. | 17 356 | 4,52 | 139 | 5,30 | ||||
| 2025-07-16 | 13F | MKT Advisors LLC | 15 560 | −3,12 | 126 | 10,62 | ||||
| 2025-07-23 | 13F | Tectonic Advisors Llc | 50 000 | 0,00 | 401 | 0,75 | ||||
| 2025-08-05 | 13F | Huntington National Bank | 36 | 500,00 | ||||||
| 2025-07-24 | 13F | Ronald Blue Trust, Inc. | 2 398 | 0,00 | 19 | 0,00 | ||||
| 2025-08-11 | 13F | Annis Gardner Whiting Capital Advisors, LLC | 654 | 5 | ||||||
| 2025-08-12 | 13F | Coldstream Capital Management Inc | 0 | −100,00 | 0 | |||||
| 2025-07-17 | 13F | Smith Chas P & Associates Pa Cpas | 42 500 | 142,86 | 341 | 144,60 | ||||
| 2025-08-12 | 13F | CIBC Private Wealth Group, LLC | 9 150 | −2,08 | 73 | 10,61 | ||||
| 2025-07-25 | 13F | Valley Brook Capital Group, Inc. | 13 489 | 0,00 | 108 | 0,93 | ||||
| 2025-08-07 | 13F | Readystate Asset Management Lp | 88 024 | 706 | ||||||
| 2025-08-05 | 13F | Sage Capital Management, LLC | 20 500 | −16,33 | 164 | −15,90 | ||||
| 2025-05-09 | 13F | Investment Counsel Co Of Nevada | 0 | −100,00 | 0 | |||||
| 2025-08-06 | 13F | Penserra Capital Management LLC | 693 605 | 3,05 | 6 | 0,00 | ||||
| 2025-05-06 | 13F | Noesis Capital Mangement Corp | 0 | −100,00 | 0 | |||||
| 2025-07-22 | 13F | Fortitude Advisory Group L.L.C. | 25 561 | 0,00 | 205 | 9,68 | ||||
| 2025-08-14 | 13F | Wealth Preservation Advisors, LLC | 805 | 0,00 | 6 | 0,00 | ||||
| 2025-08-05 | 13F | Shaker Financial Services, LLC | 54 700 | 3,21 | 442 | 4,99 | ||||
| 2025-08-12 | 13F | MAI Capital Management | 12 972 | 4,13 | 104 | 5,05 | ||||
| 2025-05-16 | 13F/A | Goldman Sachs Group Inc | 0 | −100,00 | 0 | −100,00 | ||||
| 2025-08-12 | 13F | Change Path, LLC | 14 602 | −2,14 | 117 | −0,85 | ||||
| 2025-07-14 | 13F | E&G Advisors, LP | 90 550 | −1,42 | 725 | −0,69 | ||||
| 2025-07-16 | 13F | ORG Partners LLC | 247 | 0,00 | 2 | 0,00 | ||||
| 2025-07-23 | 13F | Abel Hall, LLC | 70 000 | 600,00 | 561 | 610,13 | ||||
| 2025-08-04 | 13F | Kovack Advisors, Inc. | 14 843 | 25,33 | 119 | 26,60 | ||||
| 2025-08-14 | 13F | Mercer Global Advisors Inc /adv | 30 861 | −18,13 | 248 | −17,67 | ||||
| 2025-07-31 | 13F | Brinker Capital Investments, LLC | 0 | −100,00 | 0 | −100,00 | ||||
| 2025-07-31 | 13F | Carlton Hofferkamp & Jenks Wealth Management, LLC | 12 000 | 0,00 | 97 | 10,34 | ||||
| 2025-08-13 | 13F | Jones Financial Companies Lllp | 8 040 | 133 900,00 | 64 | |||||
| 2025-07-10 | 13F | Uptown Financial Advisors LLC | 31 600 | 0,00 | 253 | 0,80 | ||||
| 2025-07-18 | 13F | Truist Financial Corp | 498 856 | 53,73 | 4 001 | 54,92 | ||||
| 2025-07-29 | 13F | Stratos Wealth Partners, LTD. | 511 842 | 1,66 | 4 105 | 2,42 | ||||
| 2025-07-15 | 13F | Main Street Group, LTD | 1 681 | 0,00 | 13 | 0,00 | ||||
| 2025-08-14 | 13F | Integrated Wealth Concepts LLC | 11 147 | −11,03 | 89 | −10,10 | ||||
| 2025-07-24 | 13F | Us Bancorp \de\ | 1 977 | −91,93 | 16 | −92,27 | ||||
| 2025-08-14 | 13F | Gerber Kawasaki Wealth & Investment Management | 13 159 | 0,84 | 106 | 1,94 | ||||
| 2025-05-12 | 13F | Independent Advisor Alliance | 0 | −100,00 | 0 | |||||
| 2025-07-30 | 13F | Clifford Swan Investment Counsel Llc | 21 424 | 0,00 | 172 | 0,59 | ||||
| 2025-05-15 | 13F | Millennium Management Llc | 0 | −100,00 | 0 | −100,00 | ||||
| 2025-08-14 | 13F | Diversify Wealth Management, Llc | 73 000 | 0,00 | 589 | 4,43 | ||||
| 2025-08-13 | 13F | Baker Avenue Asset Management, LP | 12 500 | 100 | ||||||
| 2025-08-14 | 13F | CoreCap Advisors, LLC | 237 784 | −0,32 | 1 907 | 0,47 | ||||
| 2025-07-23 | 13F | LifeSteps Financial, Inc. | 11 520 | 0,00 | 92 | 1,10 | ||||
| 2025-08-08 | 13F | Pnc Financial Services Group, Inc. | 1 154 | −91,41 | 9 | −91,51 | ||||
| 2025-08-13 | 13F | SageView Advisory Group, LLC | 14 147 | 0,00 | 114 | 1,79 | ||||
| 2025-04-21 | 13F | Kingswood Wealth Advisors, Llc | 0 | −100,00 | 0 | |||||
| 2025-08-12 | 13F | Jacobi Capital Management LLC | 16 700 | 60,58 | 134 | 62,20 | ||||
| 2025-05-08 | 13F | We Are One Seven, LLC | 0 | −100,00 | 0 | |||||
| 2025-07-17 | 13F | Johnson & White Wealth Management, LLC | 13 127 | 0 | ||||||
| 2025-07-31 | 13F | 180 Wealth Advisors, Llc | 13 069 | 0,00 | 105 | 0,97 | ||||
| 2025-07-22 | 13F | HFM Investment Advisors, LLC | 1 043 | 0,00 | 8 | 0,00 | ||||
| 2025-08-13 | 13F | Aspire Growth Partners LLC | 11 872 | 0,84 | 95 | 3,26 | ||||
| 2025-05-15 | 13F | Concorde Asset Management, LLC | 17 651 | −3,81 | 133 | −8,33 | ||||
| 2025-07-18 | 13F | PFG Investments, LLC | 15 949 | 23,45 | 128 | 24,51 | ||||
| 2025-05-15 | 13F | Second Line Capital, LLC | 0 | −100,00 | 0 | |||||
| 2025-07-21 | 13F | Pflug Koory, LLC | 66 | 0,00 | 1 | |||||
| 2025-08-04 | 13F | Keybank National Association/oh | 24 921 | 0,00 | 200 | 0,51 | ||||
| 2025-07-22 | 13F | Investors Asset Management Of Georgia Inc /ga/ /adv | 47 750 | 3,24 | 383 | 3,80 | ||||
| 2025-08-14 | 13F | Sit Investment Associates Inc | 1 196 141 | −70,87 | 10 | −71,87 | ||||
| 2025-08-06 | 13F | Moors & Cabot, Inc. | 565 388 | 6,35 | 4 534 | 7,16 | ||||
| 2025-04-25 | 13F | WASHINGTON TRUST Co | 0 | −100,00 | 0 | |||||
| 2025-08-14 | 13F | Cohen & Steers, Inc. | 785 251 | 0,00 | 6 | 0,00 | ||||
| 2025-07-14 | 13F | AdvisorNet Financial, Inc | 2 382 | 2,58 | 19 | 5,56 | ||||
| 2025-04-30 | 13F | Parr Mcknight Wealth Management Group, Llc | 0 | −100,00 | 0 | |||||
| 2025-08-06 | 13F | Prospera Financial Services Inc | 51 542 | 9,70 | 413 | 10,43 | ||||
| 2025-05-14 | 13F | Van Hulzen Asset Management, LLC | 0 | −100,00 | 0 | |||||
| 2025-08-13 | 13F | Beacon Pointe Advisors, LLC | 11 059 | −6,75 | 89 | −6,38 | ||||
| 2025-05-01 | 13F | Schechter Investment Advisors, LLC | 15 593 | 0,00 | 124 | 1,64 | ||||
| 2025-07-24 | 13F | Trust Co Of Toledo Na /oh/ | 276 | 2 | ||||||
| 2025-08-05 | 13F | Tsfg, Llc | 20 222 | 0,00 | 0 | |||||
| 2025-07-07 | 13F | Centurion Wealth Management LLC | 68 529 | −1,22 | 550 | 0,73 | ||||
| 2025-07-23 | 13F | Elm3 Financial Group, LLC | 0 | −100,00 | 0 | |||||
| 2025-08-04 | 13F | Live Oak Private Wealth LLC | 51 460 | 0,00 | 413 | 0,73 | ||||
| 2025-08-08 | 13F | Cetera Investment Advisers | 470 523 | 1,74 | 3 774 | 2,50 | ||||
| 2025-07-15 | 13F | Fifth Third Bancorp | 1 572 | −94,97 | 13 | −95,16 | ||||
| 2025-08-14 | 13F | Ameriprise Financial Inc | 611 388 | 20,38 | 4 903 | 21,30 | ||||
| 2025-07-22 | 13F | Accel Wealth Management | 73 416 | 0,47 | 589 | 1,20 | ||||
| 2025-08-11 | 13F | Private Advisor Group, LLC | 145 556 | −7,73 | 1 167 | −7,01 | ||||
| 2025-08-12 | 13F | Global Retirement Partners, LLC | 192 | 3,78 | 2 | 0,00 | ||||
| 2025-05-08 | 13F | Private Advisory Group LLC | 0 | −100,00 | 0 | |||||
| 2025-08-11 | 13F | Wealthspire Advisors, LLC | 193 045 | 1 548 | ||||||
| 2025-08-07 | 13F | Allworth Financial LP | 17 661 | 106,20 | 142 | 116,92 | ||||
| 2025-08-13 | 13F | Northwestern Mutual Wealth Management Co | 49 682 | −2,77 | 398 | −1,97 | ||||
| 2025-08-08 | 13F/A | Sequoia Financial Advisors, LLC | 0 | −100,00 | 0 | |||||
| 2025-04-23 | 13F | Western Wealth Management, LLC | 0 | −100,00 | 0 | −100,00 | ||||
| 2025-07-31 | 13F | Richards, Merrill & Peterson, Inc. | 0 | −100,00 | 0 | |||||
| 2025-08-05 | 13F | Plante Moran Financial Advisors, LLC | 1 550 | 12 | ||||||
| 2025-08-14 | 13F | CoreFirst Bank & Trust | 4 197 | 34 | ||||||
| 2025-08-11 | 13F | Rothschild Investment Llc | 69 400 | −83,77 | 557 | −83,66 | ||||
| 2025-08-01 | 13F | Transcend Wealth Collective, Llc | 0 | −100,00 | 0 | |||||
| 2025-08-08 | 13F | VeraBank, N.A. | 13 658 | 0,00 | 110 | 0,93 | ||||
| 2025-08-07 | 13F | Alpha Cubed Investments, LLC | 15 899 | 0,00 | 128 | 0,79 | ||||
| 2025-08-11 | 13F | HighTower Advisors, LLC | 129 078 | −33,78 | 1 035 | −33,27 | ||||
| 2025-07-17 | 13F | Gleason Group, Inc. | 23 | 0,00 | 0 | |||||
| 2025-07-25 | 13F | Cwm, Llc | 8 491 | 0,14 | 0 | |||||
| 2025-08-14 | 13F | Raymond James Financial Inc | 3 456 317 | 3,49 | 27 720 | 4,27 | ||||
| 2025-07-22 | 13F/A | Kingstone Capital Partners Texas, LLC | 19 818 | 6,56 | 159 | 7,43 | ||||
| 2025-05-14 | 13F | Bragg Financial Advisors, Inc | 0 | −100,00 | 0 | |||||
| 2025-07-21 | 13F | Patriot Financial Group Insurance Agency, LLC | 32 639 | −1,96 | 262 | −1,14 | ||||
| 2025-06-26 | NP | AAINX - Thrivent Opportunity Income Plus Fund Class A | 43 598 | 0,00 | 338 | −2,88 | ||||
| 2025-08-04 | 13F | Linscomb & Williams, Inc. | 97 000 | 778 | ||||||
| 2025-07-25 | 13F | Atria Wealth Solutions, Inc. | 20 922 | −75,12 | 170 | −74,85 | ||||
| 2025-07-11 | 13F/A | Umb Bank N A/mo | 55 993 | 0,00 | 449 | 0,90 | ||||
| 2025-05-02 | 13F | BlackRock, Inc. | 0 | −100,00 | 0 | |||||
| 2025-07-22 | 13F | Berger Financial Group, Inc | 23 711 | 1,84 | 190 | 2,70 | ||||
| 2025-07-09 | 13F | Sunpointe, LLC | 11 200 | 90 | ||||||
| 2025-08-14 | 13F | Warren Averett Asset Management, LLC | 11 512 | 92 | ||||||
| 2025-08-01 | 13F | James Investment Research Inc | 0 | −100,00 | 0 | |||||
| 2025-07-21 | 13F | Ameriflex Group, Inc. | 9 016 | 0,00 | 72 | 0,00 | ||||
| 2025-09-04 | 13F/A | Advisor Group Holdings, Inc. | 1 137 158 | 17,79 | 9 120 | 18,69 | ||||
| 2025-08-14 | 13F | Harwood Advisory Group, LLC | 551 | 0,00 | 4 | 0,00 | ||||
| 2025-08-28 | NP | YYY - Amplify High Income ETF | 686 535 | 2,00 | 5 506 | 2,78 | ||||
| 2025-06-30 | NP | CVY - Invesco Zacks Multi-Asset Income ETF This fund is a listed as child fund of Invesco Ltd. and if that institution has disclosed ownership in this security, then these positions will not be double counted when calculating total shares and total value | 156 587 | −4,51 | 1 214 | −7,05 | ||||
| 2025-07-22 | 13F | Wealthcare Advisory Partners LLC | 77 543 | −8,04 | 622 | −7,45 | ||||
| 2025-08-20 | NP | LSPAX - LoCorr Spectrum Income Fund Class A | 70 603 | 0,00 | 566 | 0,89 | ||||
| 2025-08-07 | 13F | SFE Investment Counsel | 12 816 | 0,00 | 103 | 0,00 | ||||
| 2025-07-14 | 13F | GAMMA Investing LLC | 7 | 0 | ||||||
| 2025-07-22 | 13F | Coastal Investment Advisors, Inc. | 21 214 | 1,78 | 170 | 3,03 | ||||
| 2025-08-15 | 13F | Morgan Stanley | 6 886 989 | 1,57 | 55 234 | 2,33 | ||||
| 2025-08-14 | 13F | RMB Capital Management, LLC | 36 816 | 0,11 | 297 | 1,02 | ||||
| 2025-08-11 | 13F | Ironsides Asset Advisors, LLC | 11 428 | 92 | ||||||
| 2025-07-24 | 13F | Game Plan Financial Advisors, LLC | 1 977 | 0,00 | 16 | 0,00 | ||||
| 2025-08-05 | 13F | Palogic Value Management, L.P. | 100 317 | −0,98 | 805 | −0,25 | ||||
| 2025-07-25 | 13F | Ellis Investment Partners, LLC | 10 060 | −23,64 | 81 | −23,08 | ||||
| 2025-07-30 | 13F | Greatmark Investment Partners, Inc. | 1 011 715 | 1,32 | 8 114 | 2,08 | ||||
| 2025-08-05 | 13F | Sigma Planning Corp | 0 | −100,00 | 0 | |||||
| 2025-08-11 | 13F | Strategic Wealth Partners, Ltd. | 7 908 | 63 | ||||||
| 2025-07-17 | 13F | Wolff Wiese Magana Llc | 350 | 0,00 | 3 | 0,00 | ||||
| 2025-08-12 | 13F | Leigh Baldwin & Co., Llc | 0 | −100,00 | 0 | |||||
| 2025-08-14 | 13F | Ieq Capital, Llc | 13 843 | −6,66 | 111 | −5,93 | ||||
| 2025-04-15 | 13F | Noble Wealth Management PBC | 0 | −100,00 | 0 | |||||
| 2025-08-13 | 13F | WealthTrust Axiom LLC | 19 879 | 0,00 | 159 | 0,63 | ||||
| 2025-08-14 | 13F/A | Rockefeller Capital Management L.P. | 62 643 | 502 | ||||||
| 2025-07-11 | 13F | Pinnacle Bancorp, Inc. | 4 202 | 34 | ||||||
| 2025-08-08 | 13F | Financial Gravity Companies, Inc. | 388 | 3 | ||||||
| 2025-08-11 | 13F | WPG Advisers, LLC | 3 527 | −23,87 | 28 | −22,22 | ||||
| 2025-07-15 | 13F | Shulman DeMeo Asset Management LLC | 89 471 | −0,20 | 718 | 0,56 | ||||
| 2025-08-14 | 13F | Quantinno Capital Management LP | 10 952 | 88 | ||||||
| 2025-05-12 | 13F | Fmr Llc | 0 | −100,00 | 0 | |||||
| 2025-07-30 | 13F | FNY Investment Advisers, LLC | 3 000 | 0,00 | 0 | |||||
| 2025-08-05 | 13F | Strategic Financial Concepts, LLC | 0 | −100,00 | 0 | |||||
| 2025-07-18 | 13F | Parsons Capital Management Inc/ri | 13 695 | 0,00 | 110 | 0,00 | ||||
| 2025-08-14 | 13F | Comerica Bank | 50 420 | −16,41 | 404 | −15,83 | ||||
| 2025-08-18 | 13F | Hollencrest Capital Management | 9 862 | 0,00 | 79 | 1,28 | ||||
| 2025-07-23 | 13F | Tyche Wealth Partners LLC | 15 726 | 0,00 | 126 | 0,80 | ||||
| 2025-05-06 | 13F | AE Wealth Management LLC | 0 | −100,00 | 0 | −100,00 | ||||
| 2025-08-19 | 13F | Advisory Services Network, LLC | 108 730 | −11,81 | 877 | −10,60 | ||||
| 2025-08-14 | 13F | Wetherby Asset Management Inc | 36 995 | −2,83 | 297 | −1,00 | ||||
| 2025-07-14 | 13F | Park Avenue Securities Llc | 24 913 | −4,98 | 0 | |||||
| 2025-08-13 | 13F | Townsquare Capital Llc | 0 | −100,00 | 0 | |||||
| 2025-08-12 | 13F | Jpmorgan Chase & Co | 359 | 0,00 | 3 | 0,00 | ||||
| 2025-05-02 | 13F | Transcendent Capital Group LLC | 0 | −100,00 | 0 | |||||
| 2025-08-13 | 13F | Summit Financial, LLC | 26 404 | 214 | ||||||
| 2025-07-07 | 13F | Thurston, Springer, Miller, Herd & Titak, Inc. | 10 073 | 0,00 | 81 | 0,00 | ||||
| 2025-07-14 | 13F | Argentarii, LLC | 15 073 | −0,55 | 121 | 0,00 | ||||
| 2025-07-15 | 13F | RVW Wealth, LLC | 70 922 | 0,00 | 569 | 0,71 | ||||
| 2025-07-28 | 13F | Private Wealth Asset Management, LLC | 0 | −100,00 | 0 | |||||
| 2025-05-06 | 13F | Morling Financial Advisors, LLC | 0 | −100,00 | 0 | |||||
| 2025-07-14 | 13F | Sowell Financial Services LLC | 0 | −100,00 | 0 | |||||
| 2025-07-21 | 13F | Catalina Capital Group, LLC | 24 437 | 0,00 | 196 | 0,52 | ||||
| 2025-07-25 | 13F | Concurrent Investment Advisors, LLC | 34 531 | 5,96 | 277 | 6,56 | ||||
| 2025-08-13 | 13F | Guggenheim Capital Llc | 1 655 758 | 14,10 | 13 279 | 14,97 | ||||
| 2025-04-30 | 13F | Sofos Investments, Inc. | 0 | −100,00 | 0 | |||||
| 2025-07-16 | 13F | Perigon Wealth Management, LLC | 13 312 | 8,21 | 107 | 9,28 | ||||
| 2025-08-04 | 13F | Creekmur Asset Management LLC | 1 515 | 2,30 | 12 | 9,09 | ||||
| 2025-07-22 | 13F | Belpointe Asset Management LLC | 14 964 | −9,56 | 120 | −8,40 | ||||
| 2025-08-05 | 13F | Carson Advisory Inc. | 45 861 | −8,02 | 368 | −7,32 | ||||
| 2025-08-14 | 13F | TCG Advisory Services, LLC | 36 774 | −10,08 | 295 | −9,54 | ||||
| 2025-08-11 | 13F | Principal Securities, Inc. | 64 370 | −9,52 | 516 | −7,69 | ||||
| 2025-08-14 | 13F | Stifel Financial Corp | 598 489 | −4,97 | 4 800 | −4,27 | ||||
| 2025-07-23 | 13F | Citizens National Bank Trust Department | 1 400 | 0,00 | 11 | 0,00 | ||||
| 2025-08-14 | 13F | Prelude Capital Management, Llc | 300 000 | 0,00 | 2 406 | 0,75 | ||||
| 2025-07-11 | 13F | Farther Finance Advisors, LLC | 12 542 | 1,17 | 101 | 2,04 | ||||
| 2025-07-18 | 13F | Marino, Stram & Associates Llc | 86 571 | 0,00 | 694 | 0,73 | ||||
| 2025-08-04 | 13F | Assetmark, Inc | 612 | 0,00 | 5 | 0,00 | ||||
| 2025-07-24 | 13F | MSH Capital Advisors LLC | 220 453 | 9,63 | 1 768 | 10,50 | ||||
| 2025-08-06 | 13F | Wedbush Securities Inc | 73 289 | −3,80 | 1 | |||||
| 2025-08-12 | 13F | Horizon Kinetics Asset Management Llc | 28 250 | 0,00 | 227 | 0,89 | ||||
| 2025-08-05 | 13F | Burney Co/ | 21 710 | −37,71 | 174 | −37,18 | ||||
| 2025-08-12 | 13F | J.w. Cole Advisors, Inc. | 27 106 | 27,14 | 217 | 28,40 | ||||
| 2025-06-26 | NP | AABFX - Thrivent Balanced Income Plus Fund Class A | 5 463 | 0,00 | 42 | −2,33 | ||||
| 2025-08-15 | 13F | Provenance Wealth Advisors, LLC | 0 | −100,00 | 0 | −100,00 | ||||
| 2025-07-22 | 13F | Merit Financial Group, LLC | 25 746 | 65,14 | 206 | 66,13 |