Grundläggande statistik
| Portföljvärde | $ 154 334 599 |
| Aktuella positioner | 86 |
Senaste innehav, resultat, förvaltat kapital (från 13F, 13D)
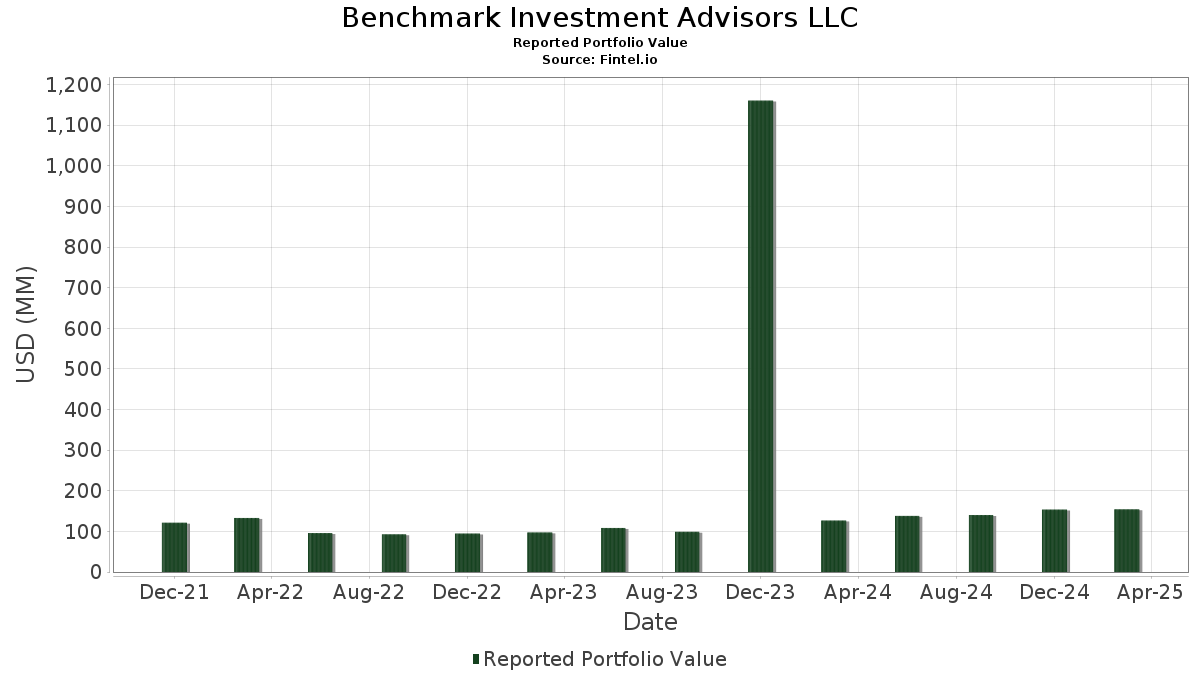
Benchmark Investment Advisors LLC har redovisat 86 totala innehav i sina senaste SEC-arkiveringar. Det senaste portföljvärdet beräknas vara $ 154 334 599 USD. Faktiskt förvaltade tillgångar (AUM) är detta värde plus likvida medel (som inte redovisas). Benchmark Investment Advisors LLCs största innehav är NVIDIA Corporation (US:NVDA) , Meta Platforms, Inc. (US:META) , Microsoft Corporation (US:MSFT) , AppLovin Corporation (US:APP) , and Broadcom Inc. (US:AVGO) . Benchmark Investment Advisors LLCs nya positioner inkluderar CyberArk Software Ltd. (US:CYBR) , .
Största ökningarna detta kvartal
Vi använder förändringen i portföljallokeringen eftersom det är det mest meningsfulla måttet. Förändringar kan bero på transaktioner eller förändringar i aktiekurser.
| Värdepapper | Aktier (MM) |
Värde (MM$) |
Portfölj % av | ΔPortfölj % av |
|---|---|---|---|---|
| 0,01 | 3,61 | 2,3412 | 1,1453 | |
| 0,03 | 2,21 | 1,4341 | 1,1229 | |
| 0,01 | 5,96 | 3,8589 | 1,0623 | |
| 0,01 | 4,27 | 2,7680 | 1,0139 | |
| 0,01 | 1,74 | 1,1273 | 0,8325 | |
| 0,00 | 1,39 | 0,9007 | 0,7091 | |
| 0,00 | 1,06 | 0,6893 | 0,6893 | |
| 0,00 | 1,03 | 0,6653 | 0,6653 | |
| 0,00 | 1,54 | 1,0009 | 0,6636 | |
| 0,02 | 4,74 | 3,0741 | 0,5741 |
Största minskningarna detta kvartal
Vi använder förändringen i portföljallokeringen eftersom det är det mest meningsfulla måttet. Förändringar kan bero på transaktioner eller förändringar i aktiepriser.
| Värdepapper | Aktier (MM) |
Värde (MM$) |
Portfölj % av | ΔPortfölj % av |
|---|---|---|---|---|
| 0,23 | 24,59 | 15,9348 | −4,9691 | |
| 0,00 | 2,95 | 1,9092 | −0,9687 | |
| 0,02 | 3,73 | 2,4166 | −0,9100 | |
| 0,02 | 5,64 | 3,6563 | −0,5830 | |
| 0,00 | 0,59 | 0,3818 | −0,5803 | |
| 0,04 | 2,86 | 1,8555 | −0,4060 | |
| 0,01 | 0,69 | 0,4440 | −0,3906 | |
| 0,00 | 1,06 | 0,6897 | −0,3733 | |
| 0,03 | 5,39 | 3,4946 | −0,3205 | |
| 0,00 | 2,36 | 1,5294 | −0,2990 |
13F- och fond arkiveringar
Denna blankett lämnades in den 2025-05-15 för rapporteringsperioden 2025-03-31. Klicka på länksymbolen för att se hela transaktionshistoriken.
Uppgradera för att låsa upp premiumdata och exportera till Excel![]() .
.
| Värdepapper | Typ | Genomsnittligt aktiepris | Aktier (MM) |
ΔAktier (%) |
ΔAktier (%) |
Värde ($MM) |
Portfölj (%) |
ΔPortfölj (%) |
|
|---|---|---|---|---|---|---|---|---|---|
| NVDA / NVIDIA Corporation | 0,23 | −5,14 | 24,59 | −23,44 | 15,9348 | −4,9691 | |||
| META / Meta Platforms, Inc. | 0,01 | 40,78 | 5,96 | 38,59 | 3,8589 | 1,0623 | |||
| MSFT / Microsoft Corporation | 0,02 | −2,74 | 5,64 | −13,37 | 3,6563 | −0,5830 | |||
| APP / AppLovin Corporation | 0,02 | 23,55 | 5,57 | 1,09 | 3,6087 | 0,0236 | |||
| AVGO / Broadcom Inc. | 0,03 | 27,38 | 5,39 | −8,00 | 3,4946 | −0,3205 | |||
| AMZN / Amazon.com, Inc. | 0,02 | 42,40 | 4,74 | 23,51 | 3,0741 | 0,5741 | |||
| GOOGL / Alphabet Inc. | 0,03 | 19,63 | 4,58 | −2,28 | 2,9686 | −0,0821 | |||
| V / Visa Inc. | 0,01 | 42,92 | 4,27 | 58,52 | 2,7680 | 1,0139 | |||
| URI / United Rentals, Inc. | 0,01 | 13,70 | 4,03 | 1,16 | 2,6092 | 0,0187 | |||
| PANW / Palo Alto Networks, Inc. | 0,02 | 32,07 | 3,84 | 23,83 | 2,4885 | 0,4705 | |||
| AAPL / Apple Inc. | 0,02 | −17,75 | 3,73 | −27,05 | 2,4166 | −0,9100 | |||
| CRWD / CrowdStrike Holdings, Inc. | 0,01 | 90,80 | 3,61 | 96,68 | 2,3412 | 1,1453 | |||
| TSM / Taiwan Semiconductor Manufacturing Company Limited - Depositary Receipt (Common Stock) | 0,02 | 3,88 | 3,05 | −12,68 | 1,9765 | −0,2969 | |||
| MA / Mastercard Incorporated | 0,01 | 2,13 | 3,00 | 6,31 | 1,9442 | 0,1077 | |||
| XPRO / Expro Group Holdings N.V. | 0,01 | 13,20 | 2,97 | 21,69 | 1,9271 | 0,3366 | |||
| FTXP / Foothills Exploration, Inc. | 0,00 | −38,24 | 2,95 | −33,38 | 1,9092 | −0,9687 | |||
| ANET / Arista Networks Inc | 0,04 | 62,51 | 2,89 | 13,94 | 1,8747 | 0,2220 | |||
| UBER / Uber Technologies, Inc. | 0,04 | −31,78 | 2,86 | −17,61 | 1,8555 | −0,4060 | |||
| JPM / JPMorgan Chase & Co. | 0,01 | 34,76 | 2,40 | 37,92 | 1,5582 | 0,4235 | |||
| EME / EMCOR Group, Inc. | 0,01 | 27,05 | 2,39 | 3,47 | 1,5457 | 0,0451 | |||
| ROP / Roper Technologies, Inc. | 0,00 | −25,92 | 2,36 | −15,98 | 1,5294 | −0,2990 | |||
| VRT / Vertiv Holdings Co | 0,03 | 628,30 | 2,21 | 362,97 | 1,4341 | 1,1229 | |||
| PH / Parker-Hannifin Corporation | 0,00 | −6,97 | 1,90 | −11,11 | 1,2295 | −0,1595 | |||
| AMAT / Applied Materials, Inc. | 0,01 | 7,88 | 1,80 | −3,69 | 1,1657 | −0,0505 | |||
| FIX / Comfort Systems USA, Inc. | 0,01 | 405,43 | 1,74 | 283,89 | 1,1273 | 0,8325 | |||
| CPRT / Copart, Inc. | 0,03 | 13,14 | 1,72 | 11,58 | 1,1113 | 0,1109 | |||
| NFLX / Netflix, Inc. | 0,00 | 29,99 | 1,69 | 35,99 | 1,0949 | 0,2863 | |||
| GWW / W.W. Grainger, Inc. | 0,00 | 14,47 | 1,60 | 7,23 | 1,0379 | 0,0663 | |||
| BKNG / Booking Holdings Inc. | 0,00 | 4,27 | 1,58 | −3,25 | 1,0213 | −0,0390 | |||
| AZO / AutoZone, Inc. | 0,00 | 7,55 | 1,57 | 28,07 | 1,0203 | 0,2202 | |||
| SPOT / Spotify Technology S.A. | 0,00 | 142,36 | 1,54 | 198,07 | 1,0009 | 0,6636 | |||
| NOW / ServiceNow, Inc. | 0,00 | 61,44 | 1,53 | 21,28 | 0,9935 | 0,1705 | |||
| SPGI / S&P Global Inc. | 0,00 | 362,94 | 1,39 | 372,79 | 0,9007 | 0,7091 | |||
| BRO / Brown & Brown, Inc. | 0,01 | −35,63 | 1,32 | −21,52 | 0,8582 | −0,2399 | |||
| DVYE / iShares, Inc. - iShares Emerging Markets Dividend ETF | 0,05 | 5,57 | 1,29 | 11,47 | 0,8383 | 0,0835 | |||
| VOO / Vanguard Index Funds - Vanguard S&P 500 ETF | 0,00 | 0,37 | 1,25 | −4,27 | 0,8128 | −0,0401 | |||
| SNPS / Synopsys, Inc. | 0,00 | −4,91 | 1,19 | −15,98 | 0,7703 | −0,1504 | |||
| MRK / Merck & Co., Inc. | 0,01 | −5,06 | 1,18 | −14,35 | 0,7621 | −0,1314 | |||
| CRM / Salesforce, Inc. | 0,00 | 259,38 | 1,08 | 188,77 | 0,6999 | 0,4563 | |||
| UNH / UnitedHealth Group Incorporated | 0,00 | −37,07 | 1,06 | −34,84 | 0,6897 | −0,3733 | |||
| CYBR / CyberArk Software Ltd. | 0,00 | 1,06 | 0,6893 | 0,6893 | |||||
| TTWO / Take-Two Interactive Software, Inc. | 0,00 | 1,03 | 0,6653 | 0,6653 | |||||
| VGSN.X / Vanguard Specialized Funds - Vanguard Real Estate ETF | 0,01 | −5,14 | 0,98 | −3,64 | 0,6350 | −0,0264 | |||
| GE / General Electric Company | 0,00 | 0,00 | 0,95 | 19,92 | 0,6168 | 0,1006 | |||
| CDW / CDW Corporation | 0,01 | 0,02 | 0,93 | −7,93 | 0,6026 | −0,0545 | |||
| KRE / SPDR Series Trust - SPDR S&P Regional Banking ETF | 0,02 | −1,07 | 0,91 | −6,88 | 0,5883 | −0,0457 | |||
| HD / The Home Depot, Inc. | 0,00 | −10,95 | 0,86 | −16,09 | 0,5544 | −0,1091 | |||
| IVE / iShares Trust - iShares S&P 500 Value ETF | 0,00 | −3,99 | 0,78 | −4,04 | 0,5080 | −0,0241 | |||
| ELV / Elevance Health, Inc. | 0,00 | −24,47 | 0,78 | −11,02 | 0,5028 | −0,0641 | |||
| WELL / Welltower Inc. | 0,01 | 0,00 | 0,78 | 21,66 | 0,5023 | 0,0873 | |||
| RSP / Invesco Exchange-Traded Fund Trust - Invesco S&P 500 Equal Weight ETF | 0,00 | −0,23 | 0,75 | −1,32 | 0,4861 | −0,0088 | |||
| JPC / Nuveen Preferred & Income Opportunities Fund | 0,09 | 0,00 | 0,70 | 1,30 | 0,4539 | 0,0038 | |||
| LRCX / Lam Research Corporation | 0,01 | −46,91 | 0,69 | −46,57 | 0,4440 | −0,3906 | |||
| BRK.A / Berkshire Hathaway Inc. | 0,00 | 0,00 | 0,68 | 17,47 | 0,4403 | 0,0640 | |||
| IWM / iShares Trust - iShares Russell 2000 ETF | 0,00 | −30,79 | 0,67 | −37,59 | 0,4373 | −0,2656 | |||
| INDA / iShares Trust - iShares MSCI India ETF | 0,01 | −7,25 | 0,66 | −9,37 | 0,4270 | −0,0458 | |||
| OXY / Occidental Petroleum Corporation | 0,01 | −4,62 | 0,61 | −4,67 | 0,3966 | −0,0214 | |||
| MCK / McKesson Corporation | 0,00 | −24,19 | 0,60 | −10,43 | 0,3896 | −0,0472 | |||
| GOOG / Alphabet Inc. | 0,00 | −51,42 | 0,59 | −60,15 | 0,3818 | −0,5803 | |||
| NTNX / Nutanix, Inc. | 0,01 | 34,64 | 0,58 | 53,83 | 0,3778 | 0,1308 | |||
| FCX / Freeport-McMoRan Inc. | 0,02 | −6,10 | 0,58 | −6,57 | 0,3778 | −0,0286 | |||
| PUT 100 INVESCO QQQ TR UNIT SER 1 EXP 06-20-25 @474.78 / PUT (99QA4017W) | 0,00 | 0,58 | 0,0000 | ||||||
| HSY / The Hershey Company | 0,00 | 0,51 | 0,3325 | 0,3325 | |||||
| ASML / ASML Holding N.V. - Depositary Receipt (Common Stock) | 0,00 | −28,75 | 0,45 | −31,97 | 0,2916 | −0,1383 | |||
| IAU / iShares Gold Trust | 0,01 | −2,52 | 0,43 | 16,09 | 0,2810 | 0,0379 | |||
| CDNS / Cadence Design Systems, Inc. | 0,00 | −12,11 | 0,42 | −25,61 | 0,2752 | −0,0963 | |||
| O / Realty Income Corporation | 0,01 | 0,00 | 0,42 | 8,53 | 0,2727 | 0,0205 | |||
| JNJ / Johnson & Johnson | 0,00 | −10,48 | 0,40 | 2,59 | 0,2571 | 0,0056 | |||
| ADI / Analog Devices, Inc. | 0,00 | −9,04 | 0,40 | −13,76 | 0,2563 | −0,0418 | |||
| ACN / Accenture plc | 0,00 | 22,30 | 0,39 | 8,38 | 0,2518 | 0,0187 | |||
| NHI / National Health Investors, Inc. | 0,01 | 0,00 | 0,37 | 6,65 | 0,2393 | 0,0138 | |||
| GEV / GE Vernova Inc. | 0,00 | 0,00 | 0,36 | −7,18 | 0,2350 | −0,0193 | |||
| NKE / NIKE, Inc. | 0,01 | 0,36 | 0,2344 | 0,2344 | |||||
| VIG / Vanguard Specialized Funds - Vanguard Dividend Appreciation ETF | 0,00 | 0,11 | 0,35 | −0,85 | 0,2259 | −0,0028 | |||
| LTC / LTC Properties, Inc. | 0,01 | 0,00 | 0,32 | 2,59 | 0,2060 | 0,0044 | |||
| FTNT / Fortinet, Inc. | 0,00 | −0,61 | 0,31 | 1,30 | 0,2018 | 0,0016 | |||
| PFF / iShares Trust - iShares Preferred and Income Securities ETF | 0,01 | −7,77 | 0,31 | −9,71 | 0,1990 | −0,0227 | |||
| CSCO / Cisco Systems, Inc. | 0,00 | −7,01 | 0,30 | −2,94 | 0,1925 | −0,0070 | |||
| ADBE / Adobe Inc. | 0,00 | −48,59 | 0,28 | −55,70 | 0,1817 | −0,2298 | |||
| TMO / Thermo Fisher Scientific Inc. | 0,00 | −11,26 | 0,27 | −15,36 | 0,1753 | −0,0324 | |||
| VRTX / Vertex Pharmaceuticals Incorporated | 0,00 | −95,52 | 0,27 | −94,68 | 0,1747 | −0,2610 | |||
| IWB / iShares Trust - iShares Russell 1000 ETF | 0,00 | 0,00 | 0,26 | −4,80 | 0,1673 | −0,0092 | |||
| ISRG / Intuitive Surgical, Inc. | 0,00 | 3,18 | 0,26 | −1,91 | 0,1666 | −0,0044 | |||
| SYK / Stryker Corporation | 0,00 | 0,00 | 0,23 | 3,17 | 0,1482 | 0,0044 | |||
| XLV / The Select Sector SPDR Trust - The Health Care Select Sector SPDR Fund | 0,00 | −15,66 | 0,21 | −10,46 | 0,1391 | −0,0170 | |||
| LLY / Eli Lilly and Company | 0,00 | 0,21 | 0,1333 | 0,1333 | |||||
| ORCL / Oracle Corporation | 0,00 | −100,00 | 0,00 | 0,0000 | |||||
| RELX / RELX PLC - Depositary Receipt (Common Stock) | 0,00 | −100,00 | 0,00 | 0,0000 | |||||
| CCFLU / CCF Holdings LLC | 0,00 | −100,00 | 0,00 | 0,0000 | |||||
| SRPT / Sarepta Therapeutics, Inc. | 0,00 | −100,00 | 0,00 | 0,0000 | |||||
| XLE / The Select Sector SPDR Trust - The Energy Select Sector SPDR Fund | 0,00 | −100,00 | 0,00 | 0,0000 | |||||
| EA / Electronic Arts Inc. | 0,00 | −100,00 | 0,00 | 0,0000 | |||||
| QQQ / Invesco QQQ Trust, Series 1 | 0,00 | −100,00 | 0,00 | 0,0000 |